Maintenance managers tracking the wrong metrics waste 12-18 hours weekly analyzing data that sounds important but reveals nothing actionable about equipment reliability, cost control, or team efficiency. A facility can have 95% PM compliance yet still suffer chronic breakdowns if those PMs target the wrong assets. Another can achieve 99% uptime on non-critical equipment while mission-critical production lines fail monthly. The difference between reactive firefighting and strategic maintenance management comes down to tracking the right 15 KPIs that directly connect daily maintenance activities to measurable business outcomes: reduced downtime, lower repair costs, extended asset life, and predictable CapEx planning. This guide presents the exact metrics that separate world-class maintenance operations from those still drowning in emergency work orders, complete with industry benchmarks, calculation formulas, and the specific CMMS data points required to track each KPI automatically rather than manually compiling spreadsheets every month. Start a free trial and see your current KPI performance calculated automatically from your maintenance data.
15
Critical KPIs
Essential metrics covering reliability, efficiency, cost control, and planning that every maintenance manager must track
73%
Time Wasted on Wrong Metrics
Maintenance teams spend majority of reporting effort on vanity metrics that look good but drive no operational improvement
$420K
Annual Cost of Poor Tracking
Average mid-size facility loses this amount yearly from preventable breakdowns and inefficient resource allocation
85%
KPIs Auto-Calculated in CMMS
Modern systems track metrics automatically from work order and asset data, eliminating manual spreadsheet compilation
Stop Guessing. Start Measuring What Actually Matters.
OxMaint calculates all 15 critical maintenance KPIs automatically from your work orders, asset records, and technician activities. No manual data entry, no spreadsheet updates, no monthly reporting meetings where everyone argues about numbers. Real-time dashboards show exactly where your operation stands against industry benchmarks and where to focus improvement efforts for maximum ROI.
Why Most Maintenance Metrics Fail to Drive Improvement
The problem is not lack of data. Maintenance teams drown in data from work orders, sensor readings, parts transactions, and labor hours. The problem is tracking metrics that measure activity rather than outcomes. A team completing 500 work orders monthly sounds productive until you discover 380 are reactive breakdowns. PM compliance at 92% looks excellent until you realize those PMs are calendar-based rather than condition-based, wasting resources on equipment that does not need service while missing assets approaching failure. Effective KPIs have three characteristics: they connect directly to business impact, they reveal where to take action, and they can be measured automatically without manual data compilation. The 15 KPIs below meet all three criteria. Book a demo to see how OxMaint tracks these metrics in real-time dashboards without manual reporting.
ACTIVITY
Activity Metrics
Work orders completed, PMs scheduled, parts ordered. High numbers feel productive but reveal nothing about reliability improvement or cost control. Team can be extremely busy yet equipment still fails unpredictably.
VANITY
Vanity Metrics
Uptime percentage including non-critical equipment, response time to work requests regardless of urgency. Numbers look impressive in presentations but do not correlate with actual operational performance or profitability.
LAGGING
Pure Lagging Indicators
Total downtime hours, annual maintenance cost, number of breakdowns. Tell you what already happened but provide zero insight into what to do differently tomorrow. Autopsy reports rather than health diagnostics.
MANUAL
Manually Compiled Data
KPIs requiring monthly spreadsheet compilation from multiple sources. Data is stale by the time it is reported, prone to calculation errors, and consumes 12-18 hours that could be spent on actual improvement work.
The 15 Essential Maintenance KPIs Every Manager Must Track
These metrics are organized into four categories covering the complete maintenance performance spectrum: equipment reliability, operational efficiency, cost management, and strategic planning. Each KPI includes the calculation formula, industry benchmarks, and what action to take when performance falls outside acceptable range.
01
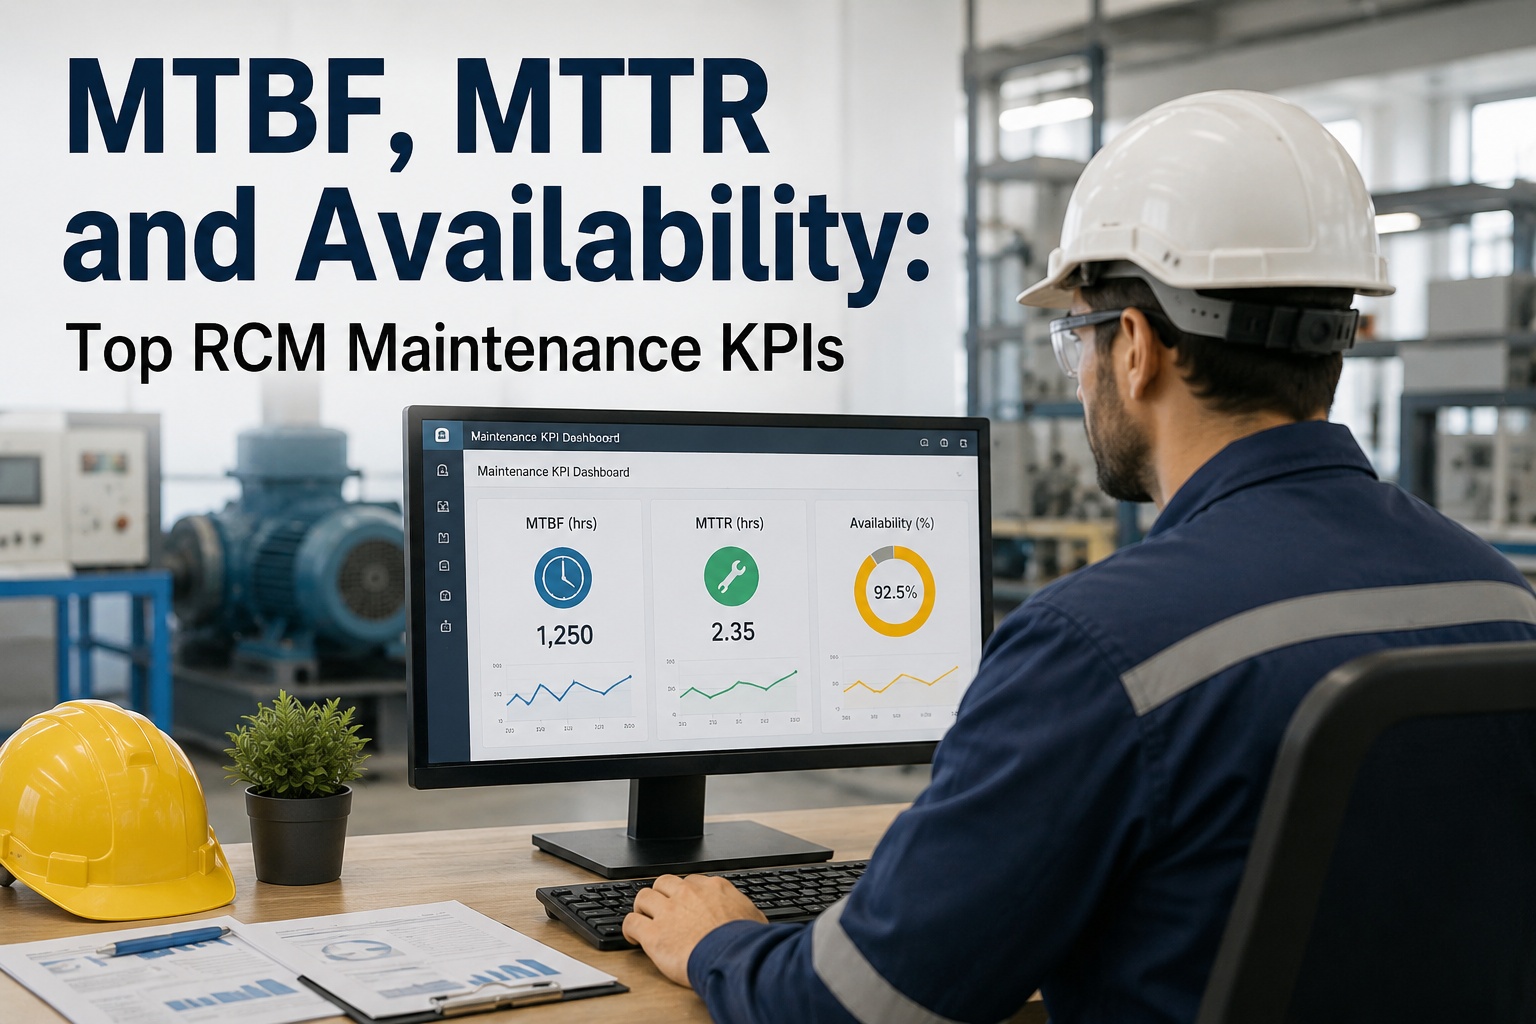
Mean Time Between Failures (MTBF)
Total Operating Hours ÷ Number of Failures
Measures average time equipment operates before experiencing a failure requiring corrective maintenance. Higher MTBF indicates more reliable equipment and effective preventive maintenance programs.
Industry Benchmark
World-Class: 2,000+ hours | Average: 800-1,500 hours | Poor: Under 500 hours
Action: MTBF declining? Review PM effectiveness, identify failure root causes, adjust maintenance intervals based on actual usage patterns.
02
Mean Time to Repair (MTTR)
Total Repair Time ÷ Number of Repairs
Average time from failure detection to equipment back in service. Lower MTTR reduces downtime impact and indicates efficient troubleshooting, parts availability, and technician skill levels.
Industry Benchmark
World-Class: Under 2 hours | Average: 4-8 hours | Poor: Over 12 hours
Action: High MTTR? Analyze delay causes (diagnosis time, parts availability, technician skill gaps). Stock critical spares, improve documentation, train technicians.
03
Overall Equipment Effectiveness (OEE)
Availability × Performance × Quality
Comprehensive production efficiency metric combining uptime, speed, and quality. OEE reveals hidden capacity losses from breakdowns, slow cycles, and defects caused by maintenance issues.
Industry Benchmark
World-Class: 85%+ | Average: 60-75% | Poor: Under 50%
Action: Low OEE? Break down into components. Availability issues = maintenance failures. Performance = wear or calibration. Quality = process control or equipment precision drift.
04
Equipment Downtime Percentage
(Total Downtime Hours ÷ Total Available Hours) × 100
Percentage of scheduled operating time lost to equipment failures and maintenance activities. Critical for understanding true production capacity and identifying worst-performing assets.
Industry Benchmark
World-Class: Under 5% | Average: 10-15% | Poor: Over 20%
Action: High downtime? Focus on top 20% of assets causing 80% of losses. Implement condition monitoring, upgrade maintenance strategies from reactive to predictive.
05
Planned vs Reactive Maintenance Ratio
(Planned Work Hours ÷ Total Work Hours) × 100
Percentage of maintenance work completed as planned versus emergency reactive repairs. Higher planned percentage indicates control over maintenance schedule and fewer unexpected failures.
Industry Benchmark
World-Class: 85%+ planned | Average: 60-75% planned | Poor: Under 50% planned
Action: Below 70% planned? Strengthen PM program, implement condition-based triggers, analyze failure patterns to prevent rather than react to breakdowns.
06
PM Compliance Rate
(PMs Completed On Time ÷ Total PMs Due) × 100
Percentage of scheduled preventive maintenance tasks completed within planned timeframe. Measures discipline in executing PM program and impacts equipment reliability directly.
Industry Benchmark
World-Class: 95%+ | Average: 85-90% | Poor: Under 80%
Action: Low compliance? Identify root cause (workload imbalance, parts stockouts, unrealistic schedules). Adjust PM intervals to usage-based rather than rigid calendar.
07
Schedule Compliance
(Work Orders Completed As Scheduled ÷ Total Scheduled Work Orders) × 100
Percentage of all scheduled work completed on planned date without delay or rescheduling. Indicates planning accuracy and ability to execute maintenance plan without disruptions.
Industry Benchmark
World-Class: 90%+ | Average: 75-85% | Poor: Under 65%
Action: Poor schedule compliance? Review planning accuracy, technician workload distribution, parts availability before scheduling. Emergency breakdowns disrupting schedule indicate weak PM program.
08
Wrench Time
(Direct Productive Work Time ÷ Total Work Time) × 100
Percentage of shift time technicians spend with tools in hand performing actual maintenance work versus travel, waiting for parts, searching for information, or administrative tasks.
Industry Benchmark
World-Class: 55%+ | Average: 35-45% | Poor: Under 25%
Action: Low wrench time? Analyze time losses (travel, parts retrieval, waiting for equipment access). Improve parts staging, work order clarity, reduce walking distances.
09
Maintenance Cost as Percentage of RAV
(Annual Maintenance Cost ÷ Replacement Asset Value) × 100
Total maintenance spending relative to asset replacement value. Helps identify assets costing more to maintain than they are worth and supports repair-versus-replace decisions.
Industry Benchmark
World-Class: 2-3% | Average: 4-6% | Poor: Over 8%
Action: Above 8% on specific assets? Analyze total cost of ownership. Asset may be beyond economic repair point. Build business case for replacement versus continued repair.
10
Emergency Maintenance Cost Ratio
(Emergency Repair Cost ÷ Total Maintenance Cost) × 100
Percentage of maintenance budget consumed by unplanned emergency repairs. Emergency work costs 3-5x more than planned maintenance due to overtime, expedited parts, and production losses.
Industry Benchmark
World-Class: Under 15% | Average: 25-35% | Poor: Over 45%
Action: High emergency costs? Root cause analysis on chronic failures. Strengthen PM program, implement condition monitoring, stock critical spares to reduce expediting costs.
11
Parts Inventory Turnover
Annual Parts Usage Cost ÷ Average Inventory Value
How many times per year parts inventory cycles through. Low turnover indicates excess stock tying up cash. Too high suggests stockouts and delays waiting for parts during repairs.
Industry Benchmark
World-Class: 4-6 turns/year | Average: 2-4 turns/year | Poor: Under 1.5 turns/year
Action: Low turnover? Audit slow-moving inventory, eliminate obsolete stock, implement min/max levels. High turnover with frequent stockouts? Increase safety stock on critical items.
12
Overtime Percentage
(Overtime Hours ÷ Total Work Hours) × 100
Percentage of labor hours worked as overtime rather than regular time. Consistent high overtime signals inadequate staffing, poor planning, or chronic reactive maintenance driving emergency calls.
Industry Benchmark
World-Class: Under 5% | Average: 8-12% | Poor: Over 15%
Action: High overtime? Analyze root causes (emergency breakdowns, understaffing, seasonal peaks). Reduce reactive work through better PM, hire additional staff if sustained demand justifies.
13
Backlog Work Hours
Total Hours of Outstanding Work Orders ÷ Available Crew Hours Per Week
Number of weeks of work waiting in the queue at current crew capacity. Healthy backlog ensures crew stays busy. Excessive backlog indicates chronic understaffing or poor prioritization.
Industry Benchmark
World-Class: 2-4 weeks | Average: 4-8 weeks | Poor: Over 12 weeks
Action: Excessive backlog? Prioritize ruthlessly, defer non-critical work, consider contractor support. Zero backlog? Crew underutilized or work planning inadequate.
14
Asset Condition Score
Weighted Average of Individual Asset Health Ratings (1-10 scale)
Portfolio-wide view of asset health based on age, condition, maintenance history, and remaining useful life. Supports CapEx planning and identifies assets approaching end of economic life.
Industry Benchmark
World-Class: 7.5-9.0 | Average: 5.5-7.0 | Poor: Under 5.0
Action: Declining condition scores? Prioritize assets in red zone for replacement. Build CapEx forecast based on condition trends. Increase PM frequency on borderline assets to extend life.
15
PM Effectiveness
(Failures Prevented ÷ Total PM Activities) × 100
Measures whether preventive maintenance activities actually prevent failures or waste resources on unnecessary tasks. High-value PMs catch developing issues. Low-value PMs service equipment that does not need it.
Industry Benchmark
World-Class: 75%+ | Average: 50-65% | Poor: Under 40%
Action: Low effectiveness? Audit PM program. Eliminate calendar-based tasks on reliable equipment. Shift to condition-based triggers on critical assets. Focus PM effort where failure consequences are highest.
How to Start Tracking These KPIs Without Manual Spreadsheets
The barrier to effective KPI tracking is not understanding which metrics matter. The barrier is the manual data compilation burden that makes monthly reporting a dreaded task consuming two full workdays. Modern CMMS platforms calculate all 15 KPIs automatically from work order completions, asset records, parts transactions, and labor hours already captured in the system. The key is structuring data entry at the source so KPI calculations happen in real-time without additional effort. Start free with OxMaint and see your KPI dashboard populate automatically from your first work orders.
Step 1
Capture Work Order Data at Source
Technicians record start time, completion time, work type (PM vs reactive), and actual labor hours on mobile devices as they close work orders. No separate timesheet or manual logging required. CMMS calculates MTTR, wrench time, planned vs reactive ratio automatically.
Step 2
Link Work to Asset Records
Every work order ties to specific asset. System tracks failure history, downtime events, and maintenance costs by asset. MTBF, equipment downtime, and maintenance cost percentages calculate without manual equipment-by-equipment analysis.
Step 3
Automate PM Scheduling and Tracking
PM tasks auto-generate based on calendar, meter readings, or condition triggers. System tracks completed vs scheduled PMs, on-time vs late completions. PM compliance and schedule compliance metrics update in real-time without manual tracking.
Step 4
Monitor Inventory Automatically
Parts used recorded when issued to work orders. CMMS tracks inventory value, usage costs, and turnover rates continuously. Alerts trigger when inventory levels fall below minimums or exceed maximums.
Step 5
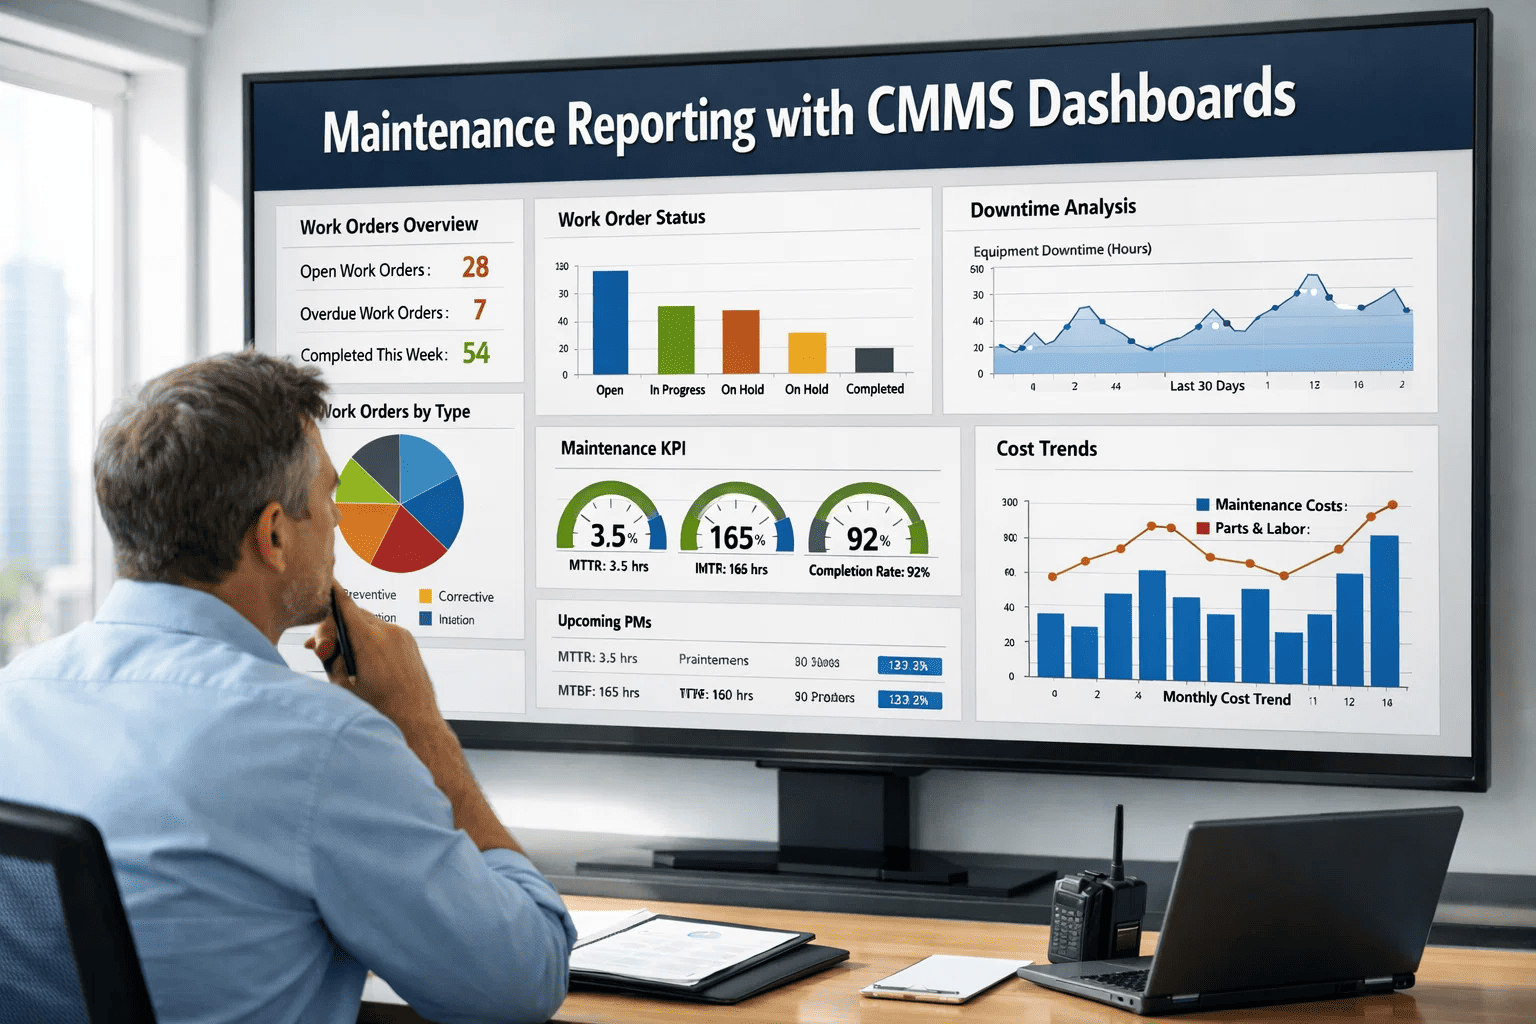
View Real-Time Dashboards
All 15 KPIs displayed on dashboard updated continuously as work completes. Drill down from portfolio level to facility to asset. Export reports for leadership meetings. No manual data compilation ever required.
KPI Benchmarking by Industry Vertical
Target KPI values vary significantly by industry due to differences in equipment criticality, operational tempo, and acceptable downtime thresholds. Manufacturing demands higher OEE and lower MTTR than commercial real estate. Healthcare requires higher PM compliance for regulatory reasons. Use these benchmarks to set realistic performance targets for your operation.
| Industry Vertical |
Target OEE |
Target MTBF |
Planned Maintenance % |
PM Compliance Target |
| Automotive Manufacturing |
85-90% |
2,000+ hours |
85-90% |
98%+ |
| Food & Beverage |
75-85% |
1,500-2,000 hours |
80-85% |
95%+ |
| Chemical Processing |
80-88% |
1,800-2,500 hours |
85-90% |
97%+ |
| Pharmaceutical |
70-80% |
1,200-1,800 hours |
90-95% |
99%+ |
| Commercial Real Estate |
N/A |
800-1,200 hours |
70-80% |
90-95% |
| Healthcare Facilities |
N/A |
1,000-1,500 hours |
80-85% |
95-98% |
| Data Centers |
99%+ uptime |
3,000+ hours |
90-95% |
99%+ |
| Utilities (Power) |
85-92% |
2,500+ hours |
85-90% |
98%+ |
Common KPI Tracking Mistakes to Avoid
Even facilities tracking the right KPIs can make implementation mistakes that render metrics meaningless or misleading. These six errors undermine KPI programs and waste the effort invested in measurement.
Error 1
Treating All Assets Equally
Calculating portfolio-wide MTBF or OEE obscures performance differences between critical production equipment and non-critical support systems. Segment KPIs by asset criticality. A 2-hour MTTR on a production line demands action. Same metric on office HVAC may be acceptable.
Error 2
Monthly Reporting Without Action
Generating KPI reports for leadership meetings without using metrics to drive improvement decisions. KPIs are diagnostic tools, not scorecards. Low PM compliance should trigger workload analysis and scheduling adjustments, not just appear in red on a slide.
Error 3
Inconsistent Data Collection
Allowing work order close-out without required fields completed. Missing labor hours, incomplete downtime tracking, or vague work descriptions make KPI calculations unreliable. Enforce data quality at source through mandatory fields and mobile validation.
Error 4
Ignoring Leading Indicators
Focusing exclusively on lagging metrics like total downtime or maintenance cost without tracking leading indicators like PM compliance or backlog hours. Lagging metrics tell you problems exist. Leading indicators show problems developing before they impact production.
Error 5
Setting Unrealistic Targets
Demanding world-class performance from average equipment with average budgets. A 30-year-old production line will not achieve 90% OEE regardless of maintenance effort. Set targets based on asset condition, budget reality, and industry benchmarks for similar operations.
Error 6
Manual Calculation Dependency
Building KPI tracking on manual spreadsheet compilation that consumes 12-18 hours monthly and delays data availability by weeks. By the time last month's metrics are reported, the opportunity to intervene has passed. Real-time automated tracking enables proactive management.
Frequently Asked Questions
Which KPI is most important if I can only track one metric?
Planned vs Reactive Maintenance Ratio reveals whether you control your maintenance program or the equipment controls you. Operations with 70%+ planned work demonstrate disciplined PM programs that prevent failures. Those under 50% planned spend majority of resources fighting fires, which drives poor performance across every other KPI. Improving this ratio creates cascading benefits: higher MTBF, lower MTTR, reduced costs, better schedule compliance. Start here and other metrics improve naturally.
How often should I review maintenance KPIs?
Leading indicators (PM compliance, schedule compliance, backlog) require weekly review to catch developing issues before they impact operations. Monthly reviews sufficient for lagging indicators (MTBF, maintenance costs, asset condition). Quarterly deep-dives compare performance to industry benchmarks and adjust targets. Real-time dashboards enable continuous monitoring without formal review meetings. Set alerts for critical thresholds to avoid waiting for scheduled reviews when immediate action needed.
Can small facilities with under 10 technicians benefit from formal KPI tracking?
Yes, small teams benefit more from KPI tracking than large operations because every hour of wasted effort has larger proportional impact. A 3-person maintenance crew cannot afford reactive firefighting consuming 60% of available hours. Tracking planned vs reactive ratio and PM compliance helps small teams operate strategically despite limited resources. Modern CMMS platforms automate KPI calculation regardless of team size, eliminating manual tracking burden that small facilities cannot absorb.
Start free and test automated KPI tracking with small team workflows.
What do I do if multiple KPIs are outside acceptable range simultaneously?
Prioritize based on root cause relationships. Poor PM compliance typically drives low MTBF, high reactive maintenance percentage, and excessive emergency costs. Fixing PM program addresses multiple symptoms simultaneously. Similarly, high MTTR often stems from parts stockouts or poor documentation, both solvable with targeted improvements. Resist trying to fix everything at once. Identify the 1-2 upstream issues causing cascading problems across multiple KPIs and focus improvement efforts there first.
Book a demo to see how OxMaint identifies root cause patterns across correlated KPIs.
How accurate do work order labor hours need to be for valid KPI calculations?
Precision to the nearest 15 minutes sufficient for most KPI purposes. Wrench time, MTTR, and labor cost metrics do not require minute-by-minute accuracy to identify trends and improvement opportunities. The critical factor is consistency: if technicians round all work orders the same way, trends remain valid even if individual entries approximate. Mobile time tracking with start/stop buttons improves accuracy versus end-of-shift estimates from memory. Avoid making technicians accountable for every minute, which breeds time-card gaming and reduces data reliability.
Should I share KPI performance publicly with the maintenance team?
Yes, transparency drives accountability and engagement. Display current KPI performance on digital boards in maintenance areas. Share monthly trends in team meetings with context on what drives each metric and how team actions impact results. Avoid individual technician scorecards that create competition rather than collaboration. Focus on team and facility-level metrics that everyone contributes to improving. Celebrate wins when KPIs improve. Involve team in problem-solving when metrics decline rather than assigning blame.
Stop Drowning in Data. Start Tracking Metrics That Drive Real Improvement.
OxMaint calculates all 15 critical maintenance KPIs automatically from work orders, asset records, and technician activity captured in the normal course of work. No manual spreadsheets, no monthly data compilation marathons, no arguing about numbers. Real-time dashboards show where you stand, where to focus improvement efforts, and whether changes are working. Track what matters. Act on what you track.