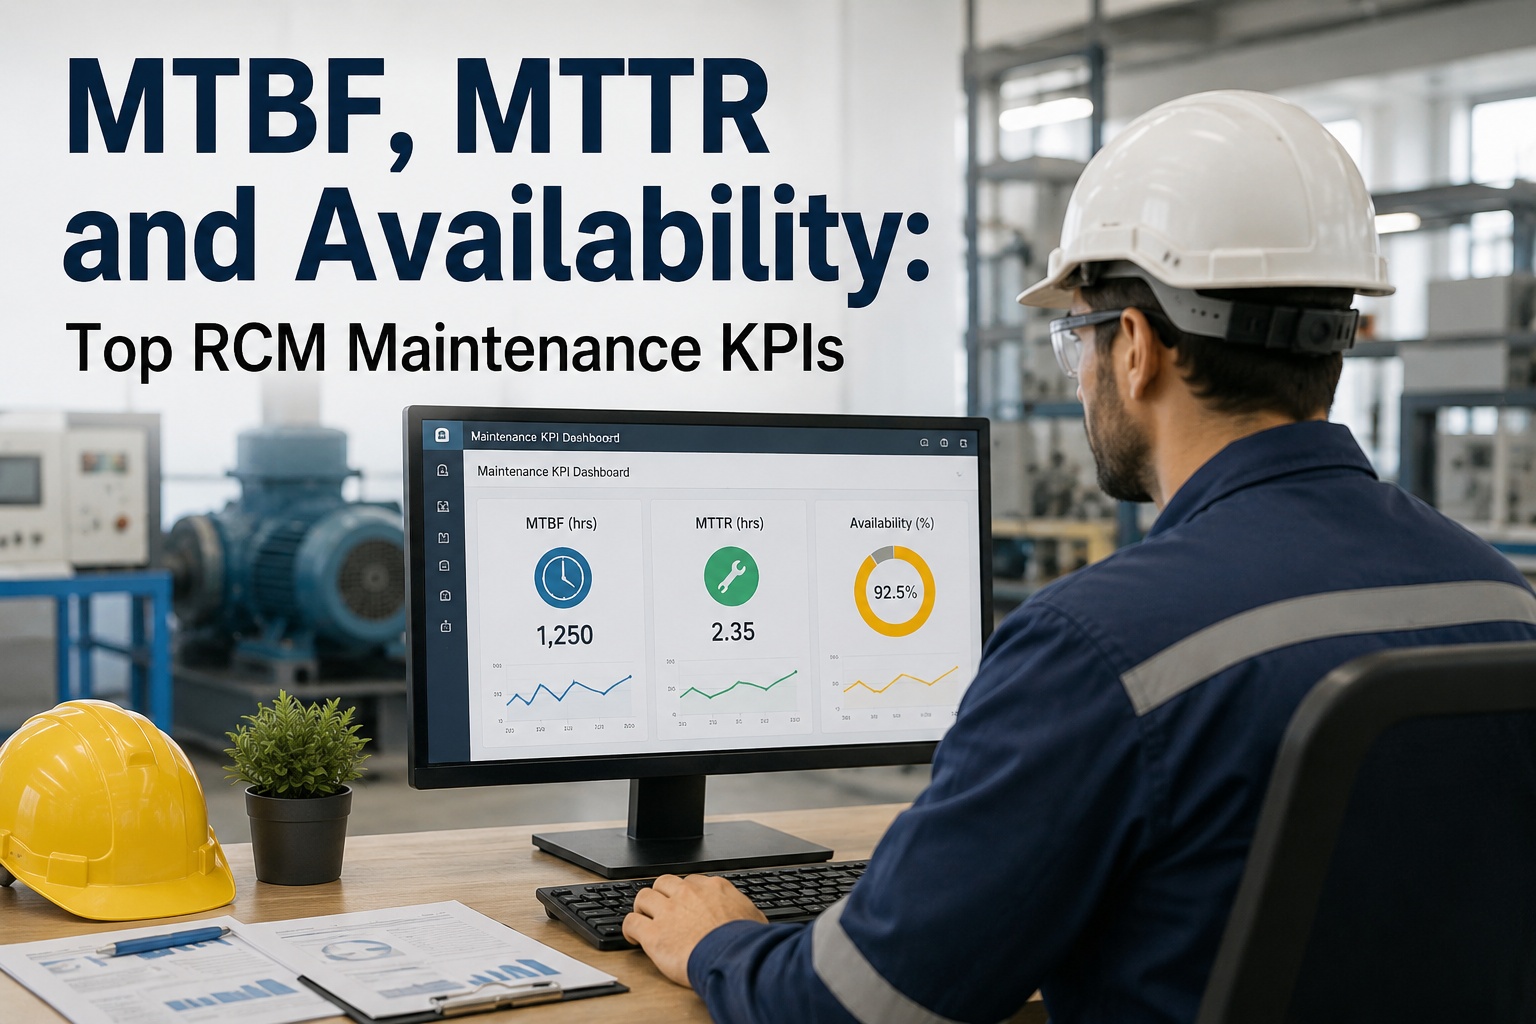
MTBF, MTTR, and availability are the three reliability KPIs that tell you exactly how healthy your plant is — and whether your maintenance strategy is working or just generating paperwork. Mean time between failures (MTBF) measures how long equipment runs before it breaks, mean time to repair (MTTR) measures how fast you fix it, and availability combines both into a single percentage that predicts production capacity. Most plants track these numbers in spreadsheets that nobody looks at until the quarterly review, which means the data never changes a single decision on the floor. This guide gives you the formulas, the industry benchmarks, and the improvement strategies that actually move these numbers — and shows how OxMaint computes all three automatically from your work order history so you can act on trends in real time instead of discovering problems three months late. If you're ready to stop calculating KPIs by hand, Start Free Trial and see your live reliability dashboard in under an hour.
Is Your Availability Above 90% — Or Are You Guessing?
World-class plants hold availability at 92–96% and MTTR under 4 hours. Most reactive operations sit at 78–85% availability with no idea why. The gap between those two numbers is usually worth $200K–$2M a year in lost production.
MTBF Calculation Formula, MTTR, and Availability — Defined With Numbers
These three KPIs are mathematically linked: availability is a direct function of MTBF and MTTR, so improving either one lifts your capacity. Here are the exact formulas with a worked example from a real packaging line.
A filler runs 720 hours in a month and fails 4 times: MTBF = 720 ÷ 4 = 180 hours. Higher is better — it means longer stretches of uninterrupted production.
Those 4 failures took 3, 5, 2 and 6 hours to fix: MTTR = 16 ÷ 4 = 4 hours. Lower is better — every hour saved is an hour of production recovered.
180 ÷ (180 + 4) × 100 = 97.8% availability. This is the inherent availability percentage calculation used in RCM and OEE programs worldwide.
MTTR Benchmark by Industry and World-Class MTBF Targets
A "good" MTTR in food processing would be a crisis in data centers. Use these ranges to see where your operation stands — and how far the gap is to world-class.
| Industry | Typical MTTR | World-Class MTTR | Availability Target |
|---|---|---|---|
| Discrete manufacturing | 4–8 hrs | < 2 hrs | 92–95% |
| Food & beverage | 2–6 hrs | < 1.5 hrs | 90–94% |
| Oil, gas & chemicals | 6–12 hrs | < 4 hrs | 95–97% |
| Facilities & hospitals | 3–8 hrs | < 2 hrs | 97–99% |
| Fleet & logistics | 4–10 hrs | < 3 hrs | 93–96% |
| Data centers / utilities | 1–4 hrs | < 1 hr | 99%+ |
World-class MTBF targets depend on asset criticality, but a common rule of thumb from RCM methodology: critical rotating equipment should exceed 6 months between failures, and no asset should fail more than twice a year without triggering a root-cause analysis. If your MTBF trend analysis shows a critical pump failing every 6–8 weeks, that's not bad luck — it's a maintenance strategy problem.
MTTR Reduction Strategies and MTBF Improvement Methods That Work
Cutting MTTR from 6 hours to 3 hours on a line worth $5,000/hour recovers $15,000 per failure. Here's where the gains actually come from — ranked by typical impact.
Fix the spare-parts problem first — it's 30–40% of MTTR
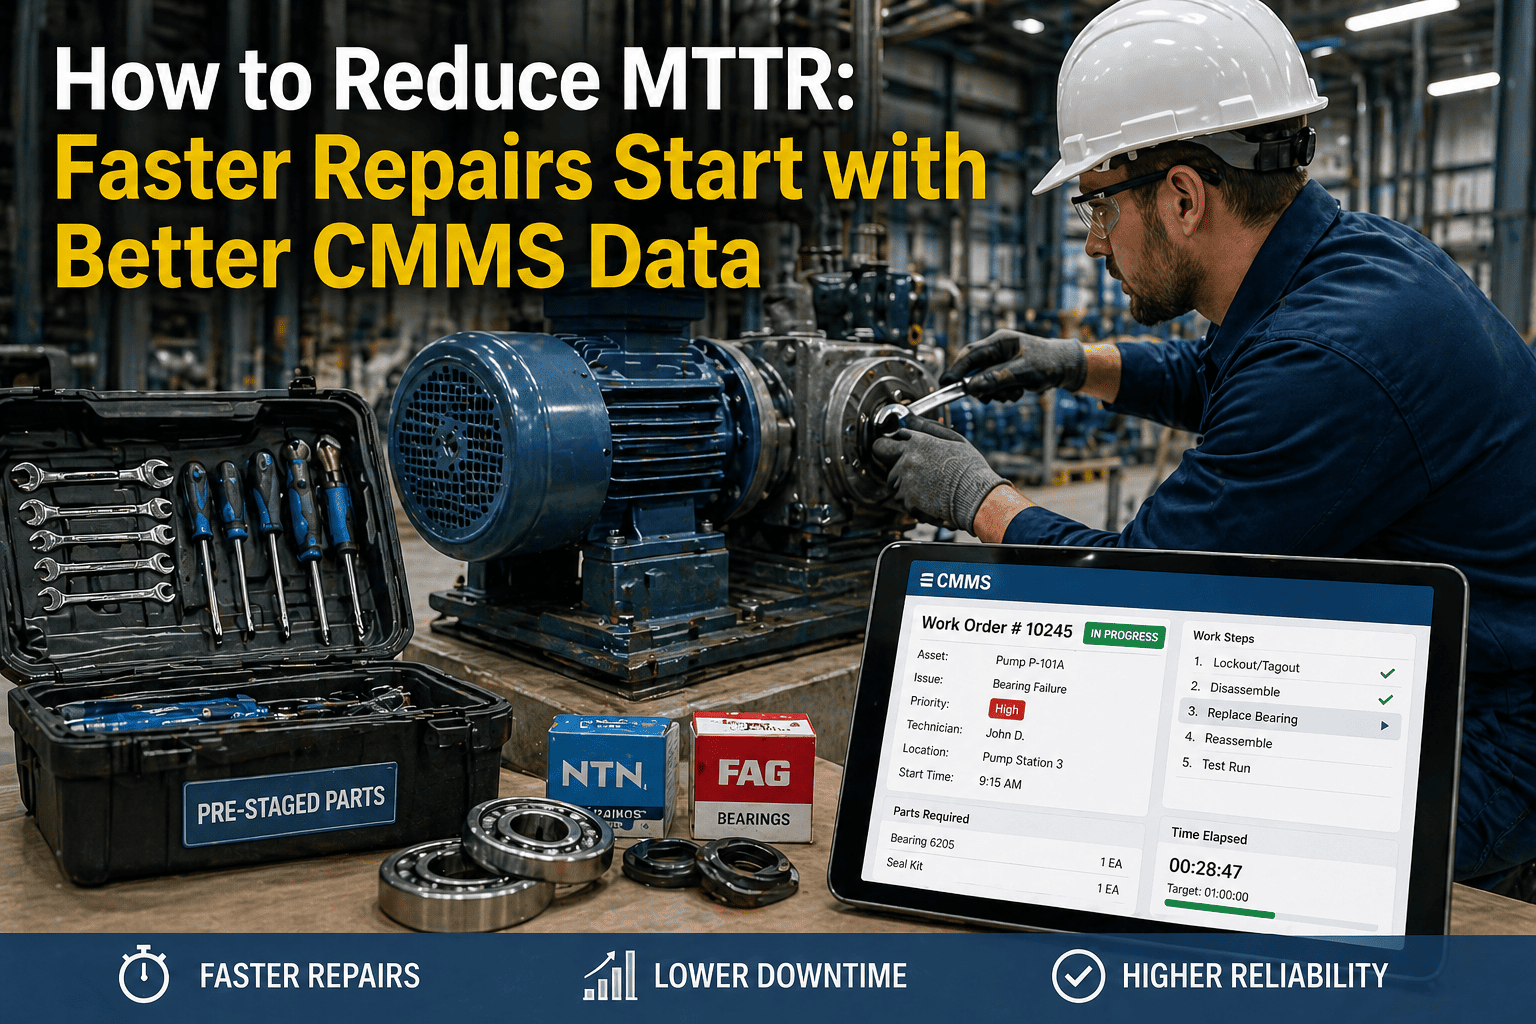
Technicians spend over a third of repair time hunting for parts, checking stockrooms, or waiting on emergency orders. The MTTR spare parts impact is brutal: a $40 bearing you don't have in stock can idle a $2M line for two days. OxMaint links parts to assets and work orders, auto-decrements inventory, and flags low stock before it stalls a repair.
Attach repair history and procedures to every asset
When a technician opens a work order and sees the last three fixes, the OEM manual, and photos of the correct bearing orientation, diagnosis time drops 25–50%. Tribal knowledge walking out the door at retirement is the silent MTTR killer in most plants.
Shift PMs from calendar-based to condition-based to lift MTBF
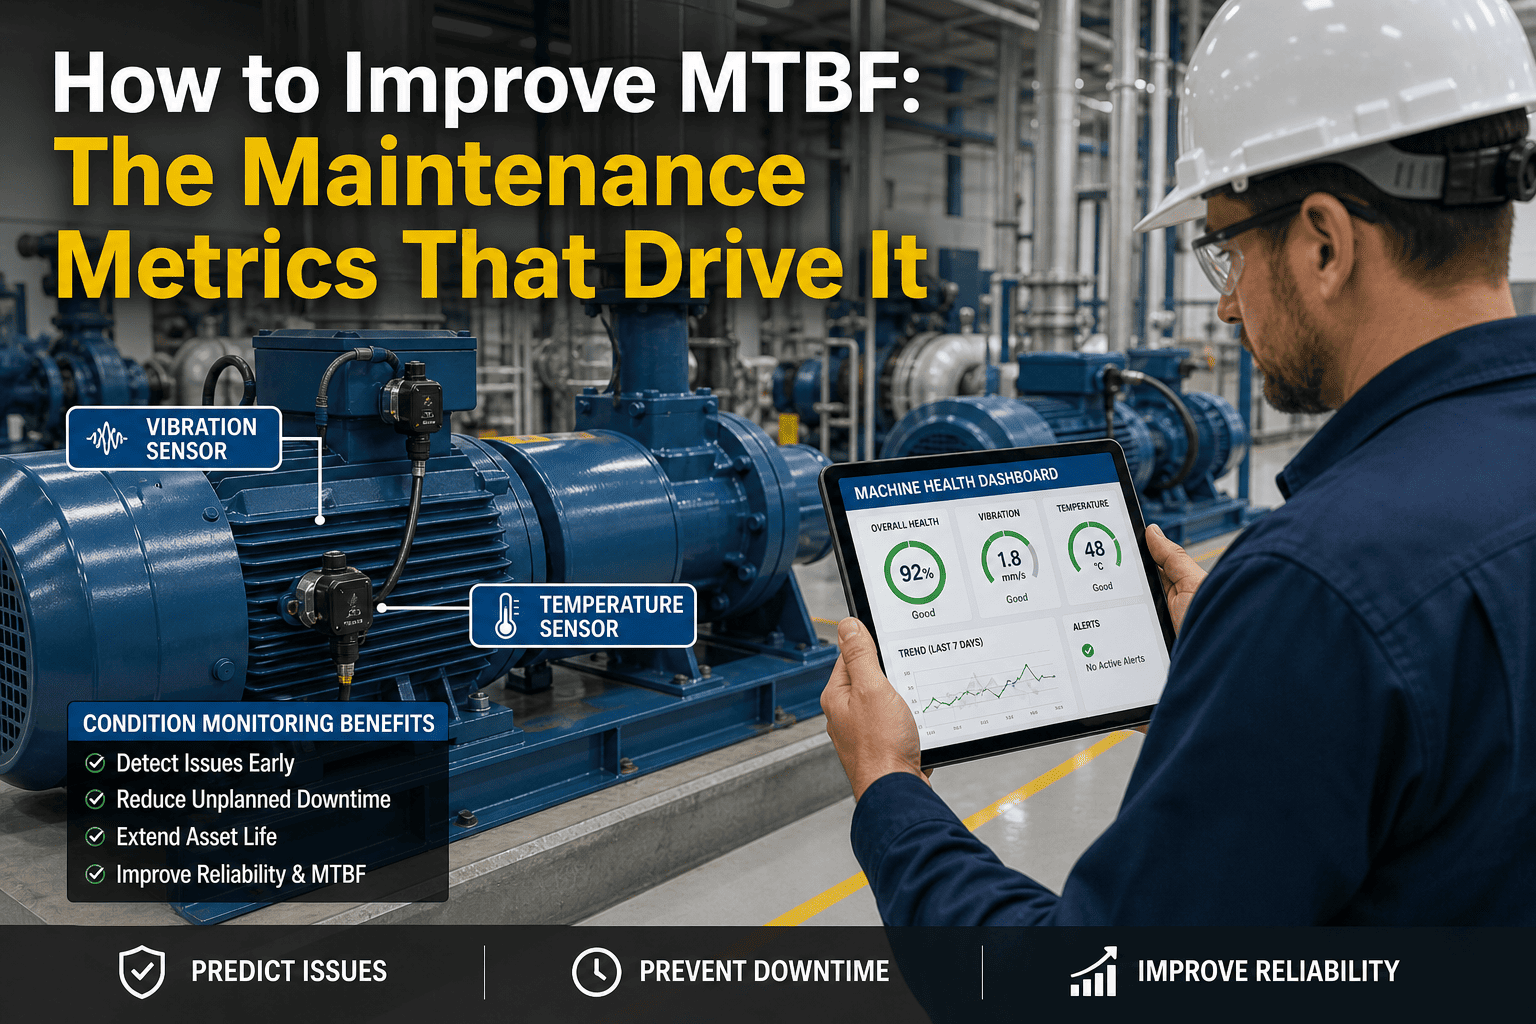
Calendar PMs catch maybe 30% of failure modes; condition monitoring and predictive maintenance catch 70%+. Plants that add vibration, temperature, or oil analysis to critical assets typically see MTBF climb 40–90% within 18 months — the single biggest MTBF improvement method available.
Run root-cause analysis on every repeat failure
If the same asset fails twice within 90 days, the repair fixed the symptom, not the cause. A structured 5-Why or fishbone review on repeat offenders typically eliminates 20–30% of total failure events within a year — pure MTBF gain with zero capital spend.
Watch the MTBF trend, not the snapshot
A single month's MTBF is noise. MTBF trend analysis over 6–12 months reveals whether your reliability program is working, which asset classes are degrading, and where to point your next reliability dollar. OxMaint charts this automatically per asset, line, and site.
Beyond the Big Three: The Maintenance KPI Dashboard Your Team Will Actually Use
MTBF, MTTR, and availability tell you outcomes. These supporting KPIs tell you what to change. Pick three or four — tracking twelve KPIs means acting on none.
PM Compliance
Percentage of preventive work orders completed on schedule. Below 85%, your PM program is a suggestion. This is the leading indicator of future MTBF.
Schedule Attainment
Planned work completed vs. planned. Low attainment means reactive work is eating your schedule — a reliable predictor of rising MTTR.
Wrench Time
Share of a technician's day spent hands-on tools. Industry average is 25–35%; world-class is 55%+. The gap is travel, parts-hunting, and paperwork — all fixable with mobile work orders.
Maintenance Cost % of RAV
Annual maintenance spend as a percentage of replacement asset value. Under 2% often means you're under-maintaining; over 4.5% usually signals chronic reactive work.
Reactive Work Ratio
Emergency and breakdown hours as a share of total maintenance hours. Reactive work costs 3–5× planned work, so this ratio directly drives your maintenance budget.
OEE Calculation Maintenance Link
Overall Equipment Effectiveness = Availability × Performance × Quality. Your availability KPI feeds OEE directly — improving availability from 85% to 92% can lift OEE 6–8 points with no other change.
Reliability KPI Tracking Without Spreadsheets: What OxMaint Automates
Every KPI in this guide is computed live from your work order and asset data — no manual rollups, no month-end Excel marathons, no numbers that are 30 days stale.
Automatic MTBF, MTTR & availability per asset
OxMaint calculates all three from completed work orders and downtime logs, with trend charts by asset, line, and site. Reliability teams spot degrading assets weeks before the next failure — cutting unplanned downtime 30–50%.
Live maintenance KPI dashboard
PM compliance, schedule attainment, reactive ratio, and cost per asset update in real time — on the technician's phone and the plant manager's weekly review. One source of truth, zero spreadsheet wrangling.
Spare-parts inventory tied to work orders
Parts auto-decrement when used, reorder points trigger alerts, and every asset shows its bill of materials. Plants typically cut parts-related repair delays — the biggest MTTR driver — by 40% in the first year.
AI-powered predictive maintenance
OxMaint's AI flags failure patterns in your work order history and sensor data, recommending PM adjustments before breakdowns happen — the fastest route to world-class MTBF targets.
See Your Real MTBF, MTTR and Availability — Live
Book a 30-minute demo and we'll show you OxMaint's reliability dashboards configured for your asset types and industry benchmarks.
MTBF, MTTR and Availability: Common Questions
What is a good MTBF for manufacturing equipment?
It depends on asset criticality, but a widely used RCM benchmark is 6+ months between failures for critical rotating equipment. More useful than any absolute number is the trend: if your MTBF is rising quarter over quarter, your reliability program is working. OxMaint charts MTBF trends automatically per asset so you can see the direction at a glance.
How do I reduce MTTR quickly?
Start with spare parts and information — they account for most repair delay. Ensure critical spares are stocked and linked to assets, and attach repair history, manuals, and procedures to every work order. Plants that digitize these two areas with a CMMS typically cut MTTR 25–40% within six months. Start Free Trial to see how OxMaint handles both out of the box.
What is the difference between MTBF and MTTR?
MTBF (mean time between failures) measures reliability — how long equipment runs before breaking. MTTR (mean time to repair) measures maintainability — how fast you restore it. MTBF improves through better preventive and predictive maintenance; MTTR improves through faster diagnosis, parts availability, and clear procedures. Both feed the availability formula.
How is equipment availability calculated?
The standard inherent availability formula is MTBF ÷ (MTBF + MTTR) × 100. An asset with 500 hours MTBF and 5 hours MTTR has 99% availability. For operational availability, use total uptime ÷ total calendar time instead — it captures all delays, not just repair time. World-class plants hold 92–96% on critical lines.
Which maintenance KPIs should I track first?
Start with three: availability (the outcome), PM compliance (the leading indicator), and reactive work ratio (the cost driver). Add MTBF and MTTR per critical asset once work orders are flowing consistently. Book a Demo and we'll walk you through a KPI dashboard configured for your industry in 30 minutes.
Stop Calculating KPIs. Start Improving Them.
OxMaint turns your work orders into live MTBF, MTTR, and availability dashboards — so every number drives a decision, not just a report.