Manufacturing plants operating at 60% OEE are losing nearly half their production capacity every single shift — and most do not even realize it. Overall Equipment Effectiveness breaks production into three measurable dimensions — Availability, Performance, and Quality — giving maintenance and operations teams a precise roadmap for recovering hidden capacity without purchasing new equipment. This guide walks you through the complete OEE formula with real calculations, reveals the six loss categories draining your output, and shows how AI-powered CMMS software turns OEE from a static report into a real-time optimization engine. Schedule a free consultation to discover how Oxmaint helps manufacturing plants measure, track, and improve OEE automatically.
What Is Overall Equipment Effectiveness (OEE) in Manufacturing?
Overall Equipment Effectiveness is the gold standard metric for measuring true manufacturing productivity. It answers one critical question: of all the time your equipment was scheduled to produce, what percentage was actually spent making good parts at full speed? Without OEE, plant managers rely on gut feeling and fragmented data — a machine looks busy all shift yet produces far below its real capacity because micro-stops, slow cycles, and quality rejects go untracked.
60-65%
Average OEE across discrete manufacturing — meaning 35-40% of capacity is wasted
85%
World-class benchmark — only 3% of manufacturers achieve this consistently
$260K+
Annual revenue lost per production line running at 60% instead of 85% OEE
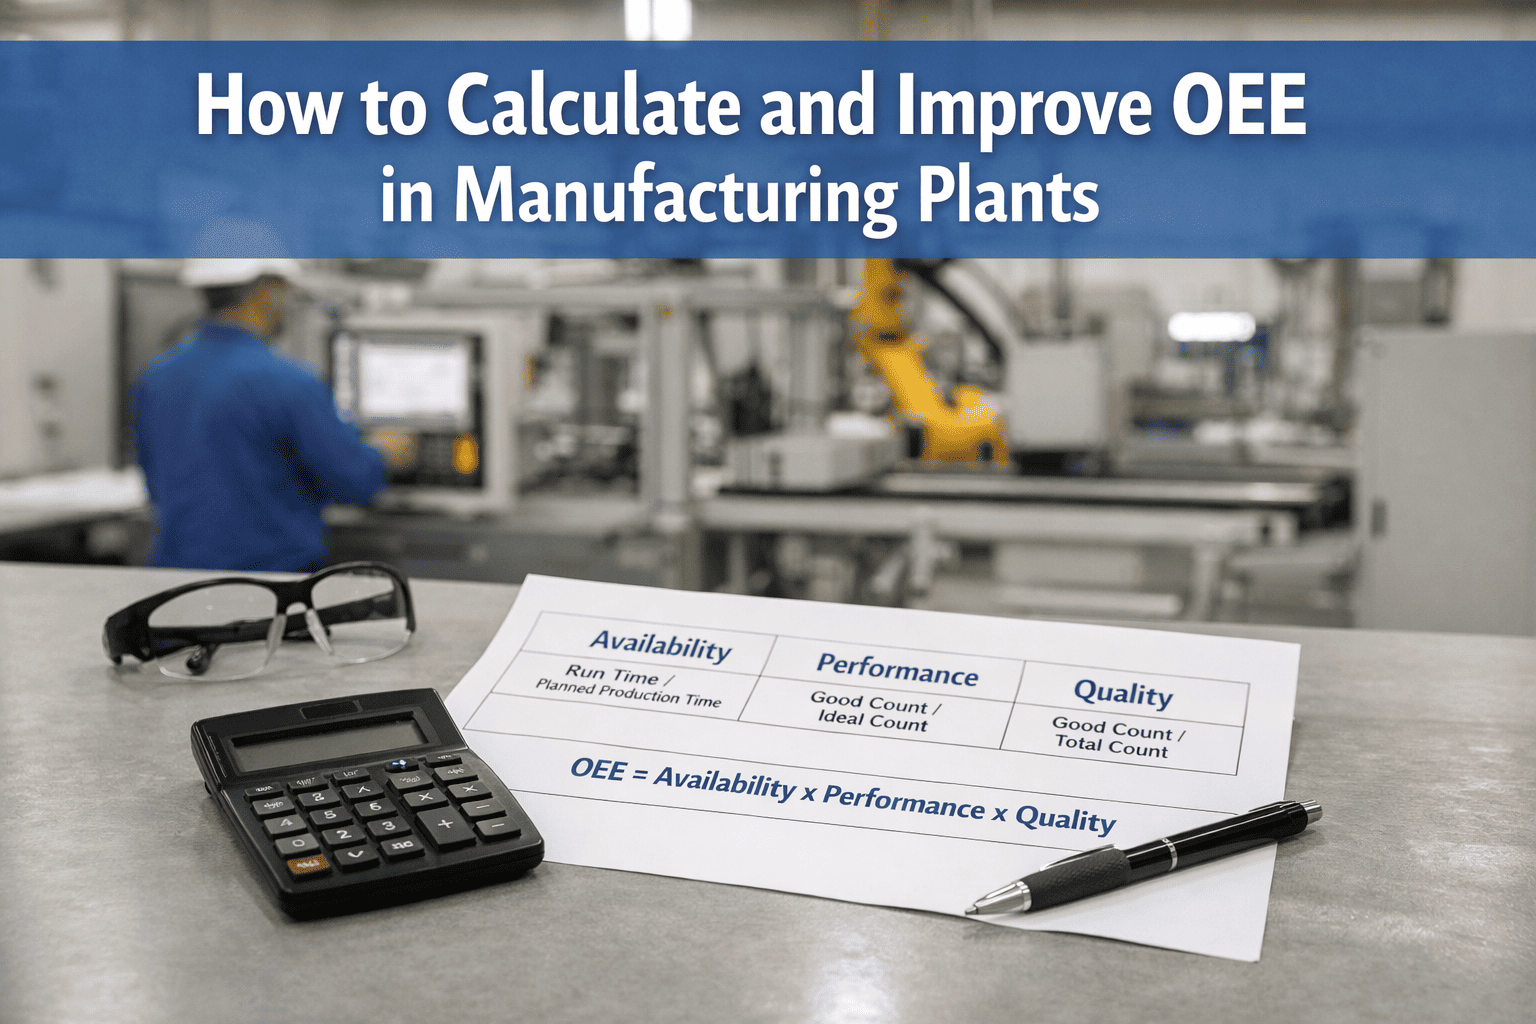
OEE Formula: How Availability, Performance, and Quality Work Together
OEE multiplies three independent percentages. Each one isolates a different type of production loss, making it straightforward to pinpoint where improvement efforts deliver the biggest return. A perfect score of 100% means you are manufacturing only good parts, at maximum speed, with zero stop time.
A
Availability
Run Time / Planned Production Time
Percentage of scheduled time the equipment actually ran. Covers all stops — breakdowns, changeovers, material shortages, and cleaning.
Target: 90%+ for world-class
x
P
Performance
(Ideal Cycle Time x Total Count) / Run Time
How close actual speed is to the designed maximum. Captures slow cycles from worn tooling, small stops from jams, and reduced operator speed.
Target: 95%+ for world-class
x
Q
Quality
Good Count / Total Count
Ratio of good parts produced on the first pass. Includes startup rejects, in-process defects from drift, and any rework items.
Target: 99%+ for world-class
Your plant is losing capacity every shift without knowing it. Create your free Oxmaint account to start tracking Availability, Performance, and Quality across every machine — and see exactly where your OEE losses hide.
How to Calculate OEE: Real Production Line Example
Theory only becomes useful when you apply it. Here is a complete walkthrough for a packaging line running an 8-hour shift — the same approach works for CNC machines, assembly lines, bottling equipment, or any production asset.
Packaging Line — 8-Hour Shift
Shift Length480 min
Scheduled Breaks40 min (2 x 20)
Planned Production Time440 min
Unplanned Downtime60 min
Ideal Cycle Time2 sec / carton
Total Cartons Produced10,408
Defective Cartons500
Availability(440 - 60) / 44086.4%
Performance(2 x 10,408) / (380 x 60)91.3%
Quality(10,408 - 500) / 10,40895.2%
OEE Score
75.1%
24.9% of capacity lost — Availability is the weakest link. Targeting breakdowns would yield the biggest OEE gain.
Still calculating OEE on spreadsheets at the end of every shift? Schedule a free demo to see how Oxmaint automates OEE data collection, flags downtime causes instantly, and shows real-time scores for every production line.
Six Big Losses in OEE: Identify What Is Killing Your Plant Output
OEE organizes all production losses into six categories — two for each factor. Identifying which losses dominate your operation is the first step toward eliminating them. Research shows that small stops and reduced speed alone account for 40-50% of total production losses, yet they go completely unnoticed with manual tracking.
Availability Losses
1
Equipment Breakdowns
Unplanned stops from equipment failure — the most visible and costly OEE loss. Sign up for Oxmaint to automate preventive maintenance scheduling and cut breakdowns dramatically.
2
Setup and Changeovers
Planned stops for product changes, tooling adjustments, and cleaning. SMED techniques can reduce changeover time by 20-50%.
Performance Losses
3
Small Stops and Idling
Brief interruptions under 5 minutes — jams, misfeeds, sensor blocks. Often the single largest hidden loss, responsible for 20-30% of total OEE losses.
4
Reduced Speed
Equipment running below designed maximum due to wear, material variability, or conservative settings. AI optimization restores ideal speed parameters.
Quality Losses
5
Startup Rejects
Defective parts during warmup or after changeovers. Standardized startup procedures reduce these losses by 50-80%.
6
Production Defects
Defects during stable production from process drift or tool wear. AI-powered vision systems enable 100% in-line inspection at full speed.
OEE Benchmarks 2025: World-Class Scores by Manufacturing Sector
OEE targets depend heavily on your industry, equipment type, and process complexity. Comparing against generic targets leads to unrealistic goals. These benchmarks, drawn from studies covering 3,500+ manufacturing operations, help you set goals that reflect your sector's real constraints.
Industry OEE Benchmarks
Industry Sector
Average OEE
Top Quartile
Biggest Loss Driver
Automotive
75%
85%+
Changeovers and tooling adjustments
Electronics
80-83%
88%+
Micro-stops and component feeding
Food & Beverage
55-65%
80%+
Cleaning, sanitation, and format changes
Pharmaceutical
35-50%
75%+
Validation, batch changes, and compliance
Metals & Steel
65-75%
85%+
Equipment intensity and thermal cycles
Packaging Lines
55-65%
80%+
Jams, misfeeds, and format changeovers
Data sourced from industry OEE benchmarking reports (2024-2025). Your improvement trend month over month matters more than absolute numbers.
Find Out Where Your Plant Stands — In Minutes, Not Months
Oxmaint captures machine performance, downtime events, and production data in real time — so your team focuses on fixing problems instead of crunching numbers. See how your plant compares against world-class benchmarks with automated OEE dashboards.
Improve OEE With AI-Powered CMMS: Predictive Maintenance and Real-Time Tracking
Traditional OEE tracking relies on operators filling out paper logs or typing into spreadsheets after each shift — data that arrives too late to prevent tomorrow's losses. AI-powered CMMS platforms like Oxmaint transform OEE into a live diagnostic system that detects problems as they happen and triggers corrective action automatically.
Predictive Failure Detection
AI analyzes vibration, temperature, and acoustic patterns to predict equipment failures 2-4 weeks before they happen. Turns unplanned breakdowns into scheduled repairs — boosting Availability by 15-25%.
Live OEE Dashboards
Real-time production data replaces day-old spreadsheets. Operators and managers see current OEE scores, active downtime reasons, and performance trends the moment they happen — not 24 hours later.
Automated Work Orders
When AI detects efficiency degradation, it generates maintenance work orders automatically in the CMMS — complete with failure history, recommended parts, and priority ranking. No manual handoff needed.
Root Cause Intelligence
AI correlates downtime patterns with maintenance history, operator shifts, material batches, and environmental data to reveal the real reasons behind losses — not just symptoms.
Want predictive alerts before your next breakdown costs you a full shift? Sign up for Oxmaint to get AI-powered failure predictions, automated work orders, and real-time OEE dashboards — all in one platform built for manufacturing teams.
How to Improve OEE: 5 Data-Driven Strategies That Reach 85%
Moving from a typical 60% OEE to world-class 85% does not require replacing equipment. It requires systematic identification and elimination of the losses hiding in plain sight. These five strategies are used by top-performing plants across automotive, electronics, and food manufacturing.
01
Automate OEE Data Collection First
Manual logs miss 30-50% of micro-stops and speed losses. Connect PLCs and sensors to a centralized CMMS platform to capture machine states, cycle counts, and downtime reasons automatically. You cannot improve what you cannot measure accurately.
02
Target the Single Biggest Loss Category
Run Pareto analysis on your downtime data to identify the top 3 loss sources. Apply root cause analysis (5 Whys) to each. Most plants find that fixing one recurring breakdown or one slow changeover delivers 5-8% OEE improvement alone.
03
Implement Predictive Maintenance
Shift from calendar-based PM to condition-based maintenance using vibration sensors, thermal imaging, and AI pattern analysis. Plants adopting predictive maintenance reduce equipment breakdowns by up to 70% and cut maintenance costs by 25-30%.
04
Reduce Changeover Time With SMED
Apply Single-Minute Exchange of Dies methodology to separate internal and external setup tasks. Convert internal tasks to external wherever possible. Leading manufacturers achieve 20-50% changeover reduction within the first implementation cycle.
05
Build Daily OEE Review Into Operations
Create operator dashboards with real-time production targets. Hold daily 15-minute OEE standup meetings where data — not opinions — drives decisions. Sign up for Oxmaint to give every shift supervisor live OEE visibility across the entire plant.
OEE is not a report card — it is a diagnostic tool. When you break it into Availability, Performance, and Quality, you get a precise prescription for where to focus improvement. The plants that track OEE in real time consistently outperform those relying on end-of-shift spreadsheets.
— Manufacturing Operations Director
Turn OEE Data Into Production Gains — Starting Today
Your spreadsheets cannot detect a machine running 15% below optimal speed or predict which bearing will fail next Tuesday. Oxmaint automates OEE calculation across every asset, identifies root causes of your biggest losses, and generates maintenance work orders before breakdowns happen — transforming OEE from a monthly report into a daily competitive advantage.
What is a good OEE score for my manufacturing plant?
An OEE score of 85% is widely considered world-class for discrete manufacturing. Continuous process industries often target 90% or higher. Most plants average between 55-65%. The most important measure is your improvement trend month over month — not the absolute number. Sign up for Oxmaint to start benchmarking OEE across all your machines.
How do I calculate OEE for a multi-machine production line?
Calculate OEE at the bottleneck or constraint operation, since the entire line's output is limited by its slowest station. Measure Availability, Performance, and Quality at that station, then multiply all three. For a comprehensive view, track OEE for each individual machine to see which equipment drags down overall line performance.
What are the Six Big Losses in OEE?
Equipment Breakdowns and Setup/Adjustments reduce Availability. Idling/Small Stops and Reduced Speed reduce Performance. Startup Rejects and Production Defects reduce Quality. Together these six categories capture every type of production loss. Book a demo to see how Oxmaint tracks all six automatically.
Can OEE exceed 100%?
No. If your calculation returns above 100%, your Ideal Cycle Time is set incorrectly — it is too high. Ideal Cycle Time should represent the absolute fastest time your process can achieve under optimal conditions. Review your baseline and adjust to reflect true maximum capability.
How quickly will I see ROI from automated OEE tracking?
Most plants identify significant savings within 30 days of deployment. Quick wins from eliminating unlogged micro-stops and addressing top downtime causes often pay for the system within 6-9 months. Returns compound as AI models learn your operation's unique patterns. Schedule a consultation to discuss expected ROI for your specific facility.