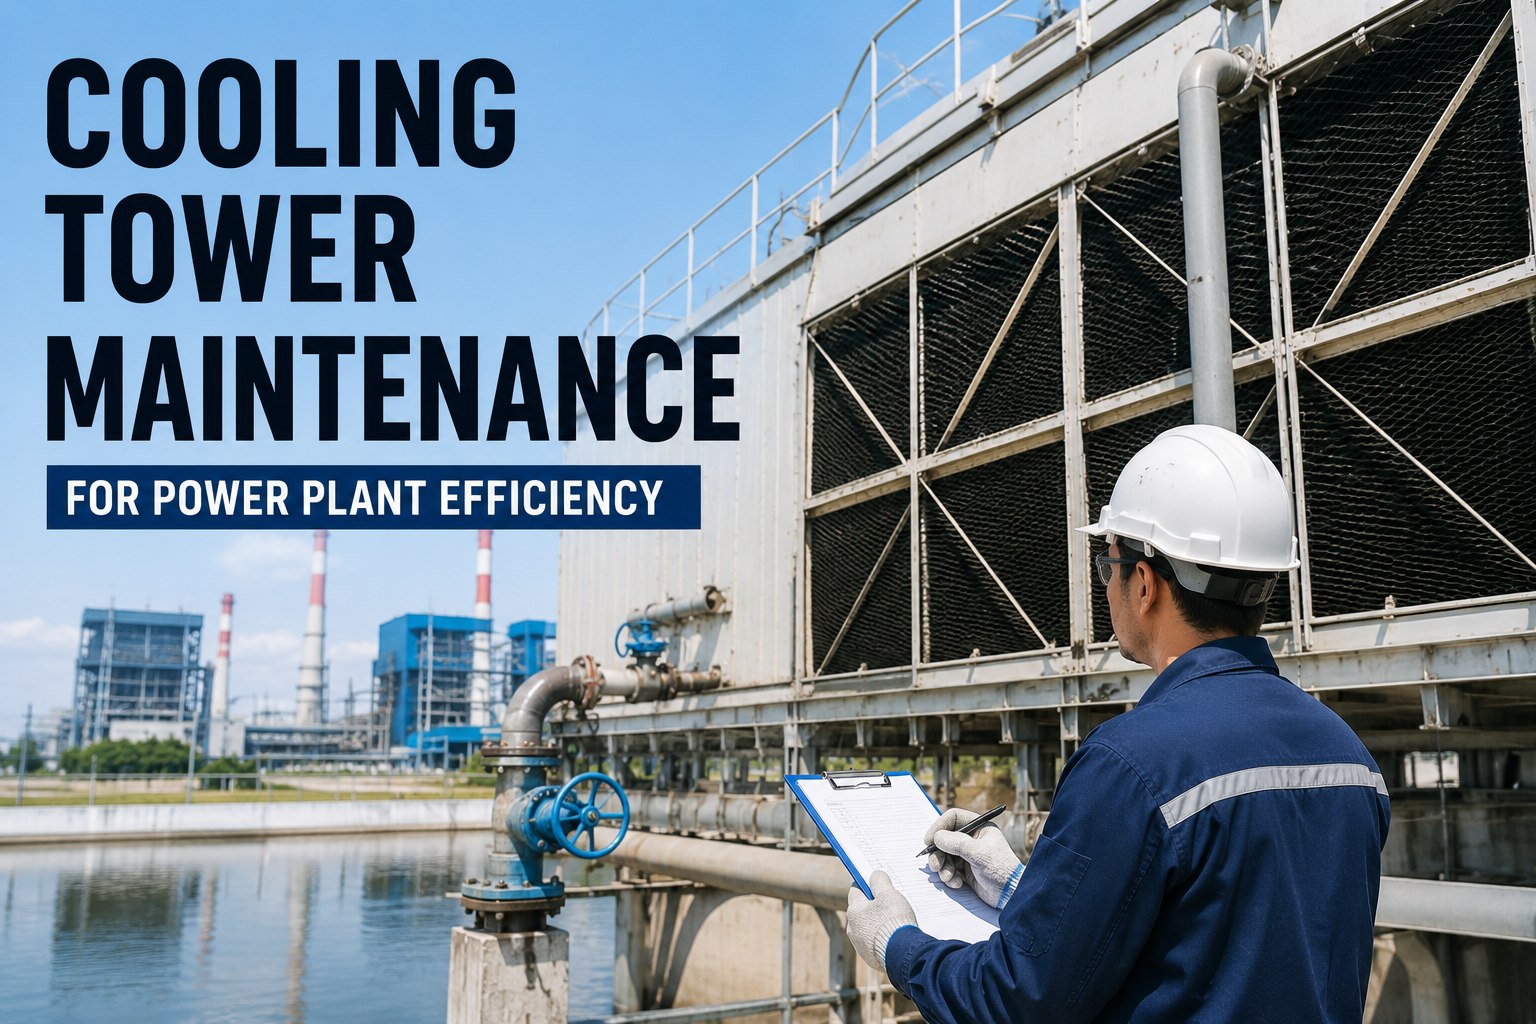
Cooling towers are the silent tax collectors of a power plant — every degree of approach lost to fouling, scale or biological growth shows up directly in heat rate, condenser backpressure and megawatt output. A 1% drop in thermal efficiency on a 500 MW unit can quietly burn through six figures of additional fuel per year, yet maintenance teams rarely connect a green-tinted basin or a drift eliminator gap to the monthly heat-rate report. The discipline that prevents this loss is not exotic: it is scheduled cleaning, water-chemistry control, condition monitoring and a CMMS that forces the work order to close on time. OxMaint brings those pieces together — and you can Start Free Trial to see the workflow on your own asset register before the next outage.
Is fouling quietly stealing a full point of your heat rate?
Biological growth, mineral scale and suspended-solids deposition erode condenser vacuum and approach temperature long before they show up in the daily dispatch report. A CMMS-driven cooling tower program protects thermal performance — and the megawatts you sell at peak.
Where efficiency leaks out of a cooling tower
Four degradation mechanisms account for the majority of avoidable heat-rate loss in recirculating cooling systems. Each one progresses slowly enough that operators normalize the drift — until the next condenser tube opening reveals the damage.
Microbial & biofilm fouling
A biofilm layer just 0.5 mm thick cuts heat-transfer coefficient by 25–30%. Legionella risk, MIC corrosion and reduced fill effectiveness all trace back to inconsistent biocide dosing and poorly tracked halogen residuals.
Mineral scale deposition
Calcium carbonate and phosphate scale form when cycles of concentration drift past the Langelier ceiling. Even a 0.8 mm scale layer on condenser tubes raises turbine backpressure and can push heat rate up by 1–2%.
Suspended-solids accumulation
Silt, dust and airborne debris collect in the cold-water basin and plug fill nozzles. A 15% reduction in circulating flow drops the log-mean temperature difference and starves the condenser of cooling duty.
Mechanical drift & fill degradation
Drift eliminator warping, gearbox wear and broken fan blades let water and solids escape the plume. Untracked vibration trends on fan cells typically precede a 3–5 day unplanned derate during peak summer dispatch.
The math behind a fouled condenser
Use this formula to size the stakes before you build the maintenance case. The numbers below reflect a real 500 MW subcritical coal unit with a 12-cell mechanical-draft tower and a once-cleaned condenser surface of 28,000 m².
Where U is the overall heat-transfer coefficient. A 25% drop in U from a 0.5 mm biofilm layer translates to roughly a 1.8% heat-rate increase — about 180 Btu/kWh on a 10,000 Btu/kWh baseline.
At 500 MW, 7,800 operating hours, 180 Btu/kWh penalty and $3.10/MMBtu fuel: ≈ $2.18M per year. Recovering half of that through disciplined tower maintenance funds the entire CMMS program many times over.
| Fouling scenario | U reduction | Backpressure rise | Heat-rate penalty | Est. annual fuel cost (500 MW) |
|---|---|---|---|---|
| Clean baseline | — | 1.5 inHg | 0 Btu/kWh | $0 |
| Light biofilm (0.2 mm) | 10% | +0.3 inHg | ~70 Btu/kWh | ~$847K |
| Moderate biofilm + silt (0.5 mm) | 25% | +0.8 inHg | ~180 Btu/kWh | ~$2.18M |
| Heavy scale + biomass (1.2 mm) | 45% | +1.6 inHg | ~320 Btu/kWh | ~$3.87M |
A CMMS-driven cooling tower schedule
Condition-based triggers should always override a calendar, but the rhythm below gives chemistry and maintenance teams a defensible baseline. OxMaint auto-generates the work orders and captures the as-found data each time a task closes.
Chemistry & biocide audit
Log halogen residual (0.2–0.5 ppm free), conductivity cycles, pH (7.5–8.5) and turbidity. Confirm biocide dosing pump run-times against the weekly setpoint and flag any three-point drift.
Fill & drift eliminator inspection
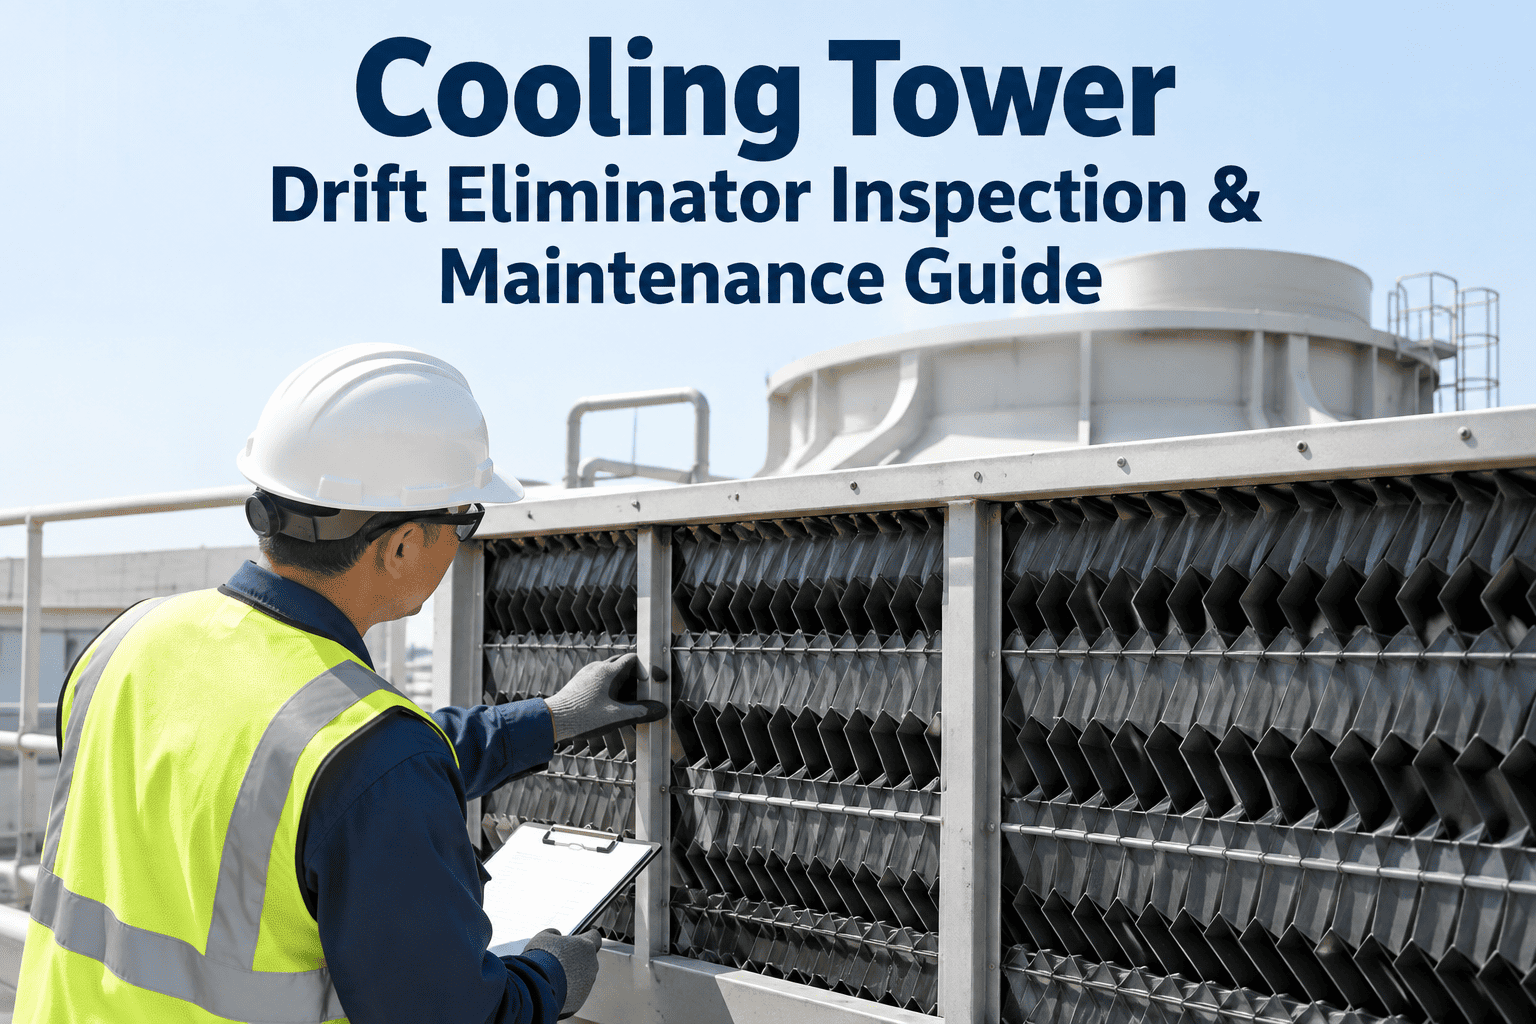
Walk every cell with a thermal camera; document fill fouling, drift-eliminator gaps and distribution-deck flow uniformity. Photograph and geotag defects into the CMMS asset record.
Basin cleaning & gearbox service
Vacuum the cold-water basin to bare concrete, inspect sacrificial anodes, sample gearbox oil for water and metals, and trend vibration on every fan motor and gearbox shaft.
Full cell outage & condenser half-side clean
Mechanically clean fill, replace degraded splash bars, hydro-lance condenser tubes, calibrate flow meters and re-baseline heat-transfer coefficient for the next 12 months of trending.
The inspection checklist chemistry and ops actually use
This is the field version — 18 line items split across three roles. OxMaint surfaces each item as a mobile work order with pass/fail fields, photo capture and automatic escalation when a reading falls outside spec.
Operations walk-down
- Verify each fan cell amperage within ±5% of baseline
- Inspect drift eliminators for gaps, warping or biofilm
- Confirm make-up valve cycling and basin level stability
- Listen for gearbox whine, bearing knock or belt slap
- Record approach temperature per cell against design
- Photograph any plume discoloration or carryover
Chemistry monitoring
- Free halogen residual 0.2–0.5 ppm, logged hourly
- Conductivity vs. make-up — confirm cycles of concentration
- pH band 7.5–8.5; flag any excursion in real time
- Orthophosphate and zinc residuals for corrosion inhibitor
- Dip-slide / ATP test for total bacteria count weekly
- Legionella sample quarterly per ASHRAE 188 protocol
Mechanical & reliability
- Trend fan motor vibration (velocity < 0.12 in/s peak)
- Gearbox oil sample — water < 200 ppm, ISO cleanliness 16/14
- Inspect coupling alignment and torque-limiting device
- Verify fan tip clearance and blade pitch consistency
- Check fill water distribution for uniform wetting pattern
- Calibrate flow, temperature and level instruments
What disciplined maintenance looks like on the ledger
A 1,200 MW combined-cycle plant in the U.S. Southeast moved its cooling tower program onto OxMaint after two consecutive summers of capacity derates. The numbers below are from the first 14 months on the platform.
"Before OxMaint we knew the towers were dirty — we just didn't know which cell, which chemistry parameter, or which week we'd lost the heat rate. Now the work order tells us before the condenser does."
Stop paying for fouling you can prevent
Stand up a CMMS-driven cooling tower program in days, not quarters — and recover the heat-rate points you've been writing off.
Cooling tower maintenance, answered
How often should a power plant cooling tower be inspected?
A full cell-by-cell visual inspection should happen quarterly, with a chemistry walk-down weekly and a basin cleaning every six months. The annual outage is the moment to re-baseline heat-transfer coefficient and clean condenser tubes. OxMaint can auto-schedule each of these frequencies per asset and escalate any missed task — you can Start Free Trial and import your asset list today.
What is the acceptable range for cycles of concentration?
For most recirculating systems treating moderate-hardness make-up, 4 to 8 cycles is typical. The ceiling is set by the Langelier Saturation Index and your specific inhibitor chemistry — pushing past it trades water savings for scale risk that costs far more in heat-rate loss than the water saved.
How much does cooling tower fouling actually cost a power plant?
On a 500 MW unit, a moderate biofilm-plus-silt condition (0.5 mm) typically adds 150–200 Btu/kWh to heat rate, which equates to $1.8M–$2.5M per year in added fuel at current gas or coal prices. Heavy scaling can push that figure past $3.5M and trigger capacity derates during peak-margin periods.
What kills Legionella risk in a cooling tower?
Maintaining a continuous free-halogen residual of 0.2–0.5 ppm, combined with periodic shock dosing and quarterly Legionella sampling per ASHRAE 188, is the industry-standard control. Documenting every dose and sample in the CMMS is what turns a chemistry protocol into a defensible compliance record during an audit.
Can OxMaint connect to our existing SCADA and water-treatment vendor data?
Yes — OxMaint ingests manual readings, vendor reports and SCADA tags into a single asset history, then triggers work orders when a parameter drifts. To map your specific integration points, Book a Demo and we will walk through your tower, chemistry and historian stack.
Protect your heat rate, one work order at a time
Build the cooling tower program that keeps condenser vacuum tight, chemistry in spec and megawatts on the grid — all from one CMMS.
Free 14-day trial · No credit card