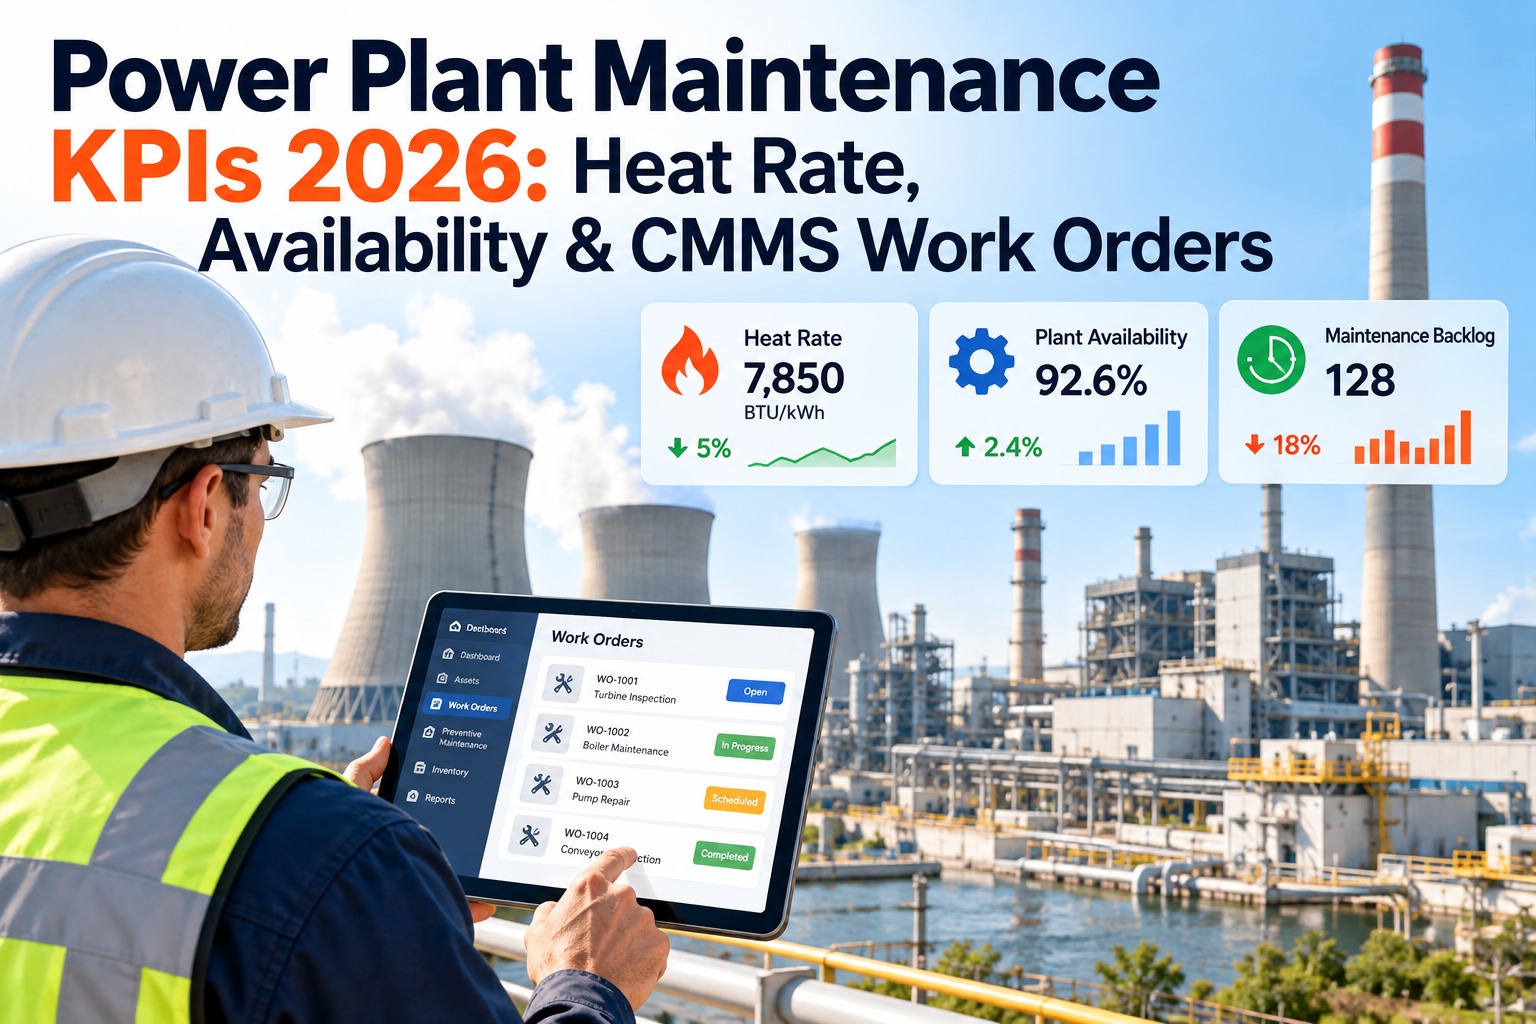
A power plant lives or dies on two numbers: how much of the time it can run, and how efficiently it burns fuel while running. Availability and heat rate are the headline KPIs every plant manager reports up — but they're outcomes, not levers. You can't pull "availability" directly; you improve it by closing the maintenance gaps underneath it. The plants that hit world-class numbers treat every KPI shortfall as a work order waiting to be written. This guide defines the maintenance KPIs that matter in 2026 with real benchmark bands, and shows how OXMAINT AI turns a red metric into a prioritized fix. See it on your plant with a live demo.
Power Plant Maintenance KPIs 2026: Heat Rate, Availability & CMMS Work Orders
Availability and heat rate are outcomes — you move them by closing the maintenance gaps beneath them. OXMAINT AI calculates every reliability KPI from your work-order data and turns a red metric into a prioritized, assigned work order, so the number improves because the work got done.
The KPI Scorecard — With Real Benchmark Bands
A KPI without a benchmark is just a number. These are the maintenance and reliability metrics that define a power plant's performance in 2026, each with the band that separates world-class from firefighting. This is the scorecard OXMAINT AI builds from your work-order data. Start free and build your KPI scorecard in OXMAINT.
| KPI | What it measures | World-class | Needs attention |
|---|---|---|---|
| EAF — Equivalent Availability | Time available at full capacity | >94% | <82% |
| EFOR — Forced Outage Rate | Unplanned unavailability / derate | <2% | >10% |
| MTBF — Mean Time Between Failures | Reliability between breakdowns | ≥2,000 hr | <800 hr |
| MTTR — Mean Time To Repair | Speed of recovery per failure | 4–6 hr | >18 hr |
| PM Compliance (PMP) | Planned vs. total maintenance | ≥90% | <70% |
| Schedule Compliance | On-time work orders completed | ≥90% | <70% |
| Backlog Age | Average age of open work orders | <15 days | >60 days |
| Maint. Cost / Operating Hour | Cost efficiency of upkeep | Downward trend | Rising trend |
EAF and EFOR follow NERC GADS-style definitions (available and derated hours over the period). Reliable KPIs need three timestamps on every work order — reported, started, completed — which is exactly what a CMMS enforces.
Availability: The Outcome You Can't Pull Directly
Equivalent Availability Factor is the number the plant is judged on — but it's the sum of four things you can control. Availability rises when failures get rarer, repairs get faster, planned work goes up, and the backlog comes down. Chase those four and EAF follows. Book a demo to see availability broken into its drivers.
Heat Rate: Every Btu You Waste Is Margin Gone
Heat rate — the Btu of fuel burned per kWh generated — is the plant's efficiency KPI, and lower is better. It creeps upward silently as equipment degrades: fouled condensers, worn seals, off-tune combustion, failing feedwater heaters. Each of those is a maintenance item, which means heat-rate recovery is a maintenance program, not a mystery. Sign up free and tie heat-rate drivers to work orders.
Lower heat rate is better: it means more electricity from the same fuel. Because every driver above is a repairable maintenance item, trending heat rate against completed work orders turns "efficiency is slipping" into a specific, fixable list.
A Red KPI on a Dashboard Doesn't Fix Anything.
Every plant has a dashboard. What separates the world-class ones is what happens after a metric turns red — whether "EFOR is climbing" becomes a ranked, assigned work order or just a slide in next month's review. OXMAINT AI calculates the KPIs from your work-order timestamps and routes the gap straight into the maintenance queue, prioritized by impact. The number moves because the work got scheduled.
Backlog: The KPI That Predicts the Others
Maintenance backlog is the leading indicator hiding in plain sight. A backlog that's growing and aging is tomorrow's forced outage and next quarter's availability miss. But raw backlog size means nothing — what matters is whether it's prioritized by risk, and whether it's trending up or down. Here's how to read it. Book a demo to see backlog ranked by impact.
From KPI Gap to Prioritized Work Order
The whole point of a KPI program is the action it triggers. This is the loop from a metric slipping out of band to a fix that moves it back — the pipeline OXMAINT AI runs so the dashboard and the work queue are the same system. Start free and close the loop on your own KPIs.
Where OXMAINT AI Fits: The Dashboard That Acts
Most plants can show you a KPI. The gap is between the metric and the maintenance that moves it. OXMAINT AI is the CMMS/EAM layer that calculates the reliability KPIs from real work-order data and turns every gap into a prioritized job — so the scorecard and the schedule are one system. Here's what your team gets. Sign up free and get your plant's KPIs live.
Our monthly reliability report was beautiful and useless — a wall of red and green that told us what happened but never what to do about it. The forced-outage rate would tick up, everyone would nod, and nothing changed until the next trip. Since we moved onto OXMAINT, a KPI slipping out of band creates the work order itself, ranked against everything else in the queue. PM compliance crossed 85% within two months, and MTBF started climbing behind it — exactly the order you'd want.
Frequently Asked Questions
Make Every Red Metric a Work Order.
Know the benchmark bands, then close the gaps beneath them. OXMAINT AI calculates your reliability KPIs from real work-order data and turns each shortfall into a prioritized fix — so availability and heat rate improve because the work got done. Start free — no credit card, unlimited users.