Steel manufacturing is one of the most emissions-intensive industries on earth — responsible for approximately 7% of global CO₂ emissions and generating particulate matter, SO₂, NOₓ, VOCs, heavy metals, and hazardous air pollutants across every stage from raw material handling to finished product. In the United States, EPA regulations under the Clean Air Act (40 CFR Part 63, Subpart EEEEE for integrated iron and steel; Subpart YYYYY for EAF steelmaking), RCRA hazardous waste requirements, and state-level air quality permits create a compliance burden that grows more complex every year. The facilities attempting to meet these mandates with manual stack testing, spreadsheet-based emissions calculations, and reactive pollution control equipment maintenance are spending 2–3× what they should — and still accumulating violations. This guide maps the IoT sensor architecture, AI-driven compliance automation, and CMMS integration strategy for environmental managers and plant directors responsible for emissions compliance in steel production. Book a technical walkthrough to see how Oxmaint's AI-driven work order management integrates with continuous emissions monitoring.
Technical Guide / Steel Plant Environmental Compliance
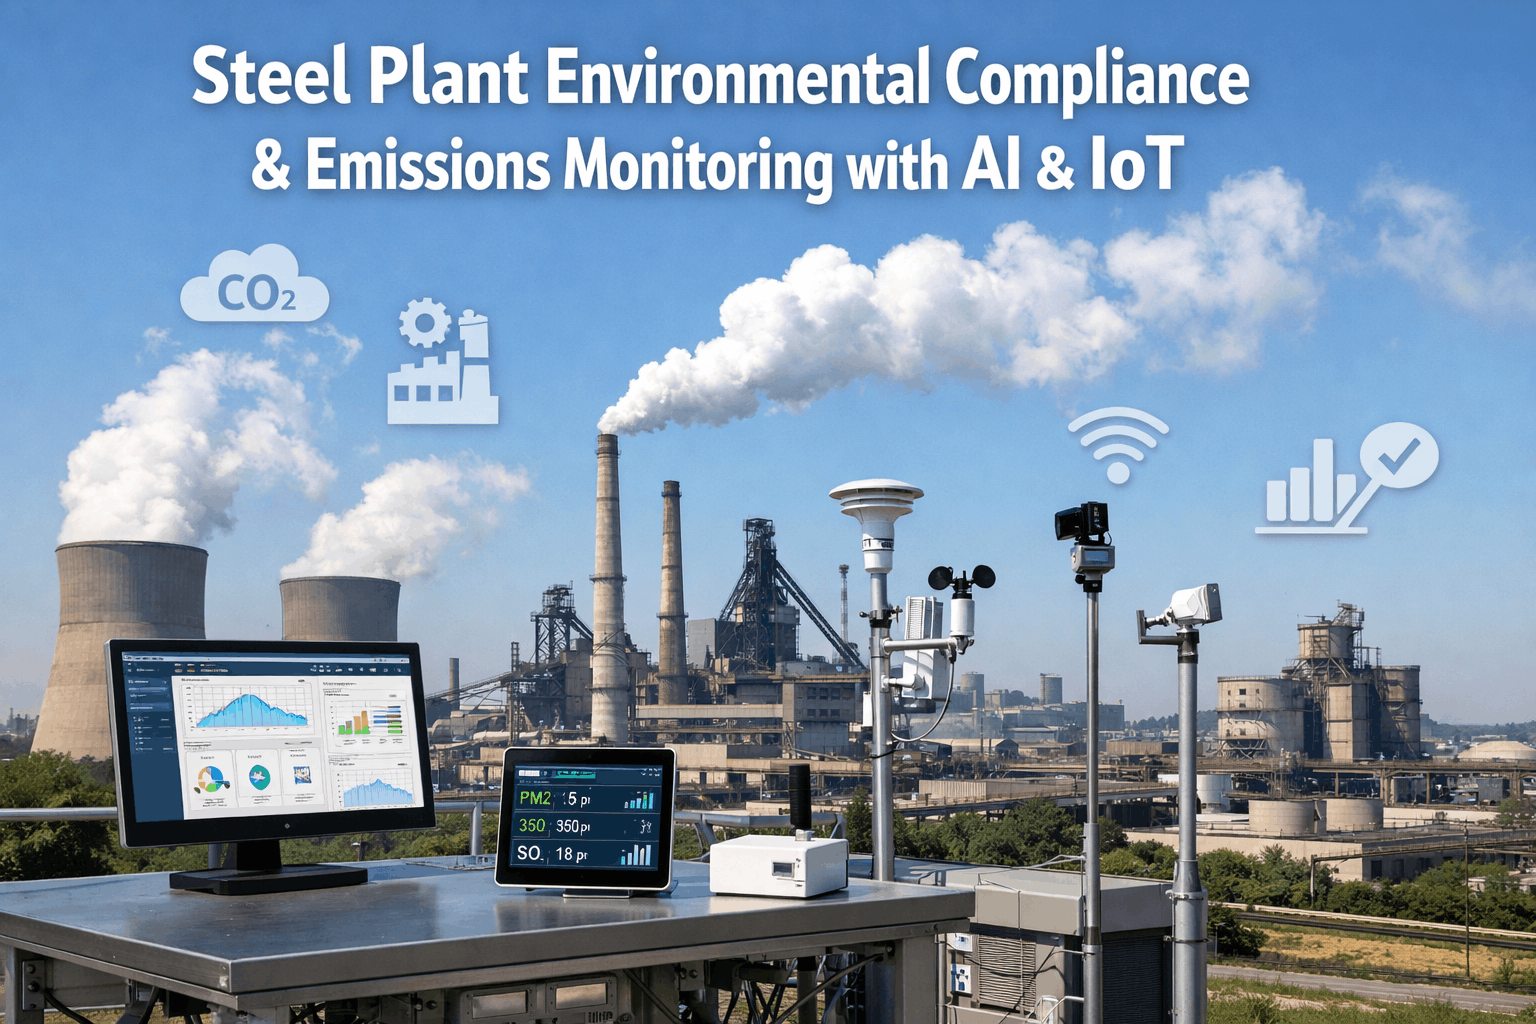
Steel Plant Emissions Monitoring & Compliance with AI & IoT
IoT continuous monitoring, AI-automated reporting, and CMMS-linked pollution control maintenance for EPA, state, and carbon compliance.
71%Less Compliance Labor
18%Actual Emissions Reduction
ZeroLate Reporting Penalties
$2.40/tCompliance Cost vs. $6.20
Why Steel Plants Are Failing Environmental Compliance
Environmental compliance in steelmaking is not a single regulation — it is a layered matrix of federal, state, and local requirements that intersect across air quality, water discharge, waste management, and carbon reporting. Most steel plants manage this complexity with the same tools they used a decade ago: manual data collection, spreadsheet calculations, and reactive maintenance on pollution control equipment. Here are the six systemic failures that IoT and AI resolve.
Regulation: 40 CFR Part 60/63 — Continuous Emissions Monitoring
Traditional CEMS require quarterly calibration gas audits, annual relative accuracy test audits (RATA), and daily calibration drift checks — all manually documented. Data gaps from analyzer downtime, failed calibrations, or missed QA procedures create compliance exposure that EPA treats as presumed violations.
IoT Fix: Automated calibration verification, real-time data validation, and gap-filling algorithms that meet EPA Method 19 substitution requirements
Regulation: NESHAP Subpart YYYYY — Particulate Emissions Limits
EAF baghouses operating with degraded bags, failed cleaning pulses, or bypassed compartments exceed particulate limits between stack tests — but nobody knows until the next manual test reveals the exceedance. Each documented violation triggers a 30-day corrective action and potential enforcement.
IoT Fix: Differential pressure, opacity, and triboelectric sensors detect bag failures within hours — CMMS auto-generates replacement work orders
Regulation: Title V Permit — Annual Emissions Inventory Reporting
Emissions inventories calculated manually from production data, emission factors, and AP-42 tables are error-prone and audit-fragile. A single transposed number in a spreadsheet can misstate facility-wide emissions by 15–30% — triggering either undeserved penalties or unreported excess emissions.
IoT Fix: AI calculates emissions from real-time production and monitoring data using regulatory-approved methodologies — no manual entry
Regulation: RCRA — Hazardous Waste Management (40 CFR 260-270)
EAF dust (K061), spent pickle liquor, slag processing waste, and used oil require cradle-to-grave documentation. Paper manifests, disconnected vendor records, and manual accumulation time tracking create gaps that RCRA inspectors identify within hours of arriving on site.
IoT Fix: Digital waste manifesting with CMMS-integrated accumulation tracking, vendor verification, and audit-ready disposal documentation
Regulation: EPA GHG Reporting Rule (40 CFR Part 98, Subpart Q) + Emerging SEC Climate Disclosure
Steel plants reporting under Subpart Q must calculate CO₂ from process emissions (carbon in charge materials), combustion emissions (natural gas, electrodes), and purchased electricity. Most facilities rely on annual engineering estimates rather than continuous tracking — creating audit risk as reporting scrutiny intensifies.
IoT Fix: Real-time carbon intensity per heat from actual charge weights, energy consumption, and emission factors — continuous GHG accounting
Regulation: Title V Operating Permit — Operational Limitations & Monitoring Requirements
Title V permits contain dozens of operational limits — production caps, fuel usage limits, hours of operation restrictions, and control device operating parameters. Tracking compliance with every condition simultaneously is impossible with manual systems. Exceedances often go undetected until the semi-annual compliance certification review.
IoT Fix: Real-time permit condition monitoring with automated alerts when any parameter approaches its permit limit
Connect Your Emissions Data to Intelligent Compliance
Oxmaint's AI compliance engine ingests CEMS data, pollution control equipment health telemetry, and production records — auto-generating regulatory reports and predictive maintenance work orders before exceedances become violations.
IoT Architecture for Steel Plant Environmental Compliance
Meeting EPA, state, and emerging carbon requirements demands a monitoring architecture that goes far beyond traditional CEMS. Each layer below addresses a distinct compliance domain — and each creates both regulatory documentation and maintenance intelligence. Sign up to Oxmaint to manage every layer of your environmental compliance stack.
L1
Stack Emissions — CEMS & Parametric Monitoring
Continuous analyzers for CO, SO₂, NOₓ, and opacity on primary stacks. Parametric monitoring (temperature, pressure drop, flow) on secondary sources where CEMS are not required. All data validated in real-time against QA/QC protocols.
Compliance: 40 CFR Part 60/63 CEMS requirements, Excess Emissions Reports, quarterly CEMS audits
L2
Fugitive Emissions — Fence-Line & Area Monitoring
Optical gas imaging (OGI), fence-line PM2.5/PM10 monitors, and ambient VOC detectors track fugitive emissions from material handling, slag processing, and open-air operations that stack monitoring cannot capture.
Compliance: Fugitive emissions provisions in Title V permits, community air quality commitments, Good Neighbor provisions
L3
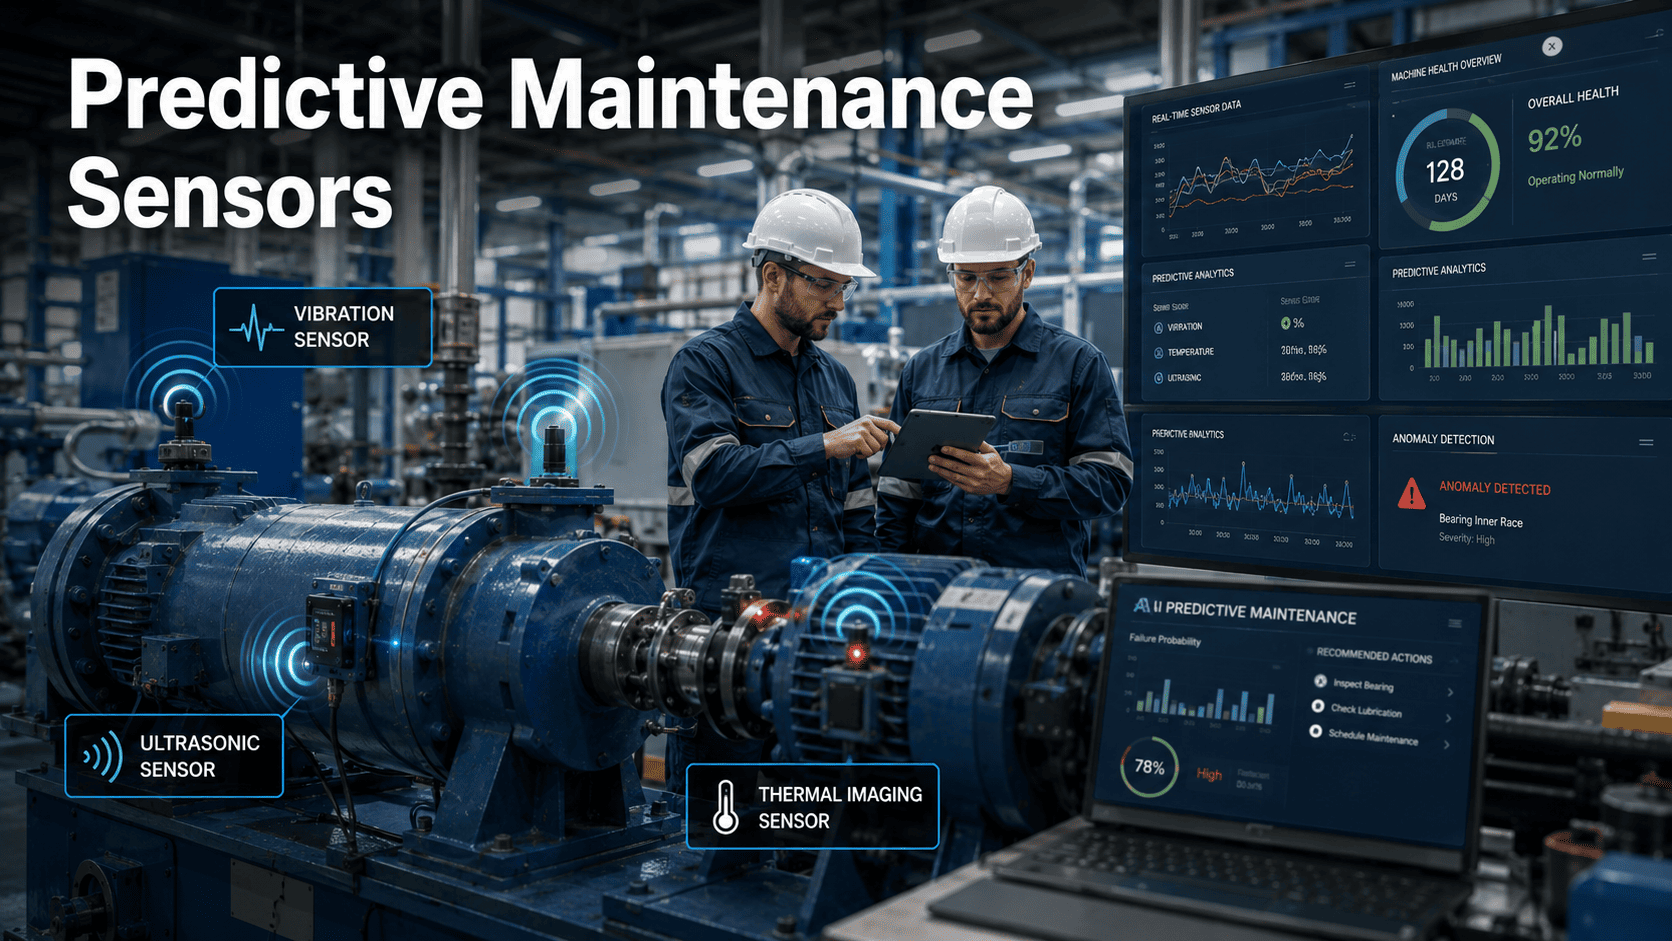
Pollution Control Equipment Health
Differential pressure across baghouse compartments, scrubber liquor pH and flow rates, ESP power consumption and spark rate, and thermal oxidizer temperature — all monitored continuously and linked to CMMS for predictive maintenance.
Compliance: Control device operating parameter monitoring required by NESHAP and state permits
L4
Water Discharge — Effluent & Stormwater
Online pH, TSS, oil-and-grease, temperature, and flow monitoring on process water discharge points. Stormwater sampling automated at outfall locations during qualifying rain events. All data feeds directly into DMR reporting.
Compliance: NPDES permit limits, Discharge Monitoring Reports (DMRs), SWPPP requirements
L5
Waste Management — Generation & Disposal Tracking
Digital waste manifesting, accumulation area start-date tracking, container labeling verification, and disposal vendor documentation — all integrated into CMMS for operator-level visibility and automatic 90-day accumulation limit alerts.
Compliance: RCRA hazardous waste (K061 EAF dust), used oil, universal waste, and state-specific requirements
L6
GHG & Carbon Intensity Tracking
Real-time CO₂ calculation from actual charge material carbon content, natural gas consumption, electrode consumption, and purchased electricity — producing continuous carbon intensity (tCO₂/t steel) rather than annual engineering estimates.
Compliance: EPA GHG Reporting Rule (Subpart Q), emerging SEC climate disclosures, customer carbon footprint requests
L7
Permit Condition Dashboard
Every Title V permit condition — production limits, fuel caps, operating hour restrictions, control device parameters, monitoring requirements, and recordkeeping obligations — tracked in real-time against actual operations with automated alerts at 80% and 95% of limits.
Compliance: Title V semi-annual compliance certifications, deviation reporting, annual compliance certification
L8
AI Reporting & Audit Documentation Engine
Automated generation of quarterly excess emissions reports, semi-annual Title V certifications, annual emissions inventories, GHG reports, DMRs, and hazardous waste biennial reports — all from the same operational data pipeline with full audit trail traceability.
Compliance: All reporting obligations auto-generated, reviewer-approved, and submitted within regulatory deadlines
Where AI & IoT Deliver Measurable Compliance Value
Automated emissions compliance in steel plants is not theoretical — facilities running integrated monitoring-to-reporting deployments are realizing measurable improvements across regulatory risk, cost, and actual environmental performance. These are the six highest-impact use cases validated by steel producers.
Predictive Baghouse Maintenance
IoT differential pressure and triboelectric sensors detect bag failures, cleaning pulse degradation, and compartment bypasses within hours. AI correlates bag age, dust loading, and pressure trends to schedule replacements during planned outages — eliminating the particulate exceedances that occur between stack tests and trigger NESHAP violations.
Automated Regulatory Reporting
AI assembles quarterly excess emissions reports, semi-annual Title V certifications, annual emissions inventories, and EPA GHG reports from continuous monitoring data — pre-formatted to regulatory templates. Report generation drops from 120–200 staff hours per submission to under 8 hours of review and approval.
Real-Time Permit Limit Tracking
Every operational limit in the Title V permit is monitored against live production data. When any parameter reaches 80% of its permit limit — rolling 12-month production tonnage, annual fuel consumption, daily operating hours — the system alerts environmental staff and production planning simultaneously to avoid exceedances through operational adjustment.
Carbon Intensity Optimization
Real-time tCO₂/t steel tracking per heat allows metallurgists to optimize charge mix, energy input, and process parameters for both quality and carbon performance. Customer carbon footprint requests are answered with actual heat-level data rather than plant-average estimates — a competitive advantage as green steel procurement grows.
CEMS Data Validation & Gap Prevention
AI monitors CEMS analyzer health, auto-validates calibration drift checks, flags QA/QC failures before they create compliance gaps, and applies EPA-approved data substitution methods when analyzers are offline for maintenance. CEMS data availability consistently exceeds the 95% threshold that regulators require.
Waste Compliance Automation
Digital waste manifesting with CMMS-integrated 90-day accumulation tracking eliminates the most common RCRA citation: exceeding accumulation time limits on K061 EAF dust and other hazardous waste streams. Container labels, disposal vendor certifications, and land disposal restriction notifications auto-generated and archived.
Turn Emissions Data into Automated Compliance
Oxmaint's AI engine transforms CEMS readings, pollution control equipment health data, and production records into regulatory reports, predictive maintenance work orders, and real-time permit compliance dashboards — eliminating the manual burden that consumes your environmental team.
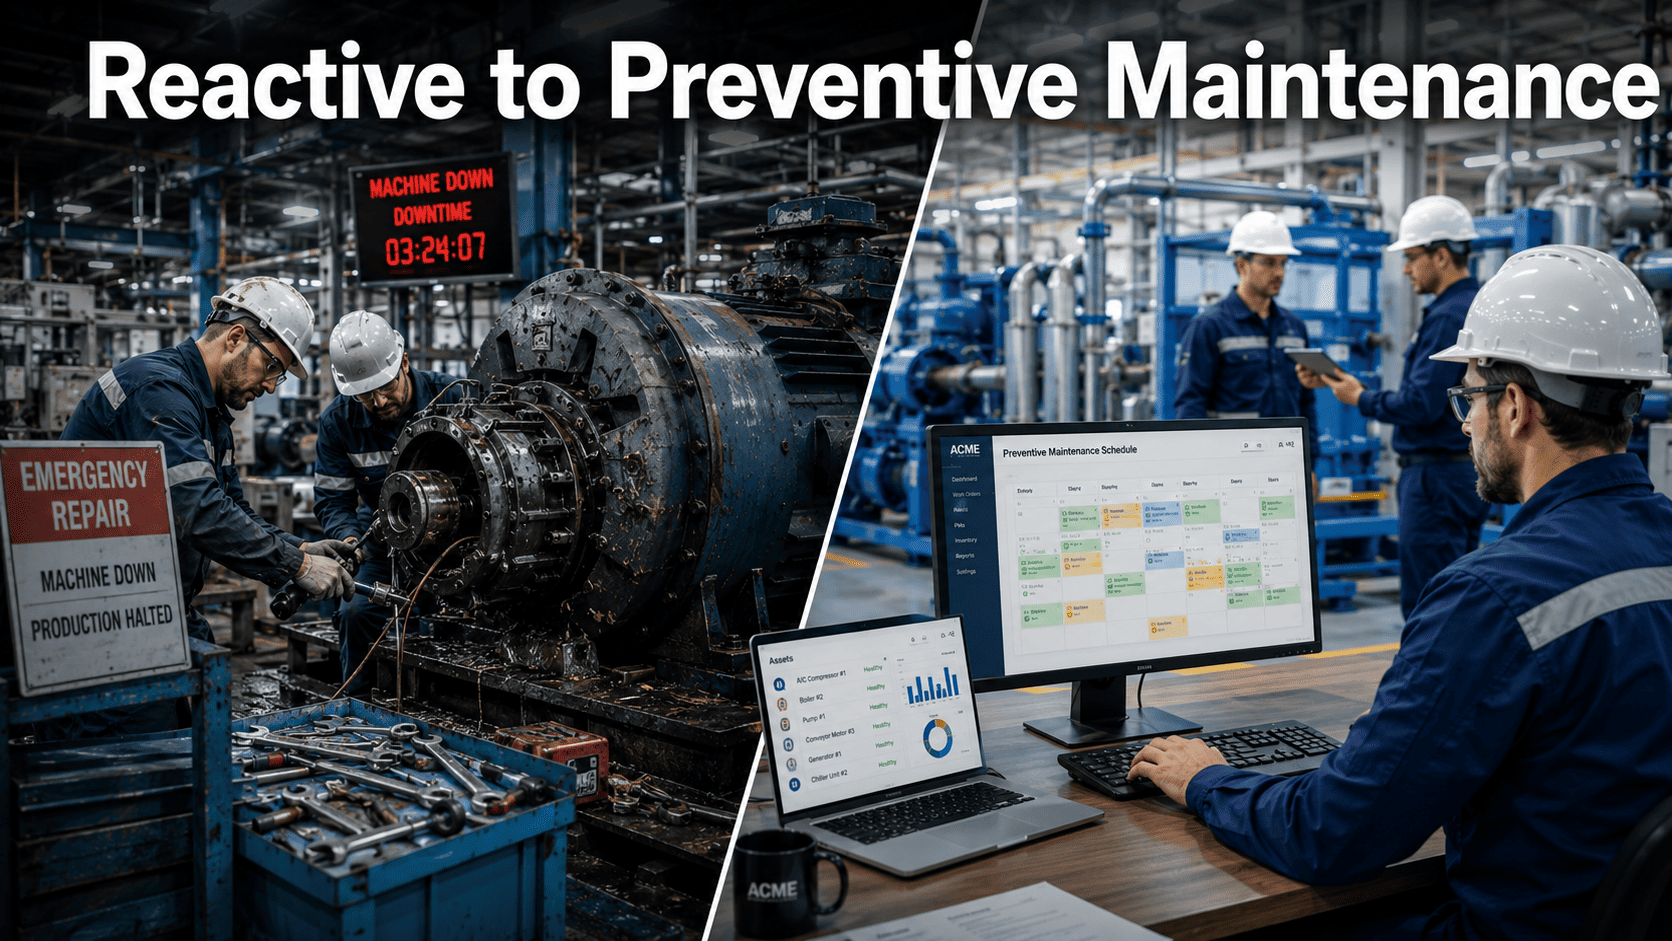
Manual vs. AI-Automated Environmental Compliance
The decision to automate environmental compliance has direct, measurable consequences for regulatory risk, cost, and actual emissions performance. This comparison maps the operational differences that environmental managers and plant directors need to evaluate. Schedule a consultation for a facility-specific assessment.
CEMS data gaps from missed calibrations create presumed violations
Emissions inventory calculated annually from AP-42 factors — 15–30% error margin
Baghouse failures detected only during scheduled stack tests
Title V permit conditions tracked manually in spreadsheets
RCRA waste accumulation time managed by memory and wall calendars
$6.20/ton environmental compliance cost including labor and penalties
CEMS data validated automatically — 95%+ availability maintained continuously
Emissions calculated in real-time from actual production and monitoring data
Bag failures detected within hours via IoT ΔP and triboelectric monitoring
Every permit condition monitored live with 80% and 95% threshold alerts
Digital waste manifesting with automated accumulation limit countdown
$2.40/ton — 61% reduction through automation and prevention
Carbon intensity per heat for green steel customer certifications
Predictive pollution control equipment maintenance via CMMS
Real-time fence-line air quality monitoring for community relations
Automated deviation detection and root cause analysis
Multi-regulation reporting from one data pipeline — enter data once
Audit-ready documentation for EPA, state, and customer inspections
Implementation Roadmap: From Manual to Automated Compliance
Successful environmental compliance automation follows a phased approach that addresses the highest-risk regulatory exposure first and expands as each layer proves its value. Each phase reduces compliance risk while building toward full automation. Sign up to Oxmaint to manage your compliance transition.
Phase 1: CEMS & PCE Integration
6–10 Weeks
Connect existing CEMS data to AI validation. Register all baghouses, scrubbers, and ESPs as tracked CMMS assets with IoT health monitoring
Phase 2: Permit Tracking & Reporting
10–18 Weeks
Map all Title V conditions to real-time monitoring. Automate first regulatory report cycle (quarterly excess emissions, semi-annual certification)
Phase 3: GHG & Waste Automation
5–9 Months
Activate real-time carbon tracking per heat. Deploy digital waste manifesting and RCRA accumulation tracking across all waste streams
Phase 4: Full Compliance Intelligence
10–16 Months
All reports auto-generated, fence-line monitoring live, predictive PCE maintenance autonomous, carbon intensity optimization active
Frequently Asked Questions
Does AI-automated reporting satisfy EPA and state regulatory requirements?
Yes — when the underlying data comes from EPA-approved monitoring methods (40 CFR Part 60 Appendix B reference methods, approved CEMS, and parametric monitoring specified in permits). AI automates the calculation, formatting, and assembly of regulatory reports using the same approved methodologies your environmental engineers currently apply manually. The difference is speed, accuracy, and consistency. Every calculation traces to a monitored data point with a timestamped audit trail. Regulators receive the same report format they expect — generated in hours instead of weeks, with far fewer errors.
Book a demo to see how the automated reporting module maps to your specific permit requirements.
How does predictive maintenance on pollution control equipment reduce actual emissions?
Pollution control equipment degrades continuously between inspections — baghouse bags develop pinholes, scrubber nozzles clog, ESP plates warp, and cleaning systems lose effectiveness. Each degradation event increases actual emissions even if the facility is nominally compliant based on the last stack test. IoT sensors detect these degradation signatures in real-time, and CMMS work orders fix them before emissions increase. The 18% actual emissions reduction documented in the case study came entirely from maintaining pollution control equipment at peak performance — not from production curtailment or capital equipment upgrades.
Sign up free to start tracking your PCE health alongside your compliance data.
What about the EPA GHG Reporting Rule — can AI handle Subpart Q calculations?
Yes. Subpart Q requires calculation of CO₂ from three sources: process emissions (carbon in metallic and non-metallic charge materials that are oxidized during steelmaking), combustion emissions (natural gas, electrode consumption, oxygen lancing), and indirect emissions from purchased electricity. AI performs these calculations continuously using actual charge weights, measured gas flows, and real-time electricity consumption — producing a heat-by-heat carbon intensity record that aggregates into the annual Subpart Q report with full source-level documentation.
What ROI should we expect from compliance automation?
Most steel plants see payback in 12–18 months based on compliance labor reduction (71% in the documented case — equivalent to 2–3 FTEs redirected to emissions reduction projects), penalty avoidance ($25K–$100K+ per avoided violation), reduced consulting fees ($50K–$150K annually in stack testing and reporting consultants), and energy savings from optimized pollution control equipment operation. The Granite City facility documented a total compliance cost reduction from $6.20/ton to $2.40/ton — a 61% improvement. Facilities under consent decrees or enhanced regulatory scrutiny see faster payback because the cost of non-compliance is highest.
Schedule a demo to model ROI for your specific regulatory exposure.
Your Emissions Data Should Work as Hard as Your Melt Shop
Oxmaint gives your environmental team complete visibility into every emission source, every pollution control device, every permit condition, and every waste stream — from AI-driven compliance automation and predictive PCE maintenance to real-time carbon tracking and automated regulatory reporting. Everything lives in one platform built for the regulatory complexity of steel manufacturing.