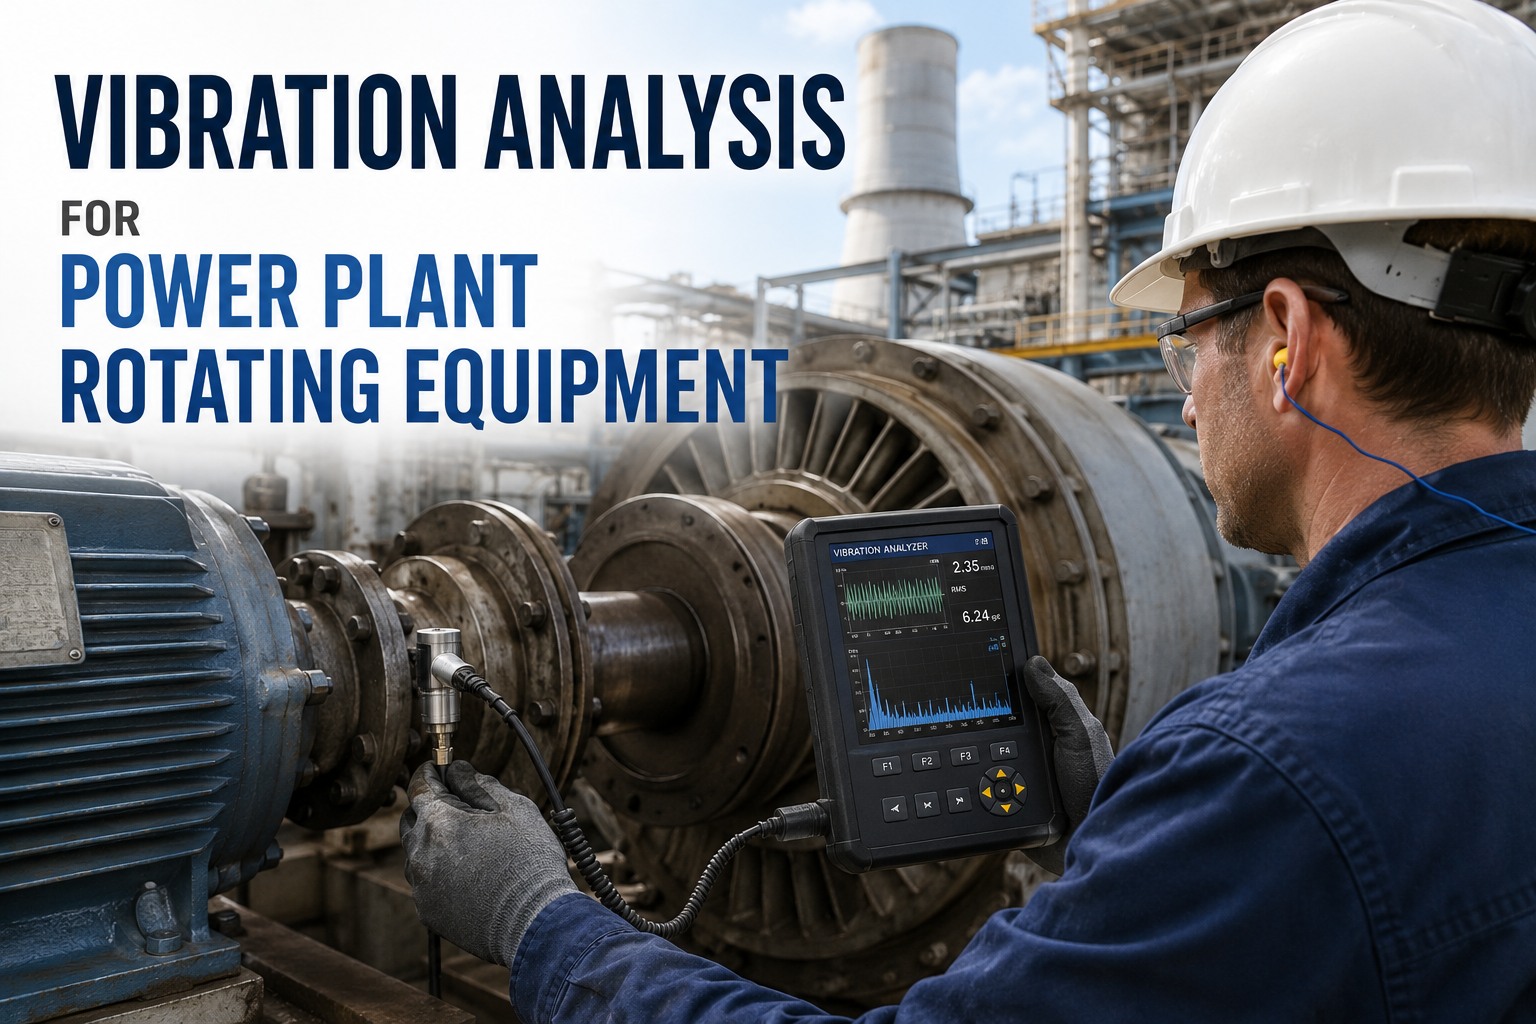
Pumps, fans, compressors and turbines in a power plant never fail silently — they broadcast symptoms through vibration for weeks before a breakdown. Engineers who can read those signals catch bearing wear, misalignment, imbalance and looseness early enough to plan repairs during a planned outage instead of fighting fires during peak generation. This guide breaks down the frequencies, thresholds and workflows that turn raw accelerometer data into actionable work orders, and shows how Start Free Trial of OxMaint closes the loop from measurement to maintenance.
What if every bearing told you it was dying — six weeks before it did?
Vibration analysis on power plant rotating equipment detects 70–90% of mechanical failures in their earliest stage. OxMaint turns that signal into scheduled work orders — no spreadsheets, no missed alarms, no unplanned outages.
Why vibration is the earliest indicator of rotating equipment failure
In a 500 MW combined-cycle plant, a single boiler feed pump can cost $18,000–$45,000 per day of unplanned downtime. Vibration analysis catches the failure cascade at Stage 1 — when remediation costs $400 — instead of Stage 4, when a rebuild exceeds $90,000.
Micro-pitting begins on the inner race. High-frequency envelope detection picks up impact spikes at the bearing pass frequency weeks before overall velocity rises.
Planned repair
Defect spreads to the outer race. Sidebands appear around the fundamental. Velocity amplitude crosses the ISO 10816 alarm-A threshold.
Scheduled swap
Cage frequency and sub-harmonics emerge. 1× and 2× components grow as imbalance and misalignment compound the damage. Temperatures climb.
Forced outage
Bearing disintegrates. Shaft contacts housing, rotor damage spreads to seals and couplings, secondary damage to adjacent equipment is likely.
Full rebuild
The fault-frequency reference every reliability engineer needs
Each mechanical fault produces a characteristic frequency. Knowing which peak to chase is what separates a vibration tech from a diagnostician. Below are the dominant signatures for the four most common rotating-equipment faults in power generation.
From accelerometer to work order — the 5-step workflow
A mature vibration program isn't just data collection — it's a closed loop. Below is the sequence reliability teams follow to convert a raw FFT spectrum into a verified, prioritized, and executed repair.
Technician walks a defined route with a handheld analyzer, taking readings at pre-mapped points on 200–800 assets. Standard cadence: monthly for critical machines, quarterly for auxiliary. Each point captures velocity, acceleration and envelope spectra.
OxMaint compares every reading against ISO 10816-3 zones (A/B/C/D) and your custom thresholds. Assets in Zone C trigger a yellow flag; Zone D triggers automatic work-order generation. Baseline alarms catch step-changes; trend alarms catch gradual drift.
An analyst opens the flagged spectrum, identifies the dominant frequency, matches it to a fault signature (1× = imbalance, 2× = misalignment, BPFI = inner-race defect), and confirms severity with envelope and time-waveform analysis.
The trend curve is extrapolated to the failure threshold. If RUL is under 30 days, the work order is marked "urgent — schedule within 14 days." If under 7 days, the asset moves to critical-status standby for a forced-outage window.
Diagnosis becomes a work order inside OxMaint — parts reserved, labor assigned, outage window booked. Post-repair vibration is captured and compared to baseline to verify the fix. The loop is closed and the trend resets.
ISO 10816 alarm zones — and what each one demands
ISO 10816-3 defines four vibration severity zones for machines rated 15 kW to 300 kW and above. Each zone maps to a specific operational response. The table below shows the standard thresholds for a rigid-mounted machine operating between 600 and 3,600 RPM.
| Zone | Velocity (mm/s RMS) | Condition | Required Action | Typical Lead Time |
|---|---|---|---|---|
| A | 0 – 1.4 | New / acceptable | Routine monitoring on standard route | No action |
| B | 1.4 – 2.8 | Acceptable for long-term | Trend weekly; log baseline shift | 90+ days |
| C | 2.8 – 4.5 | Restricted — short-term only | Diagnose fault, plan repair within 30 days | 14–30 days |
| D | > 4.5 | Unacceptable — danger | Immediate shutdown or next outage, whichever sooner | < 7 days |
Thresholds vary by mounting (rigid vs. flexible), power class and speed. OxMaint lets you override defaults per asset so alarms reflect real-world operating conditions — not just the standard curve.
The math that justifies a vibration program
Consider a mid-size coal-fired plant with 180 rotating assets — BFPs, ID/FD fans, condensate pumps, mill motors and cooling-tower gearboxes. Without vibration monitoring, the plant averages 11 unplanned events per year. With a route-based program tied to a CMMS, that drops to 2.
A boiler feed pump that almost didn't make it to the next outage
During a routine monthly route, our analyst noticed the envelope spectrum on BFP-2 had developed a clear BPFI peak with sidebands — amplitude had tripled in three weeks. The overall velocity was still in ISO Zone B, so the SCADA system saw nothing wrong. We pulled the pump during the scheduled outage four days later. The inner race was spalled across 40% of its circumference. If we'd waited for the next route, the bearing would have seized mid-load and we'd have lost 280 MW for at least 16 hours.
Stop reading vibration in spreadsheets. Start closing work orders.
OxMaint connects every accelerometer reading to a trigger, a trend and a work order — so your reliability team spends time diagnosing, not doing data entry.
Vibration analysis for power plant equipment — answered
For critical assets (BFPs, ID/FD fans, main turbines) collect monthly route readings at minimum, with permanent online monitoring on machines above 500 kW. Auxiliary equipment (condensate pumps, cooling-tower fans) can follow a quarterly route. When a trend crosses into ISO Zone C, increase cadence to weekly until the repair is executed.
Most plants use a hybrid: permanent sensors on the top 10–15% of critical machines where failure means an immediate derate, and route-based handheld collection for the remaining 85%. OxMaint ingests data from both wired and wireless sensors as well as manual route uploads, so you can start with a handheld and scale to online monitoring without changing platforms. You can Book a Demo to see the integration in action.
Velocity (mm/s RMS) is the primary severity metric per ISO 10816 and best detects mid-frequency faults (imbalance, misalignment, looseness) in the 10–1,000 Hz range. Acceleration (g) emphasizes high-frequency bearing impacts. Envelope (demodulated) analysis extracts the impact repetition rate from high-frequency carrier energy, making it the gold standard for early-stage bearing-defect detection before overall velocity rises.
Yes. Configure alarm thresholds per asset — when a reading crosses into Zone C or D, OxMaint auto-generates a work order with the fault type, recommended action, priority level and required parts pre-filled. The work order routes through your normal approval chain. Trend data attaches to the completed order so you can verify the repair reduced vibration back to baseline.
A typical 200-asset plant can be fully onboarded in 3–4 weeks: week one for asset hierarchy and criticality ranking, week two for measurement-point mapping and route design, week three for baseline data collection and threshold configuration, week four for team training and CMMS integration. Start with a Start Free Trial to build your first route and see the workflow end-to-end before committing.
Your rotating equipment is talking. Are you listening?
Join the power plants that cut unplanned downtime by 80% with vibration-driven predictive maintenance. Set up your first route, configure alarm thresholds and close your first diagnostic work order — all in the first week.
Free 14-day trial · No credit card



.png)
