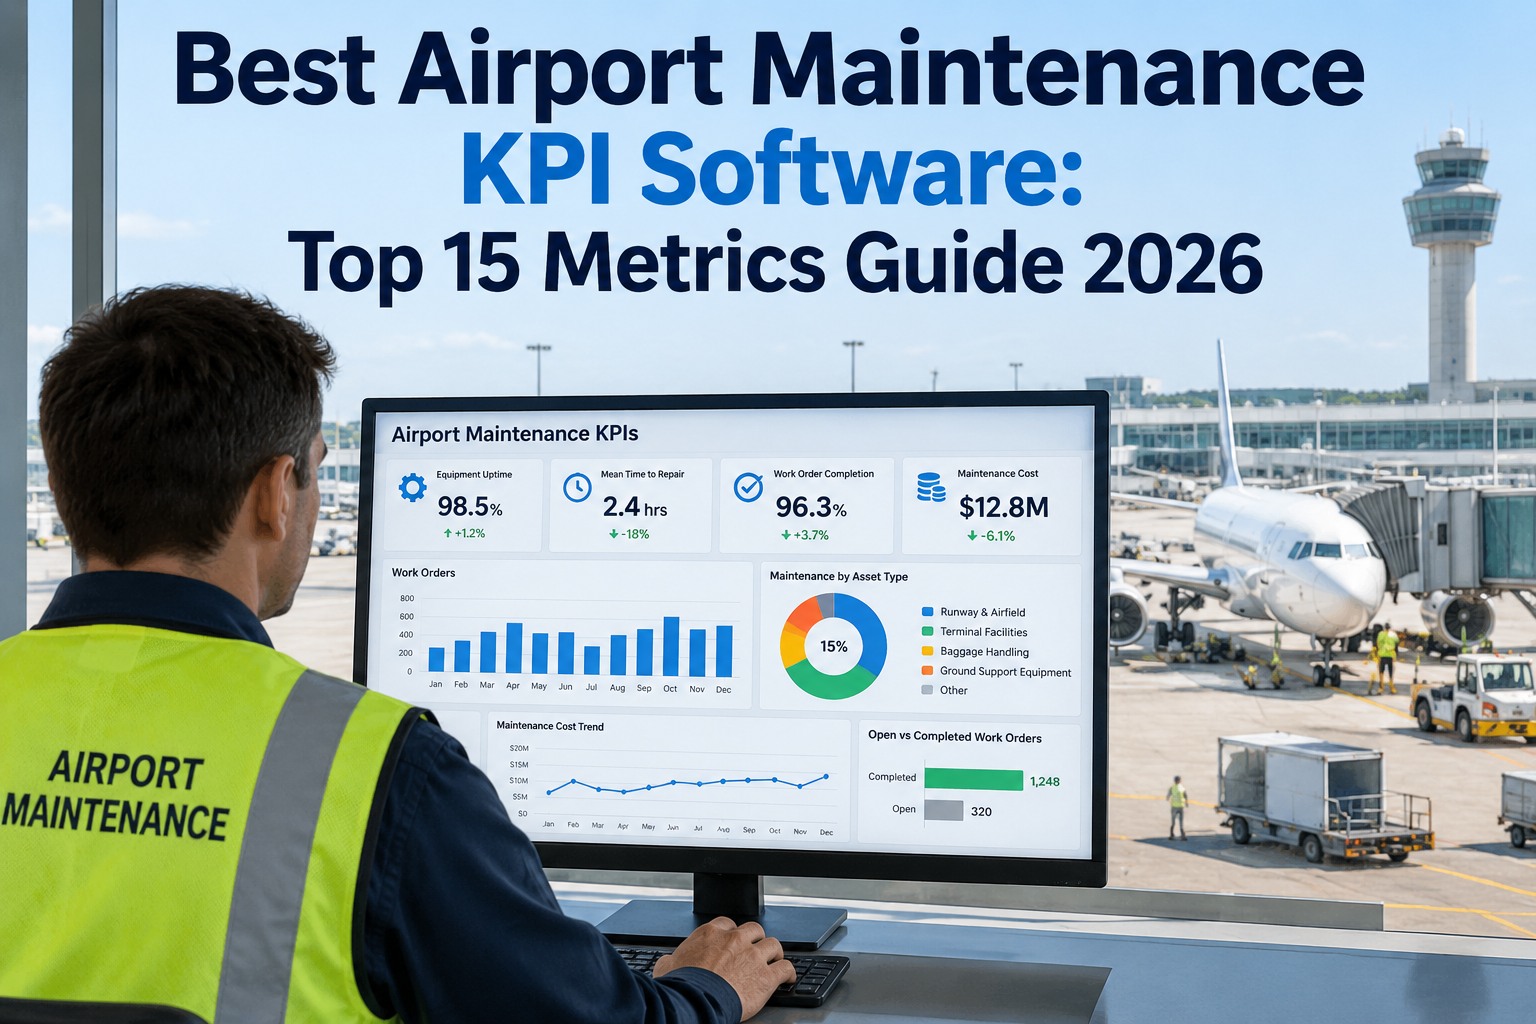
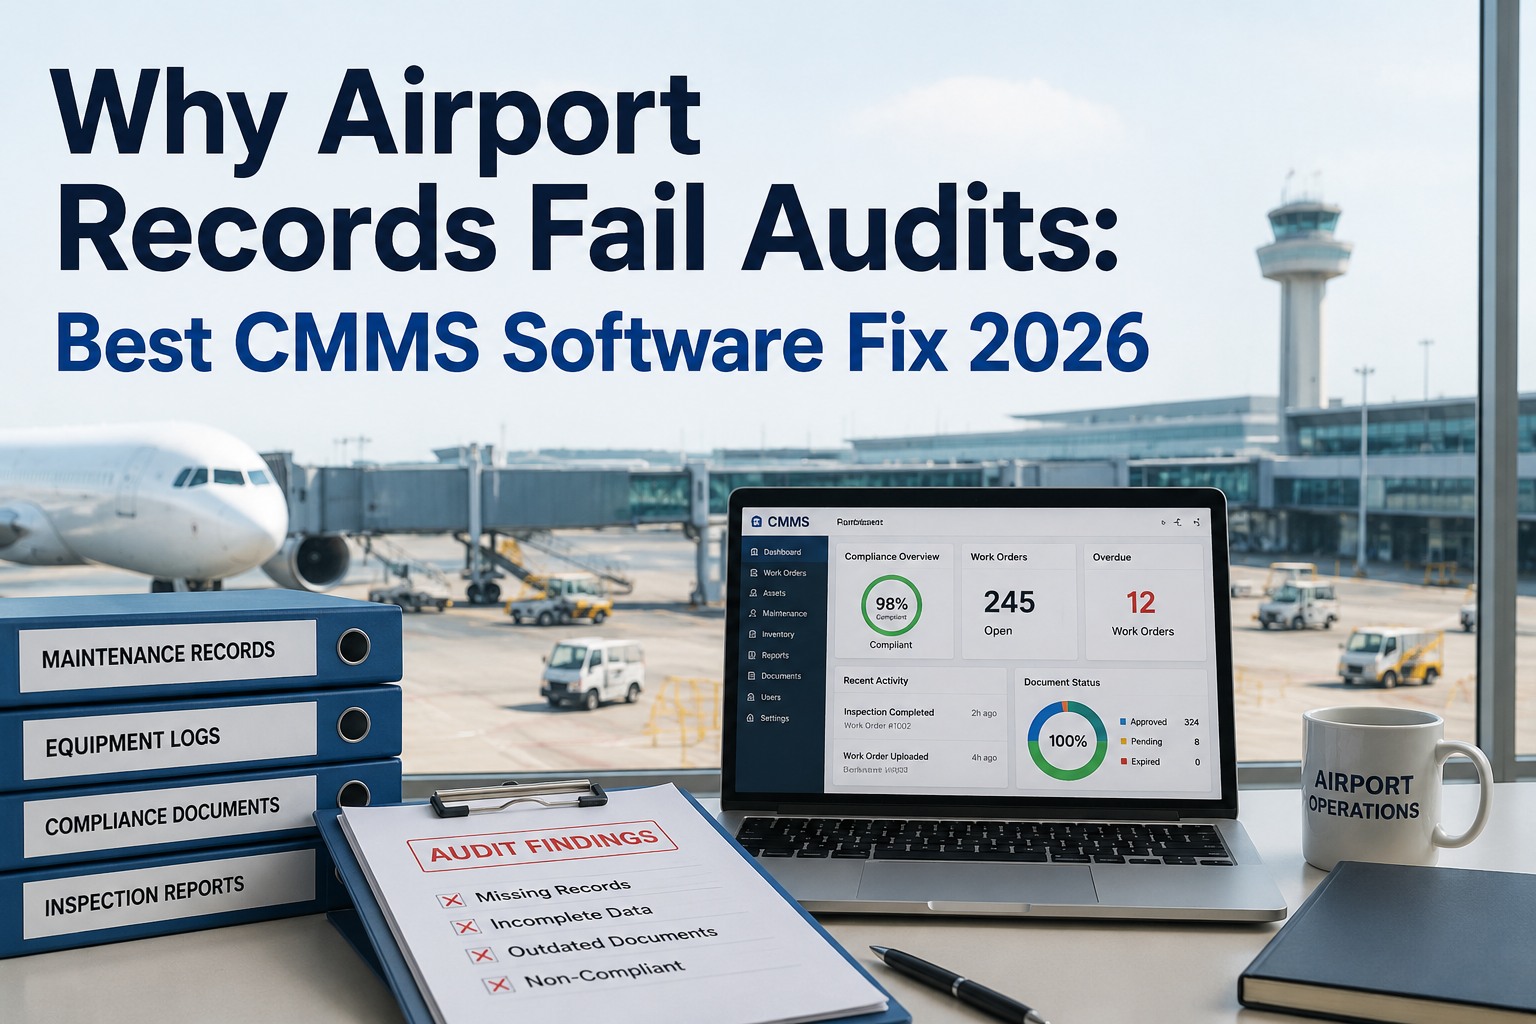
Whether your title is Compliance & Air Safety Officer or Duty/Designated Airport Manager, the job comes down to the same question every regulator eventually asks: show me your open findings, how long they've been open, and what you've done about them. Most compliance trackers can't answer that in one screen — findings live in one spreadsheet per regulator, aging is calculated by hand when someone remembers to check, and a closed corrective action doesn't always mean the underlying cause was actually fixed. A well-designed compliance dashboard pulls open findings, aging bands, evidence coverage and CAPA closeout into one live view instead of a pre-audit scramble. This guide covers what belongs on that dashboard and how OXMAINT AI keeps it current automatically, from the finding to the closed corrective action.
Aviation Compliance · CASO & DAM Reporting · Dashboard Design · 2026
Aviation Compliance Dashboard: Best KPI Design for CASO & DAM
A finding scattered across a regulator-specific spreadsheet isn't visible until someone goes looking for it — and by then it might be 90 days old with no corrective action attached. OXMAINT AI connects the workflow behind the dashboard: findings log against the regulator and asset that raised them, aging and evidence coverage calculate automatically, and every corrective action stays linked from root cause to closeout — so your KPI view reflects what's actually happening, not what was last updated by hand.
Finding Logged by Regulator
→
Aging & Evidence Tracked
→
CAPA Work Order
→
Dashboard Updated Live
Open Findings
by regulator, so nothing hides in a separate FAA, EASA or ICAO tracker
Aging Bands
how long each finding has actually been open, not just its status label
Evidence Coverage
the share of controls with linked, retrievable evidence behind them
CAPA Closeout
corrective and preventive actions tracked from root cause to verified fix
Why Most Compliance Dashboards Fail CASOs and DAMs
The data usually exists somewhere. The problem is that "somewhere" means four different places, updated on four different schedules. Sign up free and see your open findings pulled into one live view.
🗂
Siloed by Regulator
An FAA finding lives in one tracker, an EASA finding in another. Nobody has a single view of total open exposure.
📆
Aging Calculated by Hand
Someone opens a spreadsheet, subtracts dates, and updates a status column — usually only right before an audit.
📸
A Snapshot, Not a Trend
A quarterly report shows where things stand today. It doesn't show whether the same finding type keeps recurring.
🔓
Closed Without Verification
A CAPA gets marked closed the moment the immediate fix is done — before anyone checks whether the root cause actually stopped recurring.
Anatomy of the Dashboard — Sample View
Four panels, one screen. This is illustrative sample data showing the layout — not a real facility's figures. Book a demo to see this view built with your own findings data.
Sample Dashboard View — Illustrative Data
Open Findings by Regulator
Aging Bands
0–30 days · 9 findings
31–60 days · 5 findings
61–90 days · 3 findings
90+ days · 1 finding
Evidence Coverage
82%
of active controls have linked, retrievable evidence attached
CAPA Closeout Funnel
Root Cause Identified 18
Corrective Action Assigned 16
Preventive Action Logged 12
Effectiveness Verified 9
Aging Bands: The KPI That Tells the Real Story
A finding's status label says "open." An aging band says how worried to be about it. This is the single KPI most manual trackers get wrong, because it requires a live date calculation, not a status someone remembers to update.
0–30 Days
Fresh
Normal working range. No escalation needed — routine CAPA progress tracking applies.
31–60 Days
Watch
Should be visible to the CASO or DAM directly — not buried in a weekly status meeting agenda.
61–90 Days
Escalate
Requires an owner check-in and a documented reason if the corrective action is still open.
90+ Days
Critical
The finding that gets asked about first in any audit review — needs a named owner and a hard closure date.
A Closed CAPA With No Verified Effectiveness Check Is a Status Update, Not a Fix.
OXMAINT AI keeps root cause, corrective action, preventive action and effectiveness verification linked in one chain — so "closed" means checked, not just marked.
The CAPA Closeout Chain
1
Finding Logged
Regulator, source and asset recorded at the moment the finding is raised.
→
2
Root Cause Identified
Structured investigation ties the finding to an actual cause, not just a symptom.
→
3
Corrective Action
The immediate fix, assigned an owner and a due date.
→
4
Preventive Action
The systemic change meant to stop the finding type from recurring elsewhere.
→
5
Effectiveness Verified
A follow-up check confirms the fix actually worked before the CAPA closes.
Spreadsheet Tracker vs. Live Compliance Dashboard
Manual Spreadsheet Tracking
Separate tracker per regulator, manually reconciled
Aging recalculated by hand, usually before an audit
No visibility into evidence coverage across controls
CAPA marked closed with no linked effectiveness check
Live OXMAINT AI Dashboard
All regulators' findings in one view, filterable by source
Aging bands calculate automatically from the finding date
Evidence coverage percentage updates as records attach
CAPA closure requires a linked, verified effectiveness check
What OXMAINT AI Gives CASOs & DAMs
Multi-Regulator Findings View
Findings from every regulator and internal audit source in one filterable dashboard, not four separate spreadsheets.
Automatic Aging Calculation
Every open finding's age recalculates in real time, sorted into bands so nothing quietly crosses 90 days unnoticed.
Evidence Coverage Tracking
See at a glance which controls have retrievable evidence linked and which are still gaps.
Root-Cause-to-Closeout Chain
Every CAPA links root cause, corrective action, preventive action and effectiveness verification in one record.
Repeat-Finding Detection
Findings are checked against prior occurrences by area and regulatory reference, surfacing patterns a snapshot report would miss.
Exportable KPI Reports
Pull the current dashboard view — or any historical date range — into a shareable report for leadership or a regulator review.
"
Before this, I had four different spreadsheets — one per regulator — and every board meeting meant someone spending an evening reconciling them into one slide. Now the dashboard pulls all of it live: I can see exactly how many findings are sitting past 90 days, and the CAPA view actually shows whether the preventive action was verified, not just whether someone clicked "closed." It changed how I run the monthly compliance review entirely.
Compliance & Air Safety Officer · Regional Airport Authority
Frequently Asked Questions
What KPIs should an aviation compliance dashboard include first?
Start with open findings by regulator, aging bands, evidence coverage and CAPA closeout status — these four give a CASO or DAM the fastest read on total exposure and where attention is actually needed, before adding more specialized metrics.
How are aging bands calculated?
Aging is calculated from the date a finding was raised to the current date, updated automatically rather than manually recalculated. Findings sort into bands — typically 0–30, 31–60, 61–90 and 90+ days — so overdue items surface without a manual review.
What does "evidence coverage" actually measure?
It's the share of your active controls or findings that have retrievable evidence — a test record, inspection log, or closure document — actually linked to them, versus controls that exist on paper with no attached proof behind them.
Why does effectiveness verification matter for CAPA closeout?
A corrective action can resolve the immediate symptom without addressing the root cause, which means the same finding resurfaces later. Effectiveness verification is a follow-up check confirming the fix actually held before the CAPA is marked closed.
Stop Reconciling Spreadsheets Before Every Review.
Open findings, aging, evidence coverage and CAPA closeout — all live, all in one dashboard. That's the compliance workflow OXMAINT AI runs.