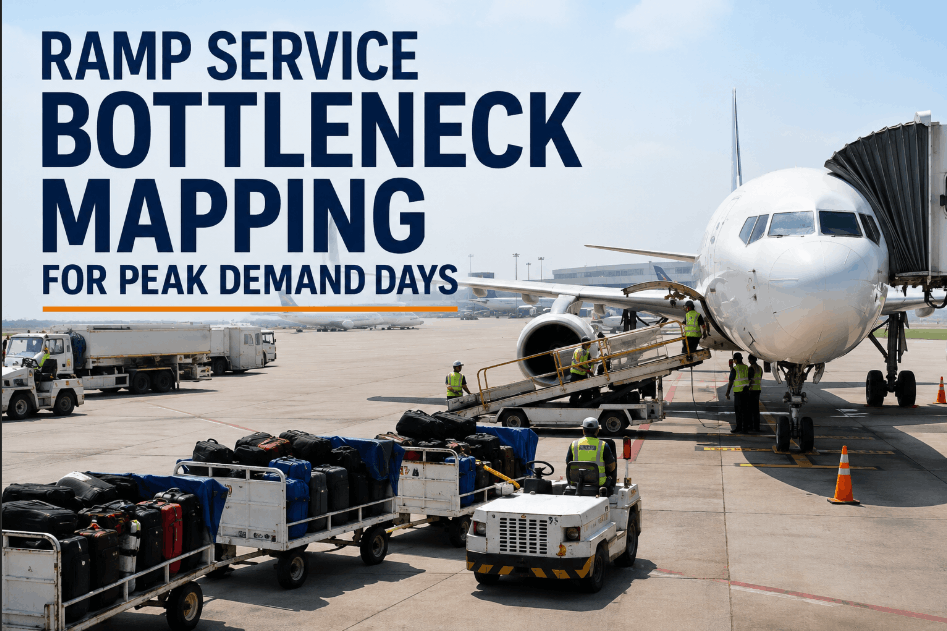
Ramp service operations collapse under pressure when peak demand days expose hidden bottlenecks that normal rotations mask entirely. Baggage offload sequencing, crew synchronization gaps, and service pacing mismatches accumulate delay minutes that compound across every gate during a high-volume push. Sign Up Free to connect your ground operations data to OxMaint's ramp analytics layer and identify bottleneck patterns before they freeze your departure buffer. For teams managing multi-gate or hub-level ramp complexity, Book a Demo to see how live service pacing visibility changes peak-day outcomes.
Map Ramp Bottlenecks Before They Cost You Departure Minutes
OxMaint surfaces baggage offload delays, crew sync gaps, and service pacing variance in real time — so your peak-day ramp runs on data, not instinct.
Why Ramp Bottleneck Mapping Matters on Peak Demand Days
The Hidden Cost of Service Pacing Failures During High-Volume Rotations
38%
of peak-day departure delays trace to ramp service pacing gaps invisible in daily shift logs
11 min
average delay added per rotation when baggage offload sequencing is uncoordinated at hub gates
3.2×
more gate holds recorded on peak days vs standard rotations when crew sync metrics are not tracked live
62%
of ramp supervisors report no real-time visibility into service pacing variance during peak demand pushes
Core Ramp Service Bottleneck Metrics: What to Measure and Why
From Gate-Level Delay Minutes to Fleet-Wide Service Continuity Signals
| Bottleneck Metric |
What It Measures |
OxMaint Dashboard View |
Operational Action Signal |
| Baggage Offload Time |
Actual vs planned offload cycle per rotation |
Gate-level trend + variance flag |
Gates with recurring offload overruns |
| Crew Sync Gap |
Time delta between crew arrival and service start |
Shift heatmap + delay attribution |
Crew handoff delays driving gate holds |
| Service Pacing Index |
Sequence completion rate vs departure buffer |
Rotation timeline + pacing score |
Rotations at risk of departure slip |
| Departure Buffer Erosion |
Planned buffer minutes consumed by ramp delays |
Buffer burn tracker per gate |
Gates consistently exhausting departure buffer |
| Gate Hold Frequency |
Gate hold events per rotation during peak windows |
Peak-period hold count + root cause log |
Repeat hold patterns tied to crew or asset gaps |
| Turnaround Variance |
Actual TAT vs planned across peak rotations |
Rotation-level variance histogram |
Flights with TAT creep requiring resource rebalance |
| Asset Visibility Score |
Ground support equipment availability vs demand |
Asset utilization map by gate zone |
Equipment shortfalls causing service delays |
OxMaint Ramp Analytics: From Bottleneck Detection to Operational Control
How Live Service Pacing Data Flows Across Your Peak-Day Operation
Gate Level
Baggage Offload Sequencing View
Track actual vs planned offload cycles per gate in real time. Identify sequencing gaps that accumulate delay minutes before they reach the departure buffer threshold.
Crew Operations
Crew Sync and Handoff Tracking
Surface crew arrival-to-service-start delta across shifts. Detect sync gaps between ground crew assignments that create preventable gate holds during peak rotations.
Service Pacing
Rotation Pacing Score Dashboard
Score each rotation's service sequence completion rate against departure buffer. Flag rotations trending toward a buffer overrun while recovery options still exist.
Asset Visibility
Ground Support Equipment Availability
Map GSE utilization across gate zones during peak demand windows. Identify equipment availability gaps that cascade into service pacing failures across multiple rotations.
Threshold Alerts
Proactive Departure Slip Notifications
Set departure buffer thresholds once. OxMaint alerts ramp supervisors when pacing metrics signal an imminent gate hold — before the pushback window closes.
Reporting
Peak-Day Bottleneck Audit Exports
Generate structured delay attribution reports for airline customers, ops leadership, and regulatory review — without manual assembly from shift logs or ramp sheets.
Where Ramp Bottlenecks Form: Four Peak-Day Failure Scenarios
Operational Situations Where Real-Time Ramp Visibility Changes the Outcome
01
Baggage Offload Cascade Across Consecutive Rotations
A single offload overrun on rotation one delays crew reassignment to rotation two. Without live sequencing data, the same crew gap repeats across three consecutive gates — each adding delay minutes invisible until the end-of-day report.
Sign Up Free to see how OxMaint flags offload cascades before the second rotation is affected.
02
Crew Sync Failure During Multi-Gate Peak Push
When three gates reach simultaneous turnaround windows and crew assignments are uncoordinated, sync gaps compound. OxMaint's crew handoff tracker surfaces which assignments are misaligned in real time — allowing rebalancing before gate holds accumulate.
03
Service Pacing Slip Before Departure Buffer Exhaustion
A rotation running 8 minutes behind service sequence pacing is invisible in shift logs until the departure buffer is gone. OxMaint's pacing score dashboard flags the rotation mid-service — while resource reallocation can still prevent the gate hold.
Book a Demo to walk through the live pacing view.
04
GSE Availability Gap During Peak Demand Window
Ground support equipment committed to one zone creates an availability gap in an adjacent gate cluster during simultaneous peak rotations. OxMaint's asset visibility map identifies the shortfall before it delays service start — not after the pushback window has already closed.
Connect Your Ramp Data to Live Bottleneck Analytics
Pre-built dashboards for baggage offload, crew sync, service pacing, and departure buffer monitoring — drill from hub view to individual gate in seconds.
Ramp Service Bottleneck Mapping: ROI Benchmarks
Outcomes from Real-Time Ramp Analytics Deployments
Performance Improvements Reported Using Live Ramp Bottleneck Dashboards
Reduction in Peak-Day Gate Hold Frequency (Live Pacing vs Shift Log Review)
Baggage Offload TAT Improvement (Real-Time Sequencing vs End-of-Day Reports)
Crew Sync Gap Reduction (Live Handoff Tracking vs Manual Crew Assignment)
Departure Buffer Preservation (Proactive Alert vs Passive Monitoring)
Turnaround Variance Reduction (Rotation-Level Analytics vs Weekly Report Cycles)
Choosing a Ramp Analytics Platform: What to Evaluate
What Separates a Ramp KPI Dashboard from an Operational Control Tool
Pre-Built Ramp KPIs
Verify the platform ships with baggage offload, crew sync, pacing index, and departure buffer tracking out of the box — not as custom BI configuration requiring months of setup.
Real-Time Data Refresh
Dashboards refreshing at end-of-shift are shift logs with better formatting. Confirm live or near-live refresh rates for gate hold status, pacing scores, and crew assignments.
Gate-to-Fleet Drill-Down
Fleet-level turnaround variance is only useful if a single click isolates the gate, rotation, or crew assignment driving the delay. Confirm drill-down reaches individual gate level.
Proactive Departure Alerts
Passive dashboards require someone to be watching. Confirm the platform pushes departure slip alerts to ramp supervisors when buffer erosion exceeds defined thresholds.
GSE Integration
A ramp dashboard disconnected from ground support equipment data creates blind spots. Evaluate pre-built connectors to GSE tracking, work order, and asset management systems.
Audit-Ready Delay Reporting
Airline customer SLA reviews and ops leadership reporting require structured, timestamped delay attribution records. Confirm the platform exports without manual assembly from shift logs.
Frequently Asked Questions
What ramp service metrics does OxMaint track out of the box?
OxMaint ships pre-built dashboards for baggage offload time, crew sync gaps, service pacing index, departure buffer erosion, gate hold frequency, turnaround variance, and GSE availability — no custom BI configuration required. Book a Demo to see the full ramp analytics library.
Can OxMaint detect ramp bottlenecks before they cause a gate hold?
Yes — OxMaint's service pacing alerts flag rotations trending toward departure buffer exhaustion while service recovery is still possible. Alerts push to ramp supervisors without requiring dashboard login.
How does OxMaint integrate with existing ramp and GSE management systems?
OxMaint connects via API and pre-built connectors to GSE tracking, work order management, and operations platforms. Integration scope is reviewed during the Book a Demo session for enterprise deployments.
Does OxMaint support multi-gate or hub-level ramp visibility?
Yes — OxMaint supports hub-level, gate-cluster-level, and individual gate drill-down with access controls for ops leadership, ramp supervisors, and airline customer reporting.
Can OxMaint generate delay attribution reports for airline customers?
OxMaint generates structured PDF and CSV delay attribution reports for airline customer SLA reviews and ops audits — timestamped and export-ready without manual assembly. Sign Up Free to test reporting against your own ramp data.
What is the typical ROI timeline for deploying a ramp bottleneck analytics platform?
Most operations report measurable gate hold reductions within the first peak-day cycle after deployment, with departure buffer improvements tracked from the first week of live monitoring.
Ready to Map Your Ramp Bottlenecks in Real Time?
OxMaint's pre-built ramp analytics dashboards give operations leaders live visibility into baggage offload, crew sync, service pacing, and departure buffer — before peak-day pressure turns into departure penalties.