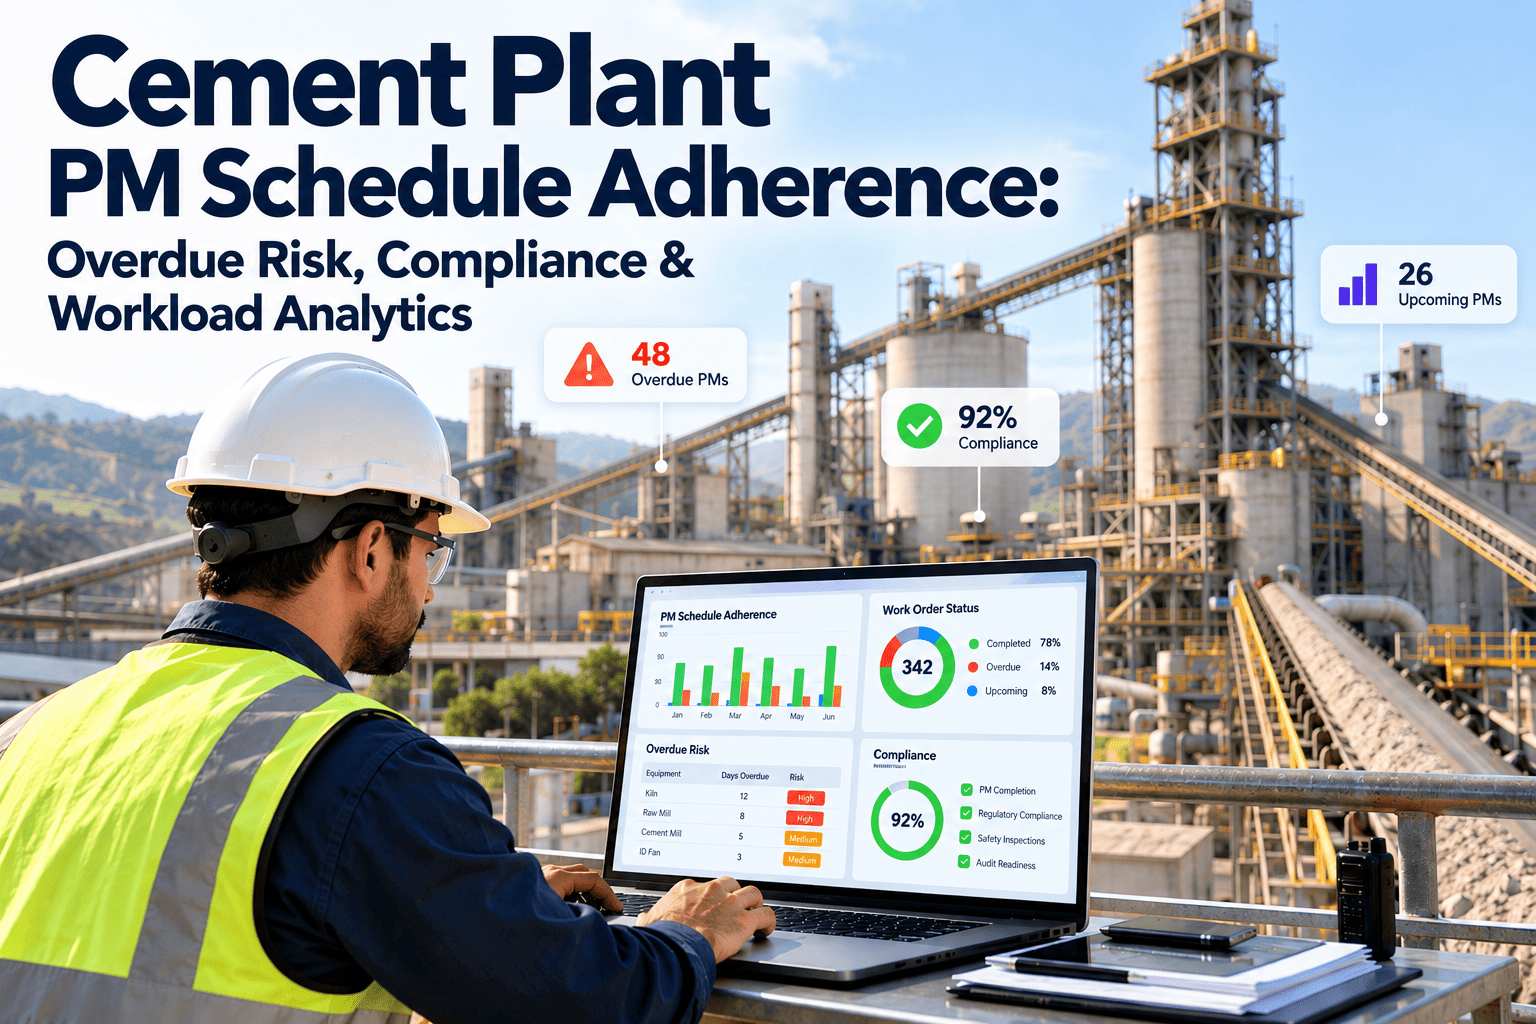
PM compliance below 80% is a leading indicator of rising unplanned failures — research across heavy process industries shows each 10% drop in compliance corresponds to a 15 to 20% increase in corrective work volume within 90 days. Most cement plants only discover this after the failures show up. A live compliance dashboard catches the slide while it is still a scheduling problem, not yet a kiln stop. See your real PM compliance number inside OxMaint before it shows up in next quarter's downtime report.
Your PM Compliance Rate Is Already Telling You Something
A plant tracking PM compliance manually finds out about schedule slippage weeks late, usually from a failure report instead of a dashboard. OxMaint surfaces the number, the trend, and the exact overdue tasks driving it — by asset area, in real time.
PM Compliance Is the Earliest Warning Light on Your Dashboard
One plant manager described the shift bluntly after introducing a CMMS-driven KPI dashboard: PM compliance moved from 71% to 88% in a single quarter simply because the number became visible to the people who could act on it. That is the entire value of a compliance dashboard — it does not change the work, it changes whether anyone notices the work sliding before it becomes a failure. Below 65%, plants spend four to six times more per repair event than plants sitting above it, because reactive work has quietly become the dominant mode of operation.
Four Views Every Maintenance Manager Checks Before the Monday Meeting
Get Your Live Compliance Dashboard Running in Under 60 Minutes
Connect your existing PM schedule to OxMaint and see compliance by asset area, overdue aging, and trend lines from your first session.
What Each Compliance Band Actually Means for Your Plant
| Compliance Range | Zone | What It Signals | Typical Action |
|---|---|---|---|
| 88% and above | Top Quartile | Schedule discipline is strong; failures are mostly unavoidable | Maintain current staffing and review cadence |
| 80% to 87% | Stable | Healthy program with normal week-to-week variance | Monitor trend line for early drift |
| 65% to 79% | At Risk | Corrective work volume likely rising within 90 days | Review overdue aging by asset area this week |
| Below 65% | Reactive Dominant | 4 to 6x higher repair cost per event versus top quartile | Escalate staffing or scheduling capacity immediately |
A Dashboard Only Helps If It Points at the Next Decision
Plenty of spreadsheet trackers can show a compliance percentage. The difference with a live CMMS dashboard is the drill-down — every number connects directly to the underlying work orders, so a manager seeing a dip in crusher PM compliance can open the exact overdue tasks, see who they are assigned to, and reassign or escalate immediately instead of investigating from scratch.
PM Compliance Dashboards, Explained
Stop Waiting for the Failure Report to Find Out Compliance Slipped
See your real-time PM compliance by asset area, overdue task aging, and trend line — and act before the gap becomes downtime.