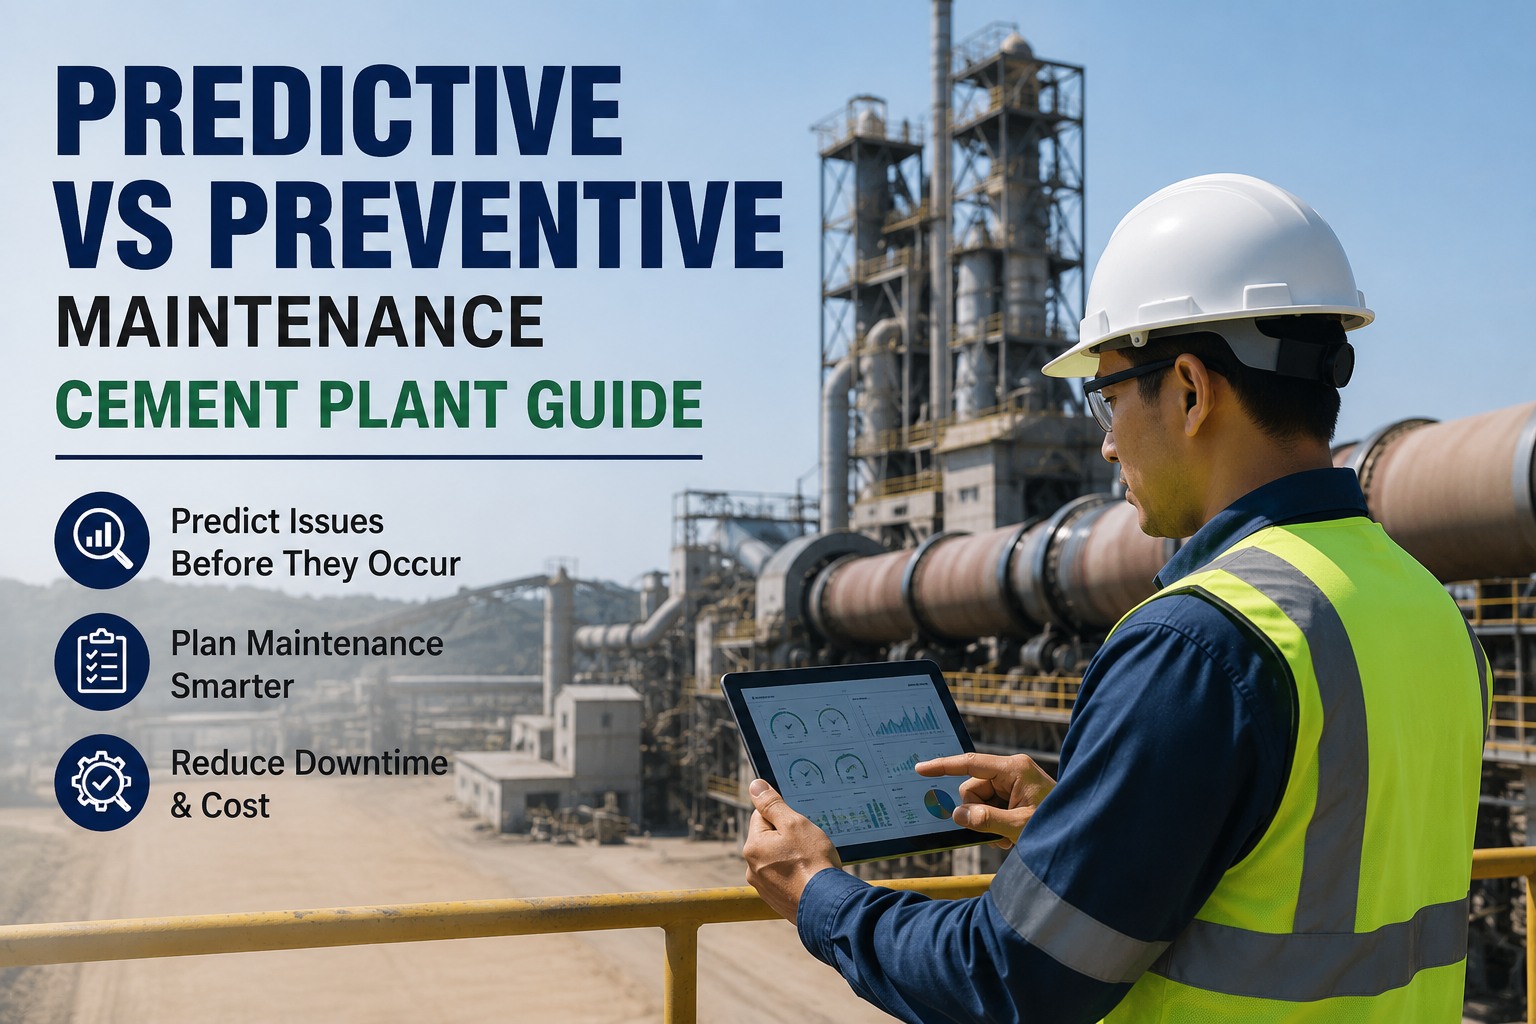
Cement plants lose an estimated 5–7% of annual revenue to unplanned downtime, with a single kiln outage costing $80,000–$120,000 per day in lost clinker output. The maintenance strategy you choose—preventive (PM), predictive (PdM), or a calculated blend—directly determines whether your OEE sits at 78% or breaks past 92%. This guide breaks down the decision framework, adoption path, and optimization tactics that combine both approaches into one coherent reliability program. Ready to stop reacting and start predicting? Start Free Trial and build your maintenance mix in days, not quarters.
Preventive tells you when to act. Predictive tells you when it actually matters.
Most cement plants run 70–80% PM and wonder why unplanned downtime still eats 300+ hours a year. The right blend—mapped by asset class—cuts unplanned events 35–50% within 18 months.
- Fixed calendar intervals
- 30–40% over-maintenance
- 250+ unplanned hrs/yr
- $1.2M annual downtime cost
- Condition-triggered work
- 15–20% over-maintenance
- 120 unplanned hrs/yr
- $0.6M annual downtime cost
Two philosophies, one maintenance strategy
Preventive maintenance executes work on a fixed schedule regardless of asset condition; predictive maintenance executes work only when condition data says degradation has begun. The gap between them—in cost, coverage, and risk—is where most cement plants either win or bleed.
| Dimension | Preventive (PM) | Predictive (PdM) |
|---|---|---|
| Trigger | Calendar / runtime hours | Vibration, temperature, oil, ultrasonic trends |
| Typical cement coverage | 60–80% of assets | 10–25% of critical assets |
| Unplanned failure reduction | 15–25% | 35–55% |
| Sensor / tech cost per asset | $0–$500 | $1,500–$8,000 |
| Best-fit asset class | Standard motors, fans, conveyors | Kiln, mill, crusher, ID fan |
| Over-maintenance risk | High (30–40%) | Low (10–15%) |
| Time to value | Immediate | 3–6 months baseline |
Match the strategy to the asset, not the other way around
A 12,000-tpd cement plant carries 4,000–6,000 maintainable assets. Treating them all the same is the single most expensive mistake in reliability engineering. Use criticality—production impact × failure frequency × lead time—to assign PM, PdM, or run-to-failure.
Rotary Kiln & Preheater
Shell temperature scanning, tire migration, thrust roller vibration, and cooler grate pressure. A 1°C hotspot trend caught 9 days early prevents a $2M brick failure and 4 days of lost production.
Cement Mill & Ball Mill
Trunnion bearing temperature, gearbox vibration, motor current signature. Lube-oil particle counts above ISO 18/16 give 3–5 weeks warning before bearing spalling accelerates into failure.
Crushers & ID Fans
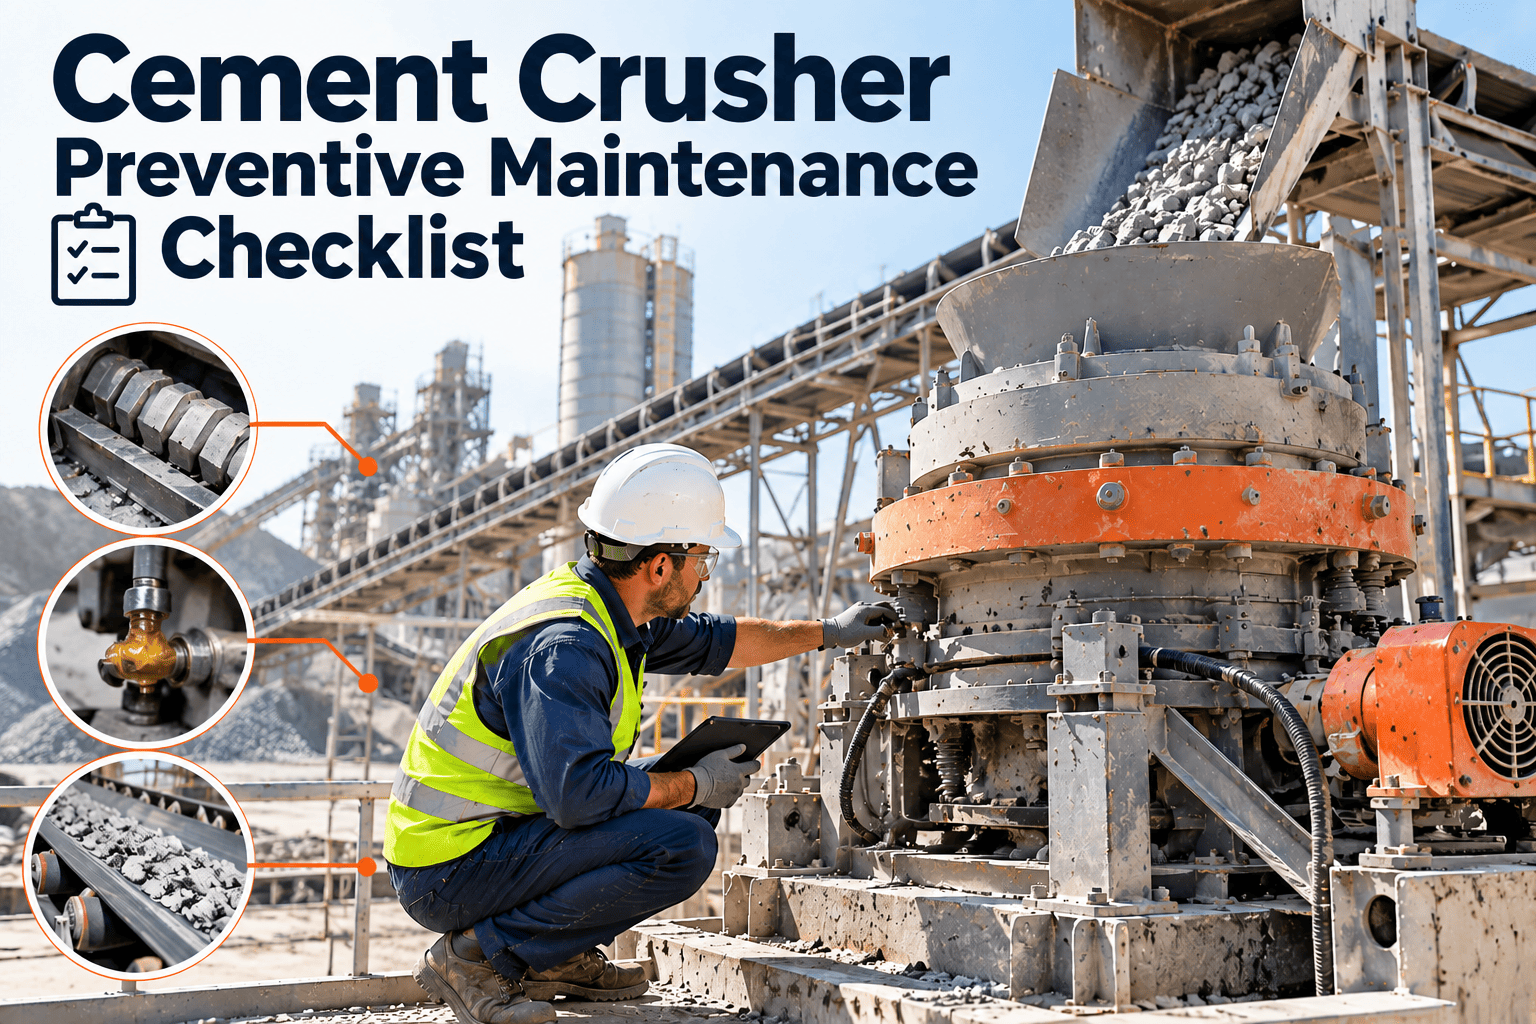
Routine liner changes every 2,500 hours plus vibration sensors on fan bearings. Hammer-mill rotor imbalance trends flagged at 4.5 mm/s cut unplanned crusher outages by 40%.
Conveyors & Bucket Elevators
Chain inspection, sprocket alignment, and belt thickness checks on 90-day cycles. Add ultrasonic monitoring on elevator head bearings—$400 per sensor—to catch early bearing wear.
Pumps & Compressors
Lubrication routes, seal inspection, and filter changes per OEM intervals. 500+ small pumps don't justify PdM sensors—PM at optimized intervals keeps cost-per-asset under $300/yr.
Lighting & Niche Auxiliaries
Non-production-critical assets with low replacement cost and redundant backups. Carry spares, log failures, and review annually. Over-maintaining these is pure waste.
From zero sensors to a predictive program in 6 months
A staged rollout beats a big-bang sensor deployment every time. Plants that pilot PdM on 8–12 critical assets see a 3:1 ROI before scaling, while full-plant pilots stall in data overload and 60% fail to reach steady state.
Criticality Assessment & Asset Selection
Rank all assets by production impact and failure frequency. Select 8–12 Tier-1 assets—typically kiln drive, mill gearbox, and two ID fans—for the pilot. Document failure modes (FMEA) for each.
Sensor Installation & Baseline
Deploy wireless vibration + temperature sensors on selected assets. Establish 30–60 day baselines under normal load. Tag anomaly thresholds at 2x and 3x baseline RMS velocity.
Anomaly Detection & First Catches
Tune alerting to filter false positives below 5%. First validated catches typically appear in weeks 8–10—often bearing wear on a mill pinion or fan imbalance. Convert each catch into a work order and log the avoided cost.
ROI Validation & Scale Plan
Tally avoided downtime, parts saved, and labor redirected. A successful pilot shows $150K–$400K in avoided cost. Use the data to justify scaling PdM to 25–40 assets in months 7–12.
Stop over-maintaining—tune your PM intervals with real data
60% of cement plants still run PM intervals copied from OEM manuals written 15 years ago. PM optimization (PMO) uses failure history and condition data to stretch, shorten, or eliminate tasks—typically cutting PM labor 20–30% with zero increase in failures.
Worked example: a 180-asset plant spending $42K/yr on PM labor
A mid-size cement grinding plant ran 92% of assets on calendar-based PM inherited from commissioning. After a 90-day PMO review—analyzing 3 years of work-order history and failure data—they eliminated 148 redundant tasks, extended 62 intervals by 30–50%, and moved 24 critical assets to PdM. Result: PM labor dropped to $29K/yr, unplanned downtime fell from 280 to 165 hours, and the PdM sensor investment paid back in 7.2 months. Total annual savings: $312K.
What cement maintenance managers get wrong about PdM
Three persistent myths keep cement plants stuck in reactive mode. Each one costs real money—usually $200K–$500K per year in avoidable downtime.
PdM replaces PM entirely once you install sensors.
PdM supplements PM for 15–25% of critical assets. Lubrication, calibration, and visual inspection still run on PM intervals. The best plants run a 50/40/10 mix.
PdM requires a $500K+ enterprise platform and 2-year deployment.
Wireless vibration sensors cost $200–$600 each. A 12-asset pilot runs $25K–$45K all-in and reaches first ROI in 6–9 months with modern SaaS CMMS platforms.
We need a data scientist to interpret vibration and thermal trends.
Automated anomaly detection with ISO 10816 thresholds routes 80% of alerts straight to work orders. Your reliability engineer handles the remaining 20%—no PhD required.
What the numbers look like for a typical cement plant
These benchmarks come from aggregated data across 40+ cement plant deployments. Your figures will vary by plant size, asset age, and current maintenance maturity—but the ratios hold.
| Metric | PM-Only Baseline | Optimized PM+PdM | Delta |
|---|---|---|---|
| Annual maintenance labor cost | $680K | $540K | –20.6% |
| Unplanned downtime hours/yr | 280 hrs | 120 hrs | –57.1% |
| Spare parts inventory (working) | $1.8M | $1.3M | –27.8% |
| OEE | 78.5% | 88.2% | +9.7 pts |
| MTBF (critical assets) | 340 hrs | 620 hrs | +82.4% |
| PdM program annual cost | $0 | $85K | +$85K |
| Net annual savings | — | $610K | Payback 7 mo |
Build a single program, not two competing ones
The biggest failure mode isn't choosing wrong between PM and PdM—it's running them as separate programs with separate teams, separate KPIs, and separate work-order queues. One CMMS, one priority matrix, one reliability team.
"We ran PM and PdM in silos for 3 years—two systems, two teams, two sets of KPIs. Merging into one queue lifted our wrench-time from 28% to 41% in a single quarter. The technology was already there; the integration wasn't."
Map your PM–PdM blend this week.
Upload your asset list, run a criticality assessment, and see your optimized maintenance mix in 48 hours.
Predictive vs preventive maintenance in cement plants
The five questions cement reliability managers ask most when designing a blended maintenance strategy.
What percentage of cement plant assets should be on PdM vs PM?
A healthy blend is 45–55% PM, 30–40% PdM, and 10–15% run-to-failure. PdM should cover Tier-1 critical assets—the kiln, mill, crusher, and ID fans—where unplanned downtime exceeds $50K/day. Standardizing PdM across all 4,000+ assets wastes capital; targeting only the top 15–25% captures 80% of the savings. Book a Demo to see your recommended split.
How long does it take to see ROI from a PdM pilot in a cement plant?
A well-scoped 8–12 asset pilot typically shows first validated catches in weeks 8–10 and reaches positive ROI in 6–9 months. The fastest payback comes from kiln and mill assets where a single avoided failure saves $100K+. Most plants see $150K–$400K in avoided cost within the first year of the pilot.
Can we keep our existing CMMS when adding PdM?
Yes, if your CMMS supports API integrations or automated work-order creation from external alerts. If it doesn't, you'll end up with a shadow system—PdM alerts in one platform, work orders in another—which defeats the purpose of a unified program. Modern SaaS CMMS platforms integrate sensor data natively and route alerts straight into the work-order queue.
What sensors do we actually need for cement plant PdM?
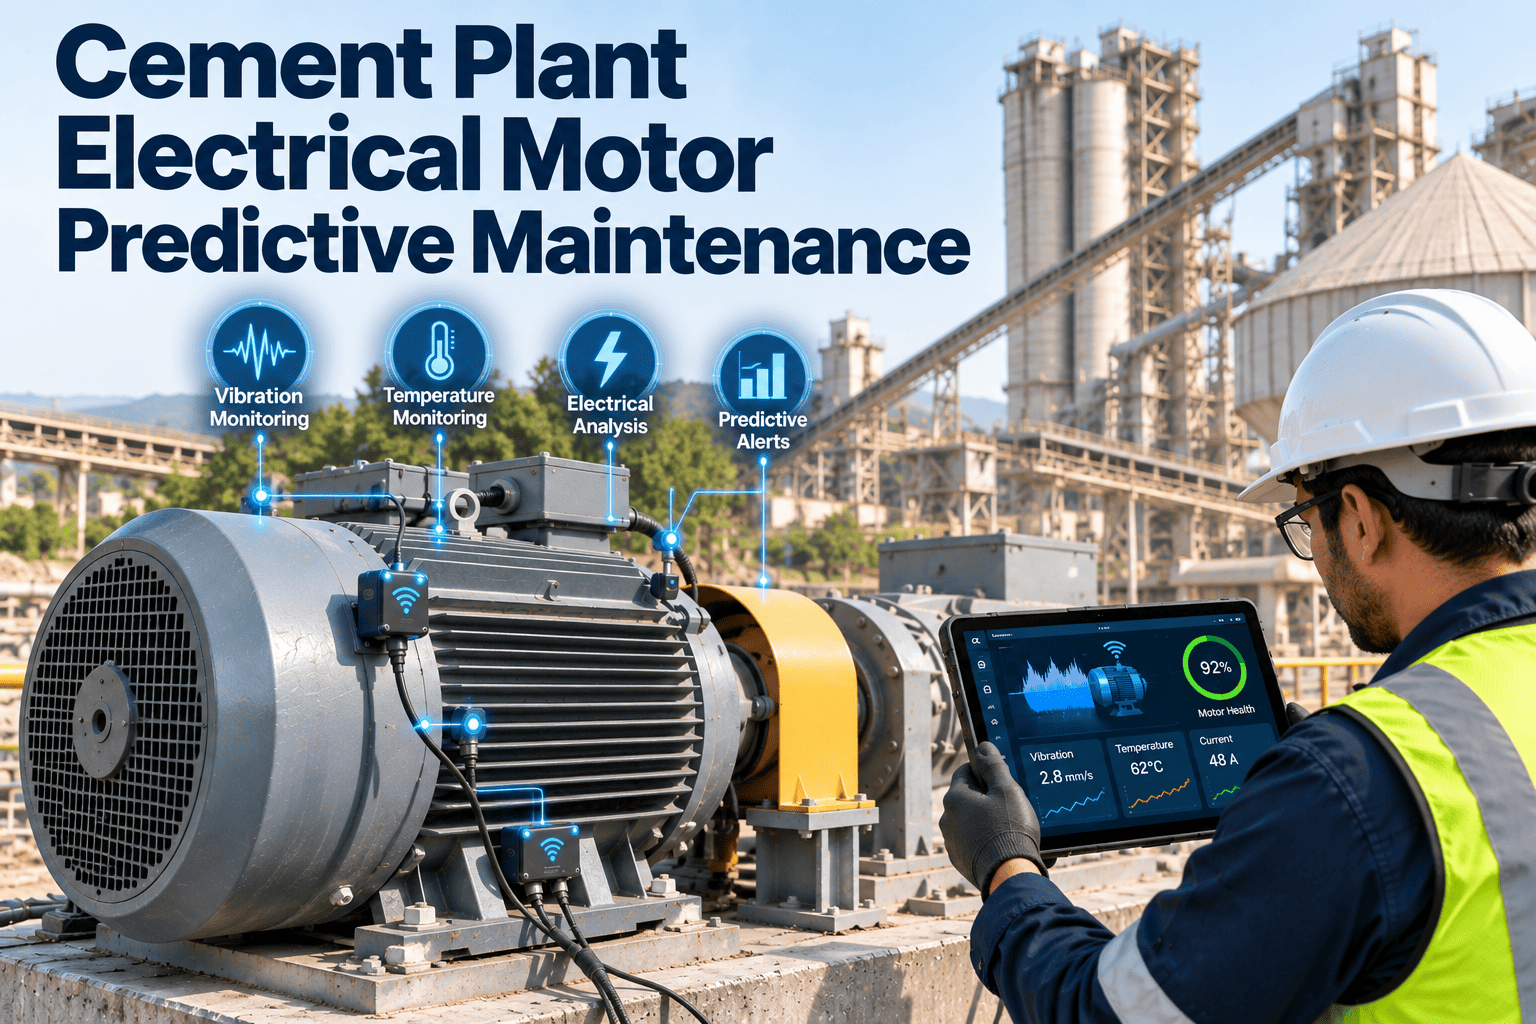
For rotating equipment—kiln drives, mills, fans, crushers—wireless vibration plus temperature sensors cover 80% of failure modes at $200–$600 per point. Add oil analysis (particle count, water content) for large gearboxes and motors. Shell scanners and thermography cameras cover kiln-specific failure modes but cost $30K–$80K and are justified only for Tier-1 assets.
How do we optimize existing PM intervals without increasing failure risk?
Start with a 90-day PMO review: pull 2–3 years of work-order history, calculate MTBF for each asset, and compare actual failure frequency against the PM interval. If a task runs 4x per failure, you're over-maintaining—extend the interval 30–50%. Use PdM trend data to confirm the new interval is safe before committing. Most plants cut PM labor 20–30% with zero increase in unplanned failures. Start Free Trial to run your first PMO review.
Build your optimized maintenance mix today
Join cement plants cutting unplanned downtime 35–50% with a data-driven PM + PdM strategy. Set up your asset register, run criticality analysis, and deploy your first PdM alerts in a single afternoon.
Free 14-day trial · No credit card