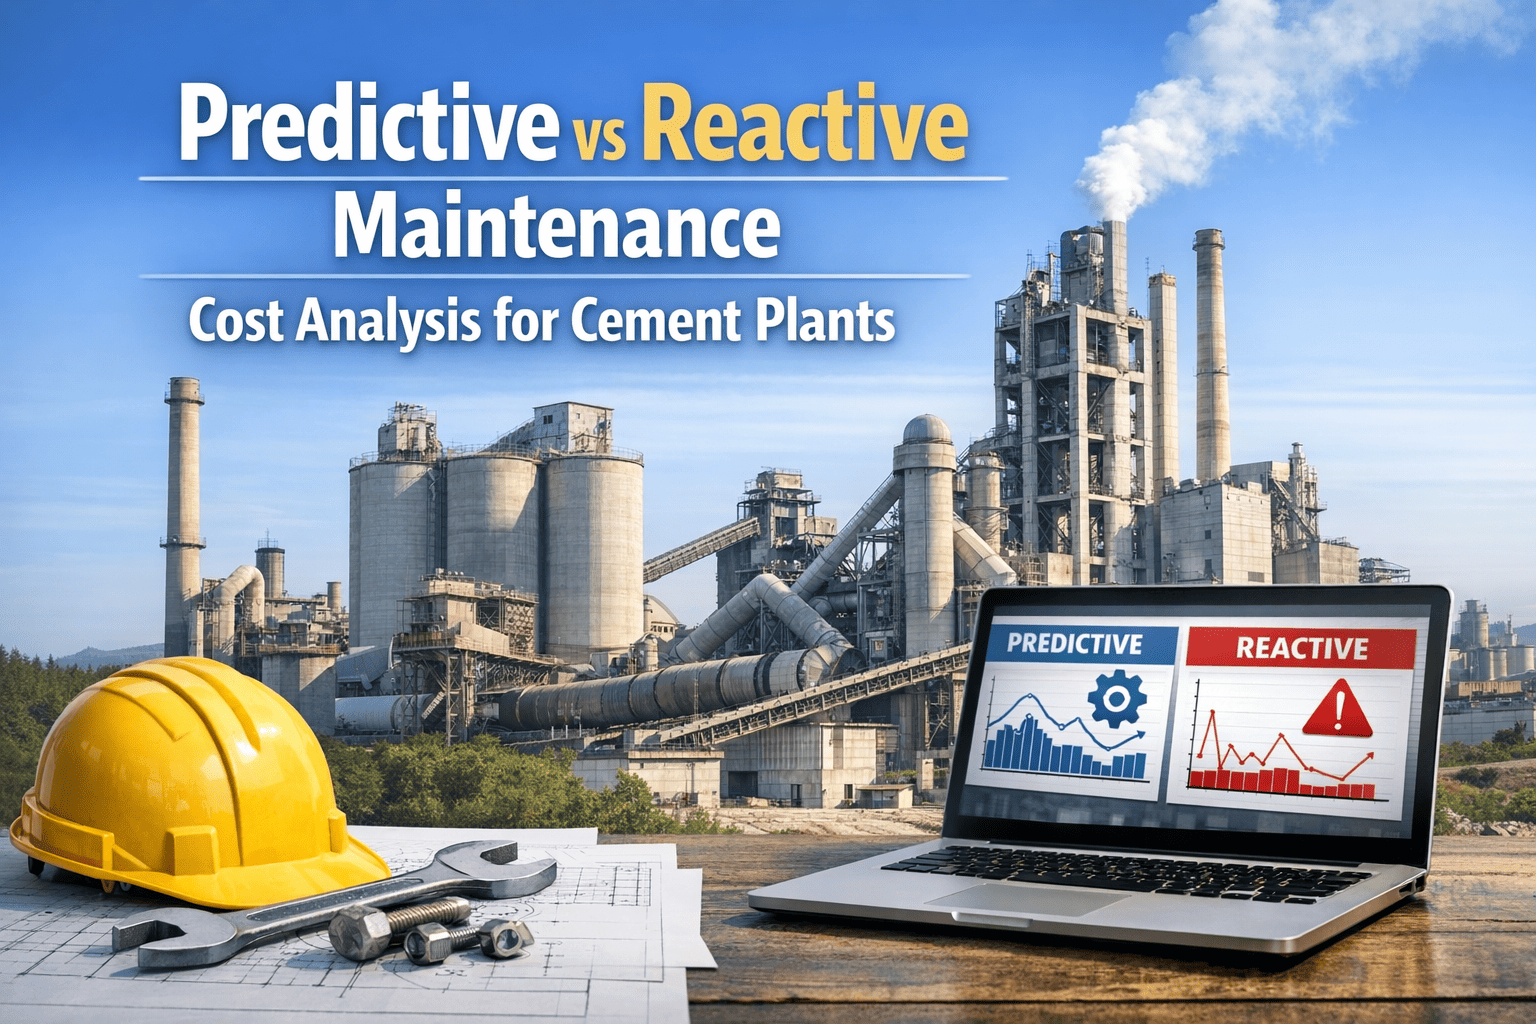
A cement plant in South Asia was spending ₹8.4 crore a year on maintenance — and could not understand why the number kept rising despite buying newer spare parts and hiring more contractors. When the plant manager mapped every failure event over 24 months, the answer was immediate: 61% of total maintenance spend was being consumed by emergency reactive repairs that cost, on average, 5.8 times more than the same job would have cost if planned. The plant was not spending too much on maintenance. It was spending almost everything on the wrong kind. Sign in to OxMaint to map your plant's reactive vs predictive maintenance spend and see exactly where your budget is leaking. Book a demo to see how OxMaint shifts cement plants from reactive firefighting to planned predictive operations.
The Bottom Line Before We Begin
Reactive Maintenance
5–8×
higher cost per repair event than the equivalent planned job — including emergency labour, premium parts, air freight, and secondary asset damage
Costs More. Every Time.
VS
Predictive Maintenance
40%
lower total maintenance cost vs reactive baseline — US Department of Energy benchmark, confirmed across cement industry deployments
Costs Less. Consistently.
OxMaint · Cement Plant Maintenance Cost Analysis
Your cement plant is already paying the cost of reactive maintenance. The question is whether you will keep paying it — or redirect it into a predictive system that eliminates 70% of unplanned failures.
The True Cost Anatomy of a Reactive Repair vs a Planned Repair
Most maintenance managers calculate repair cost as parts + labour. Reactive repairs carry four additional cost layers that are rarely captured — but that routinely push the total 5–8x above the planned equivalent.
Reactive Repair — Full Cost Stack
20%
Parts + Labour (base cost)
+18%
Emergency freight premium (3–5× standard parts cost)
+14%
Overtime + weekend call-out labour
+23%
Production loss during unplanned downtime
+25%
Secondary damage (cascade failures, refractory, shaft damage)
Total: 5–8× base repair cost
Planned Predictive Repair — Full Cost Stack
20%
Parts + Labour (same base cost)
₹0
Emergency freight eliminated — standard procurement, standard pricing
₹0
Overtime eliminated — scheduled weekday maintenance window
Min
Production loss minimised — planned shutdown in scheduled window
₹0
Secondary damage eliminated — component replaced before failure
Total: 1.0–1.2× base repair cost
Where Your Maintenance Budget Goes: Reactive Plants vs Predictive Plants
The budget allocation difference between a reactive cement plant and a predictive one is not marginal. It is a structural inversion — and it explains why reactive plants cannot escape rising maintenance costs regardless of spend increases.
Typical Reactive Cement Plant
Industry average, 2024 CEMBUREAU data
Emergency reactive repairs
55%
Scheduled preventive maintenance
30%
Predictive / condition-based
5%
55% of budget burns on failures that did not need to happen
Best-in-Class Predictive Cement Plant
Top-quartile performance, OxMaint deployment data
Emergency reactive repairs
20%
Scheduled preventive maintenance
35%
Predictive / condition-based
35%
70% of budget allocated to planned work that prevents failures
Three Real Failure Scenarios: What Reactive Costs vs What Predictive Costs
The cost gap between reactive and predictive maintenance is most visible when calculated at the individual failure event level. These three scenarios are representative of what cement plants experience repeatedly.
Scenario 1 — Kiln Main Drive Bearing Failure
Reactive Response
Bearing fails during night shift — production stops immediately
Emergency contractor mobilisation: +72 hours arrival time
Bearing air-freighted: 3.8× standard price + customs
Thermal shock during rapid cool-down destroys refractory lining
Shaft scoring requires additional machining: +₹8L
Total downtime: 96–140 hours
Total Cost: ₹42L – ₹68L
Predictive Response
OxMaint flags bearing degradation 6–8 weeks before failure
Replacement bearing ordered standard freight: standard price
Repair scheduled for planned shutdown window
Controlled slow cool-down — refractory intact, no secondary damage
Kiln restarted on schedule — production impact: 8 hours planned
Total downtime: 8–12 hours planned
Total Cost: ₹4L – ₹7L
Cost difference on this single event: ₹35L – ₹61L saved with predictive
Scenario 2 — Vertical Roller Mill Gearbox Failure
Reactive Response
Gearbox tooth spalling causes catastrophic seizure mid-shift
Gearbox housing damaged — replacement required, not just repair
OEM lead time: 8–14 weeks standard; 3 weeks air freight at premium
Mill offline for minimum 22 days — raw material supply chain disrupted
Overtime and weekend labour throughout recovery
Total Cost: ₹85L – ₹1.4 Cr
Predictive Response
Vibration analysis detects gear mesh harmonic increase 8 weeks prior
Gear set replacement ordered via standard ocean freight
Replacement scheduled during planned quarterly shutdown
Housing intact — only gear set replaced, not entire gearbox
Mill downtime: 16 hours within planned shutdown
Total Cost: ₹8L – ₹14L
Cost difference on this single event: ₹70L – ₹1.2 Cr saved with predictive
Scenario 3 — ID Fan Bearing Failure (Preheater)
Reactive Response
ID fan seizes — preheater outlet gas uncontrolled, kiln forced off
Bearing and shaft damaged; impeller blade checked for balance
Emergency repair team: weekend + overtime rates apply
Kiln restart after cold stop: 18-hour heat-up sequence required
Total kiln downtime: 44–60 hours including restart
Total Cost: ₹22L – ₹38L
Predictive Response
Temperature and vibration sensors flag early bearing degradation
Bearing replaced during next planned kiln inspection window
Standard weekday labour rates — no overtime premium
Kiln maintained at reduced load during bearing replacement — no full stop
Total kiln impact: 6 hours partial load reduction
Total Cost: ₹2.5L – ₹4L
Cost difference on this single event: ₹19L – ₹34L saved with predictive
The Six Hidden Cost Multipliers of Reactive Maintenance
Every reactive repair carries cost layers that do not appear on the work order. These six multipliers explain why plants running reactive maintenance cannot reduce costs simply by negotiating better parts prices or hiring cheaper contractors.
01
Emergency Procurement Premium
Parts ordered reactively cost 3–5× the standard price once emergency freight, customs handling, and expediting fees are included. A ₹40,000 bearing ordered reactively arrives at ₹1.5–2 lakh. The same bearing ordered on 6-week lead time costs ₹42,000.
Avg. premium: 3–5× standard parts cost
02
Cascade Damage Cost
A failed bearing that is not replaced becomes a failed shaft. A failed shaft damages the housing. Each stage of cascade failure multiplies the repair cost. Kiln bearing-to-refractory cascade events routinely turn ₹50,000 repairs into ₹15–25 lakh restoration projects.
Typical cascade multiplier: 10–30× original failure cost
03
Overtime Labour Inflation
Unplanned failures occur disproportionately during nights and weekends — heavy equipment runs continuously. The same repair that costs ₹80,000 in day-shift labour costs ₹1.6–2 lakh at weekend overtime rates with contractor mobilisation premiums.
Labour cost premium: 2–3× standard rates on emergency call-outs
04
Dead Stock Inventory Carrying Cost
Reactive plants hold 40–60% more spare parts inventory than predictive plants — because they cannot predict what will fail next. For a plant with ₹5 Cr in spare parts inventory, the annual carrying cost of the excess buffer runs ₹60–80 lakh, earning nothing and degrading on the shelf.
Typical excess inventory: 40–60% above predictive plant baseline
05
Quality Loss During Unstable Operation
Degrading equipment produces variable output before it fails — higher clinker free lime, inconsistent Blaine fineness, elevated SO₃. Quality costs from reactive maintenance periods include rework, customer complaints, and grade downgrades that rarely appear in maintenance cost tracking but directly impact revenue.
Quality variance increase: 30–50% in the 30 days before a reactive failure
06
Energy Efficiency Degradation
Degrading bearings, misaligned drives, and worn grinding media all consume more energy than healthy equipment. A cement plant running 15% of its assets in degraded condition typically pays 3–5% more in specific energy consumption — ₹60–100 lakh annually in additional energy cost for a 2 MTPA plant.
SEC increase: 3–5% in degraded asset fleets, vs predictive baseline
The Transition: How Cement Plants Move from Reactive to Predictive in 90 Days
Moving from reactive to predictive maintenance does not require a full-plant transformation on day one. The OxMaint 90-day transition model starts with your five highest-cost failure assets and builds from there.
Failure Cost Audit
Load 24 months of failure records into OxMaint. The platform calculates your reactive vs predictive spend ratio, identifies the 8–10 assets responsible for 75–80% of total unplanned cost, and ranks them by annual risk exposure. This audit is the foundation for every subsequent ROI calculation and priority decision.
Sign in to OxMaint to begin your failure cost audit with your plant's existing maintenance data.
Sensor Deployment on Priority Assets
IoT sensors — vibration accelerometers, temperature probes, current transformers — are installed on your 5–10 highest-criticality assets during normal production. Installation requires no production shutdown. OxMaint begins ingesting sensor data within 24 hours of installation, establishing normal operating baselines automatically over the following 21 days.
First Predictive Alerts — Reactive Spend Starts Dropping
Within 45–60 days of sensor activation, OxMaint begins generating predictive maintenance alerts for at-risk assets. The maintenance team starts receiving advance warnings 30–90 days before projected failure — shifting repair scheduling from reactive response to planned intervention. Emergency call-out frequency begins falling immediately.
Book a demo to see OxMaint's predictive alert workflow on cement plant equipment data.
First Prevented Failure — ROI Confirmed
Typically within 60–90 days of full sensor deployment, OxMaint prevents its first major failure event. The avoided cost — documented in OxMaint's savings tracker against the plant's cost-per-hour input — usually exceeds the total Phase 1 deployment cost. This is the event that converts sceptical maintenance managers and funds the Phase 2 expansion to the full asset register.
Predictive vs Reactive Maintenance: Full Cost and Performance Comparison
Every operational dimension where the two strategies diverge — and what that divergence costs your plant annually.
| Dimension |
Reactive Maintenance |
Predictive with OxMaint |
| Cost per repair event |
5–8× planned equivalent (emergency premium stack) |
1.0–1.2× parts + labour — no premium stack |
| Annual maintenance cost |
Baseline — 55% drains into emergency reactive spend |
18–25% lower within 12 months of deployment |
| Unplanned downtime hours |
Industry avg: 400–700 hrs/yr on kiln + mills combined |
45–50% reduction — typically 200–350 hrs/yr remaining |
| Emergency call-out frequency |
Avg. 8–14 emergency call-outs/month at reactive plants |
Drops to fewer than 3/month within 6 months |
| Spare parts inventory value |
40–60% excess buffer — high carrying cost, high obsolescence |
15–30% inventory reduction via just-in-time procurement |
| Equipment lifespan |
Shortened by cascade damage and run-to-failure operation |
20–40% life extension across monitored asset fleet |
| Maintenance cost as % of ARV |
4–6% of asset replacement value — above best-in-class range |
2–3% target achievable within 12–18 months |
| Advance warning before failure |
Zero — failure discovered after production stops |
30–90 days advance detection on critical assets |
| PM compliance rate |
Below 60% — reactive backlog crowds out scheduled work |
98.5% compliance documented at OxMaint-deployed plants |
| AI-detected failure cost |
Reactive identification after failure — full cascade cost |
73% lower repair cost — AI-detected vs reactive identification |
Scroll right to view full comparison on mobile
Frequently Asked Questions — Predictive vs Reactive Maintenance Cost Analysis
OxMaint · Cement Plant · Predictive vs Reactive Cost Analysis · CMMS
Every month your cement plant runs on reactive maintenance, it is paying 5–8× more per repair than it needs to. OxMaint converts that premium into a predictive system that prevents the failures before they generate any cost at all.
Failure cost audit. Asset criticality ranking. IoT sensor deployment. AI prediction. Planned maintenance scheduling. Reactive spend reduction — tracked and reported automatically every month.