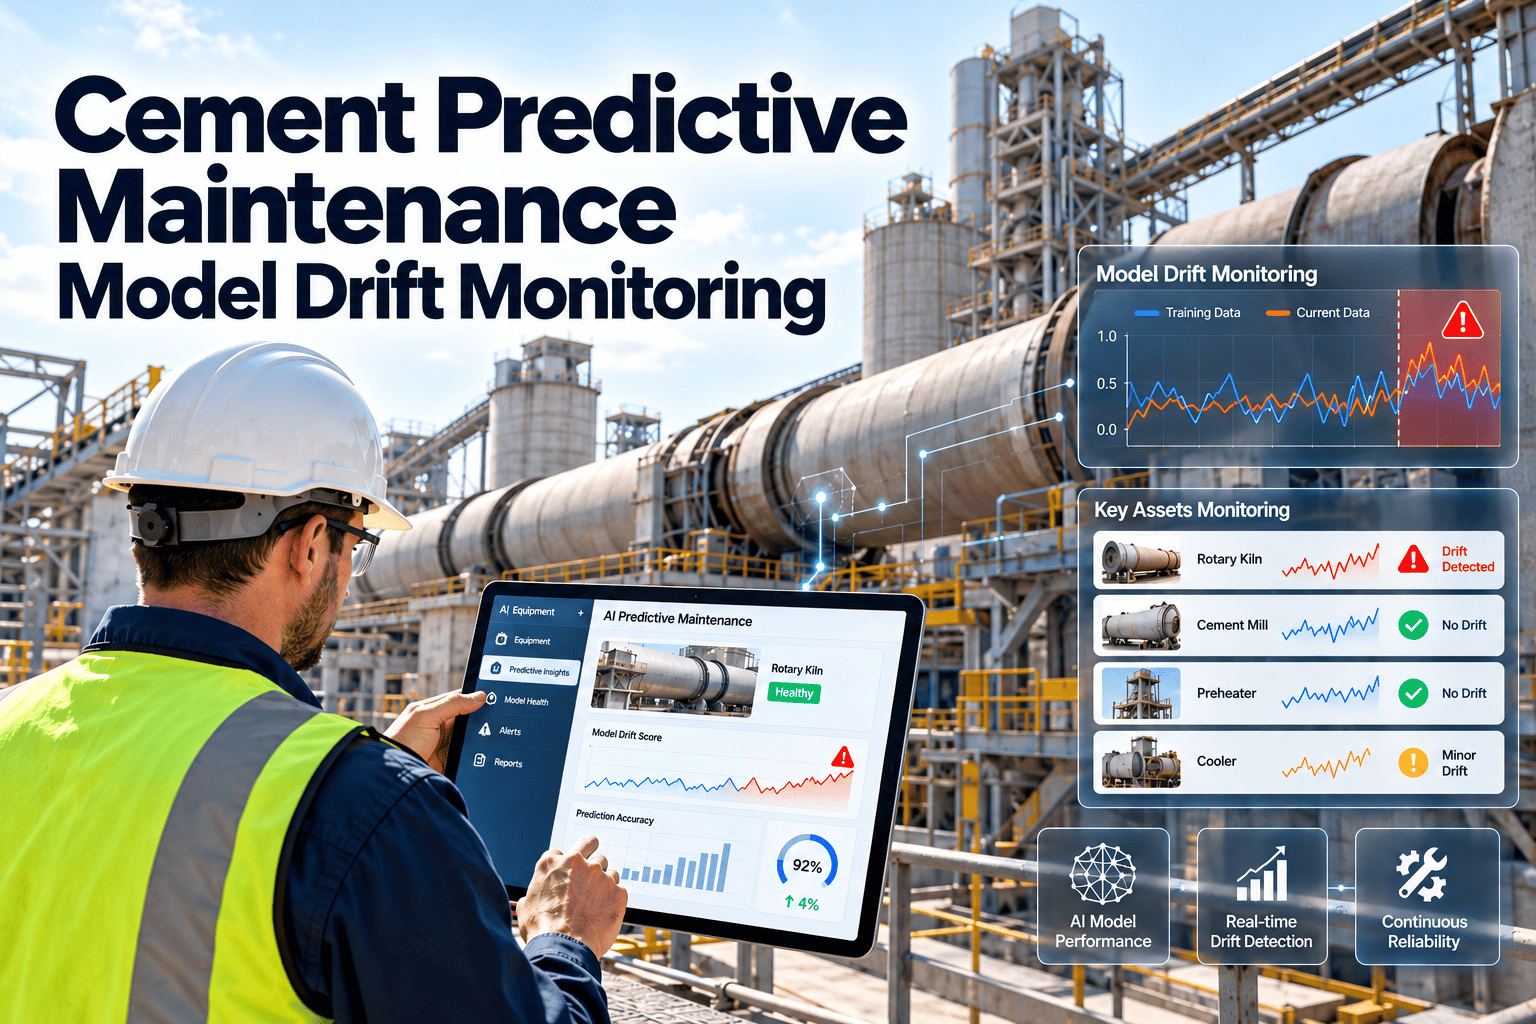
A predictive maintenance model that worked well on commissioning day can quietly lose accuracy as a cement plant changes around it. Raw material hardness shifts, alternative fuels alter kiln conditions, a vibration sensor is replaced and a mill gets new liners. The model keeps issuing scores, but they no longer match the equipment it was trained on. Model drift monitoring catches that gap before alerts become noise or, worse, silence. For teams tying predictions to action, a maintenance management platform supplies the work history a model needs to stay honest.
Cement Predictive Maintenance Model Drift Monitoring
Keep failure predictions on kilns, mills, fans and gearboxes reliable by watching the data, the model and the maintenance outcomes together.
Plant data
Model score
Alert and work order
Technician finding
Drift check and retrain
A model does not fail, the plant moves away from it
In cement, the process is rarely static. The following timeline shows how a once-reliable model can slowly lose touch with the equipment.
Month 0: trained and validated
The model learns normal vibration, temperature, current and load patterns from historical data and known failures.
Month 3: the process changes
A new raw mix, a higher share of alternative fuels or a different production target moves the operating range.
Month 5: maintenance resets the baseline
A bearing replacement or realignment changes vibration levels. The model reads normal behaviour as abnormal.
Month 7: trust erodes
False alerts rise, technicians stop checking them, and a true warning is missed.
Three kinds of drift to monitor
Input
Data drift
The statistical spread of sensor inputs changes, for example a mill motor now runs at a different load range after a production change.
Relationship
Concept drift
The link between signals and failure changes. A vibration level that once preceded a bearing fault may now be harmless, or the reverse.
Outcome
Label drift
The way failures are recorded changes, such as new failure codes or a different definition of what counts as a fault.
Cement-specific causes of drift
Generic machine learning guidance rarely covers the conditions of a cement plant. These are the sources of change that plant teams should log.
| Source of change | Equipment affected | What may shift |
|---|---|---|
| Raw material hardness and moisture | Crushers, raw mills, mill fans | Motor current, vibration, differential pressure |
| Fuel mix and alternative fuels | Kiln, preheater, ID fan, coolers | Temperature profiles, draught, fan load |
| Liner, roller and refractory wear | Mills, kiln shell, cyclones | Power draw, shell temperature, throughput |
| Sensor replacement or recalibration | All monitored assets | Signal range, noise and offset |
| Seasonal ambient conditions | Fans, coolers, drives, bearings | Temperature and cooling behaviour |
| Equipment upgrade or retrofit | Drives, gearboxes, fans | Normal operating envelope |
| Maintenance actions | Any serviced component | Post-repair baseline |
Connect predictions to maintenance outcomes
Drift monitoring needs reliable work order and inspection history. See how that record can be kept in one place.
What to measure to detect drift
Input-side checks
- Compare recent distributions of key signals against the training period using measures such as population stability index or Kolmogorov-Smirnov tests.
- Track missing data, flatlines, spikes and unit changes that suggest instrument problems rather than equipment problems.
- Monitor operating mode share, such as time at low load, start-up or stoppage, so the model is not judged outside its training range.
Model-side checks
- Watch the distribution of anomaly scores or health indices for gradual upward or downward creep.
- Review residuals between predicted and actual values for models that forecast temperature or vibration.
- Check score stability on assets that have just been serviced.
Outcome-side checks
- Precision: of the alerts raised, how many led to a confirmed finding on inspection.
- Recall: of the confirmed failures, how many received an earlier alert.
- Warning time: days between the first alert and the failure or planned repair.
- Acknowledgement rate: how many alerts technicians act on, which signals fading trust.
Healthy model versus drifting model
Healthy signs
- Alert volume is steady across weeks.
- Most alerts end with a documented finding.
- Scores return to normal after a repair.
- Feature distributions overlap with training data.
Drift warning signs
- Sudden jump or fall in alert count.
- Many alerts closed as no fault found.
- Scores stay high after a successful repair.
- A new fuel or sensor type has no data in the training set.
A drift response workflow
1
Detect
A monitor flags a shift in input data, scores or alert quality on a given asset or asset class.
2
Check for a known cause
Search recent work orders and change logs for sensor swaps, repairs, process trials or fuel changes.
3
Classify
Decide whether it is an instrument fault, a legitimate new operating regime or a real equipment change.
4
Act
Fix the sensor, add a new baseline, retrain on recent data or retire the model for that asset.
5
Validate
Back-test against recent confirmed events before returning the model to service.
6
Record
Log what changed, who approved it and the resulting performance, so audits are straightforward.
Retraining triggers that avoid constant rework
Retraining on a fixed calendar is easy to schedule, but it can waste effort or miss sudden changes. Combining calendar and event triggers is more practical.
- Event trigger: a major overhaul, equipment replacement, fuel strategy change or new instrument installation.
- Performance trigger: precision or recall falls below the agreed threshold for a defined period.
- Data trigger: drift statistics exceed limits on several key inputs at once.
- Calendar trigger: a periodic review, often after each kiln campaign or annual shutdown.
Keep human judgment in the loop
Reliability engineers should approve model changes on critical assets. A retrained model that accepts a developing fault as the new normal is a real risk, so every retraining should be checked against known failure history.
Why maintenance records are the foundation
Drift monitoring is only as good as its labels. Without clean records of what was found and fixed, there is no way to know whether an alert was right.
Failure codes
Use a consistent list of failure modes, causes and actions on every work order.
Inspection findings
Record condition results and photos against the asset so they can be matched with alerts.
Change history
Capture component replacements, sensor changes and settings changes with dates.
Alert outcomes
Mark each alert as confirmed, no fault found, or deferred, with a note.
How Oxmaint maintenance management software supports the loop
- Asset management holds equipment hierarchy, component history and replacements.
- Work orders capture failure codes, actions, parts and labour for each event.
- Mobile inspections record findings in the field with consistent checklists.
- Corrective and preventive workflows turn alerts into scheduled, tracked work.
- Reporting shows alert outcomes and repeat failures that feed model reviews.
Oxmaint is the maintenance record system in this loop. Analytical modelling and drift statistics are normally handled by the plant's data tools, so integration and data quality matter.
Governance checklist for predictive models
- Each model has a named owner, a purpose and a list of assets it covers.
- Training data period and known limitations are documented.
- Drift metrics and alert quality are reviewed on a regular schedule.
- Sensor changes and calibration events are logged before model scores are trusted.
- Retraining and rollback decisions are approved and recorded.
- Technicians have a simple way to flag false or missed alerts.
Drift considerations by equipment class
Different machines drift for different reasons. Monitoring plans should reflect that rather than apply one rule everywhere.
| Equipment class | Typical signals | Drift watch point |
|---|---|---|
| Kiln drive and support rollers | Motor current, bearing temperature, vibration, shell temperature | Changes after alignment work, refractory changes and speed changes |
| Raw and cement mills | Motor power, vibration, differential pressure, bearing temperature | Liner and roller wear, grinding media changes and feed variation |
| ID and process fans | Vibration, bearing temperature, motor current, draught | Dust build-up, damper settings and fuel mix changes |
| Clinker cooler | Fan current, pressure, grate drive load, hydraulic pressure | Clinker size changes and grate plate wear |
| Gearboxes | Vibration, oil temperature, oil analysis results | Oil changes, load profile changes and component replacement |
Illustrative scenario: a sensor swap on a process fan
This hypothetical example shows the reasoning, not a real plant result.
Without change records
- A vibration sensor is replaced and reads higher at the same fan condition.
- The model flags a developing bearing fault.
- Technicians inspect and find nothing.
- The team concludes the model is unreliable and starts to ignore it.
With change records
- The sensor replacement is logged on the asset with a date.
- The drift monitor shows a step change on that date.
- The reliability engineer re-baselines the signal.
- The model keeps its credibility and the true fault signals stay visible.
Avoiding alert fatigue while watching for drift
Every false alert costs inspection time and attention. Drift monitoring should reduce that burden, not add another stream of warnings.
- Group drift notifications by asset class so one process change does not generate dozens of messages.
- Rank alerts by asset criticality, so the kiln drive receives attention before a low-risk conveyor.
- Offer technicians a fast way to close alerts with a reason code, which becomes useful training feedback.
- Review the alerts closed as no fault found each month to see whether thresholds need adjustment.
- Pause or flag models during planned process trials so expected changes do not look like faults.
Who owns what in a drift monitoring programme
Reliability engineer
Owns model approval for critical assets, reviews drift reports and decides when to retrain.
Process and control engineer
Reports operating changes such as fuel strategy, raw mix and instrument replacements.
Maintenance planner
Makes sure alert-driven work orders are scheduled and closed with proper codes.
Technician
Records findings honestly, including no fault found, so the labels are meaningful.
Data quality prerequisites for reliable monitoring
Drift statistics cannot tell the difference between a real process change and a bad data feed unless the basics are in place.
- Tags are mapped to assets and components, with engineering units and ranges documented.
- Time stamps are synchronised across systems, so a vibration trend can be compared with a repair date.
- Calibration and sensor replacement events are logged with a date and the person responsible.
- Operating mode is captured, such as running, start-up, stopped or reduced load, so comparisons are fair.
- Raw material, fuel and production target changes are recorded in a shared log.
- Work order data uses consistent asset names and failure codes.
Metrics dashboard for model health
Alert precision
Confirmed findings divided by alerts raised, reviewed monthly by asset class.
Missed failure review
Every unplanned failure is checked to see whether the model gave any prior signal.
Lead time to action
Time between alert and work order creation, and between work order and completion.
Data health score
Share of expected signals arriving with valid values and expected ranges.
Drift events open
Count of unresolved drift flags, with owner and age.
Common mistakes in drift monitoring
- Retraining on data that includes a developing fault, so the model learns that fault as normal.
- Watching only model accuracy and ignoring input data quality.
- Applying one drift threshold to every asset regardless of how variable its normal operation is.
- Failing to inform the data team when the plant changes fuel, raw mix or instruments.
- Closing alerts without a reason, which removes the labels that monitoring needs.
Starting small: a drift monitoring pilot
There is no need to monitor every model on day one. A focused pilot builds the habits and the records that wider coverage will need.
1
Pick two or three assets
Choose machines with good sensor coverage, a clear downtime cost and reasonable failure history, such as a main fan or mill drive.
2
Define baselines
Record normal ranges by operating mode and agree on the signals that matter for each asset.
3
Log every change
Capture repairs, sensor work and process changes on the asset record from the first day.
4
Review monthly
Compare alerts with technician findings and decide whether thresholds or models need attention.
Documenting model changes for audits and handovers
Plants change staff, suppliers and tools over time. A short model record keeps knowledge from leaving with one person.
- Purpose of the model, the assets it covers and the failure modes it targets.
- Training data period, signals used and known gaps or limitations.
- Thresholds, alert routing and the person who responds to each alert.
- History of drift events, causes found and actions taken.
- Dates and reasons for every retraining, rollback or retirement.
Key takeaway for reliability teams
Treat every predictive model as a living asset that needs its own inspection routine. Watch the inputs, check the alerts against technician findings, record every change on the equipment and retrain only with approval. Plants that keep this loop running protect both the accuracy of their predictions and the confidence of the crews who rely on them.
Frequently asked questions
What is model drift in predictive maintenance?
It is the loss of model accuracy as equipment, process or data conditions move away from what the model learned.
How can I tell if a sensor change caused it?
Compare the drift date with sensor and work order records in your maintenance system.
How often should drift be checked?
Check continuously where possible, and review alert quality at least monthly on critical assets.
Is retraining always the answer?
No. Sometimes the fix is a faulty sensor or a new baseline, not a new model.
Can we review our process together?
Yes, book a demo to discuss workflows.
Keep predictions tied to what technicians actually find
Build a maintenance record that gives your models trustworthy feedback and your teams a clear response to every alert.