In delivery operations, a vehicle that is available is revenue and a vehicle sitting in the bay is a missed route. Yet most fleet managers still reconstruct maintenance performance from spreadsheets that are two weeks out of date, telematics in one browser tab, and work-order logs in another. By the time a problem surfaces in a monthly report, it has already cost deliveries, overtime, and customer trust. A custom maintenance dashboard collapses all of that into one live screen — fleet uptime, hub readiness, open work orders, and cost trends, refreshed as the work actually happens. Sign up for OxMaint to build the operational view your delivery business actually runs on.
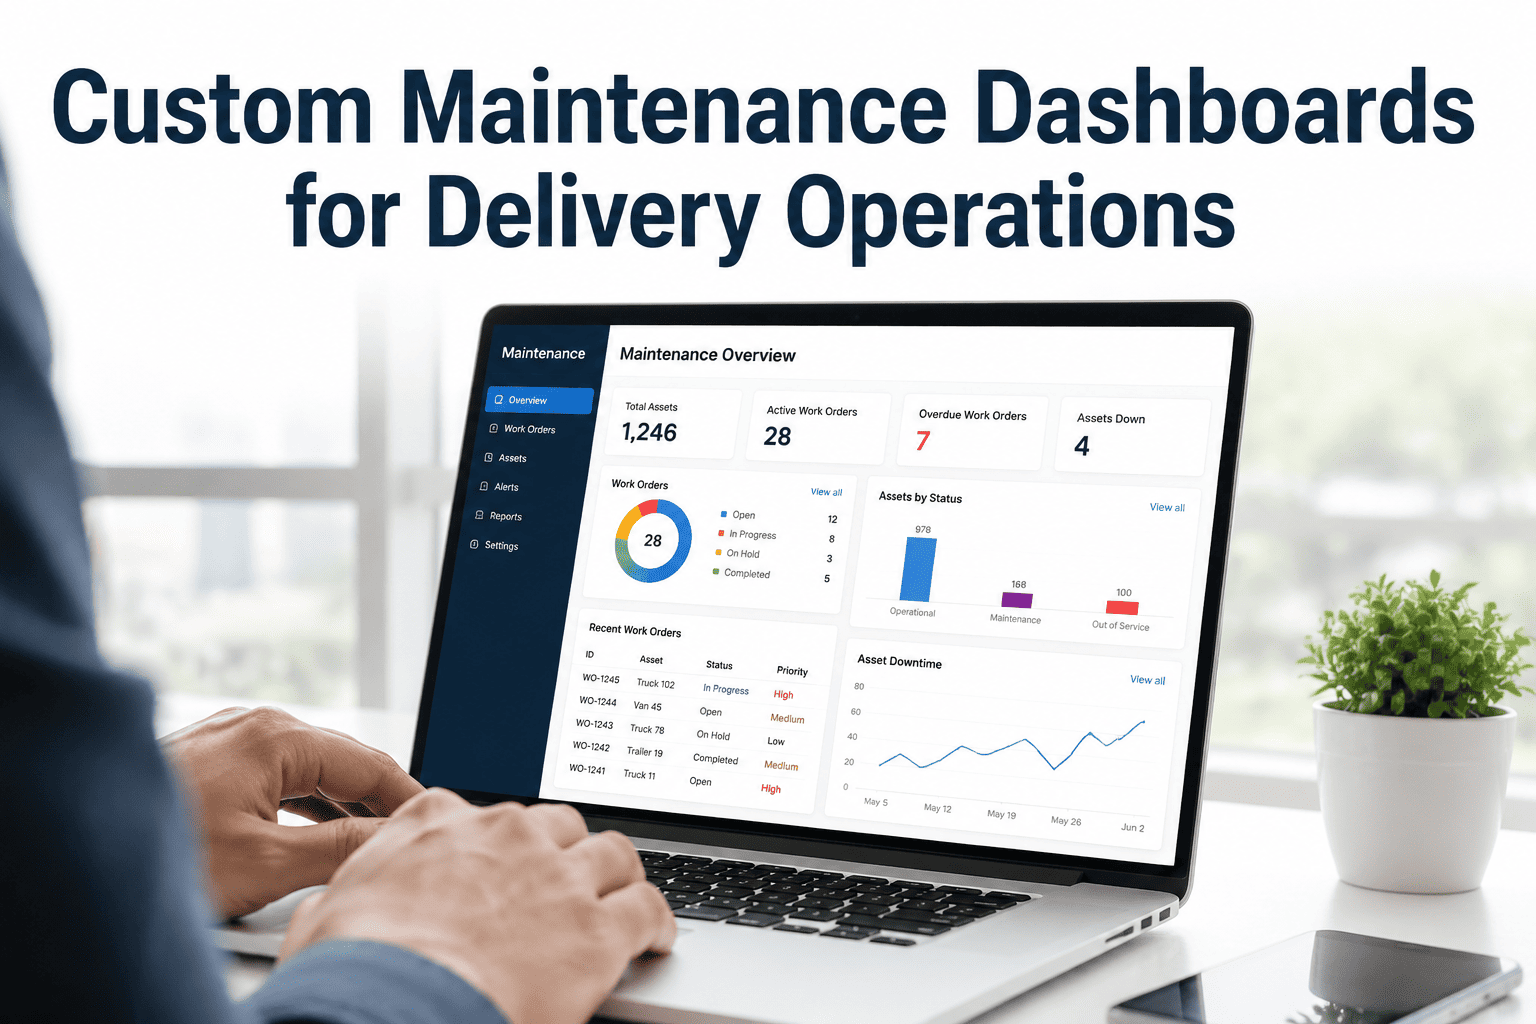
Custom Maintenance Dashboards for Delivery Operations
Visualize fleet uptime, hub readiness, open work orders, and cost trends in real time — built into role-based views for dispatchers, fleet managers, finance, and executives.
When the Spreadsheet Becomes the Dashboard
Delivery maintenance data is rarely missing — it is scattered. Telematics knows engine hours, the workshop knows open repairs, finance knows the spend, and nobody sees them together until month-end. That gap is where uptime and margin quietly leak away.
of total shipping cost lands in the last mile — the exact leg where a single mid-route breakdown can erase an entire day of stops.
is how stale a typical monthly maintenance report is by the time it reaches the manager who needs to act on it.
more expensive a reactive roadside repair runs versus the same job planned — emergency parts, overtime, towing, and lost routes stacked on top.
planned-to-reactive ratio most fleets run blind, when the top-quartile target is closer to 80:20 — a gap no spreadsheet flags in time.
One Operation, Four Lenses
A dispatcher and a CFO do not need the same screen. OxMaint builds role-based dashboards so every team opens straight to the numbers that drive their decisions — same live data, four different views. Book a demo to see your roles mapped.
Hub Readiness View
Which vehicles are cleared for dispatch this morning, which are in the bay, and which pre-trip inspections are still open. Hub readiness at a glance before the first route rolls out.
- Cleared vs grounded vehicles
- Open inspection defects
- PM due before next shift
Maintenance Health View
Open work orders by priority, PM compliance by depot, MTBF and MTTR trends, and the vehicles drifting toward unplanned downtime before they actually fail.
- Work-order backlog by priority
- PM compliance per depot
- MTBF and MTTR trend lines
Cost Control View
Cost per mile by vehicle, planned-versus-reactive spend split, parts and labour totals, and budget-versus-actual — recalculated automatically as work orders close.
- Cost per mile by vehicle
- Planned vs reactive spend
- Budget vs actual tracking
Operations Roll-Up View
Fleet uptime, total maintenance spend, cost trend month over month, and a green, amber, and red status summary across every hub condensed onto one screen.
- Fleet-wide uptime percentage
- Spend trend month over month
- Status roll-up by hub
Stop rebuilding the same report every month. Give every team a live view of the numbers that decide whether the next route goes out on time.
Four Live Metric Categories on Every Dashboard
High-performing delivery fleets do not track one number — they watch four connected categories at once, because a utilization problem is often a maintenance problem wearing a different label. OxMaint computes all four from live data, no manual entry.
Cost per mile by vehicle, fuel spend per route, maintenance cost per vehicle, emergency-parts ratio, and the planned-versus-reactive cost split — all from work orders, fuel logs, and parts invoices.
Vehicle utilization rate, on-time delivery rate per route, idle-time percentage, route efficiency, and fleet availability — connected to telematics for live updates as routes run.
PM compliance rate, mean time between failures, mean time to repair, work-order backlog, and overdue preventive jobs — the early-warning layer that predicts cost spikes before they hit.
Inspection completion rate, roadside pass rate, defect rate by vehicle, and expiry alerts for statutory inspections — surfaced before a missed date becomes a compliance violation.
Static Report vs Live Dashboard
The difference is not cosmetic. A static report tells you where the fleet was; a live dashboard tells you where it is heading while there is still time to change the outcome.
| Dimension | Spreadsheet / Static Report | OxMaint Live Dashboard |
|---|---|---|
| Data freshness | Compiled weekly or monthly, already dated | Recalculated as each work order closes |
| Effort to produce | Hours of manual pulls from multiple systems | Generated automatically from live data |
| Visibility | One analyst's view, shared after the fact | Role-based views for every team, on demand |
| Alerting | None — problems found when someone notices | Automatic alert when a KPI drifts off target |
| Drill-down | Re-build the sheet to answer a new question | Fleet to depot to vehicle in a few taps |
| Decision speed | Reactive — act after the cost is incurred | Proactive — act before the route is lost |
The Gap Between Average and Top-Quartile
Benchmarks only matter when you can see your own number beside them. These are the bands top delivery fleets track as standard — and the distance most operations do not realize they are carrying.
Each 10% shift from reactive toward planned maintenance typically trims total maintenance cost by 6-8% — a move only visible when the dashboard tracks the split for you.
See your fleet's live availability, PM compliance, and cost per mile against these benchmarks — your first dashboard can be built in a single session.
From Connected Data to Decisions in Four Steps
A dashboard is only useful if it builds fast and stays current on its own. OxMaint takes a delivery operation from scattered records to a live, role-based view without a long implementation project.
Connect
Telematics and OBD data, work orders, fuel logs, and parts invoices flow into one place — no more pulling from three systems to build one number.
Configure
Choose the KPIs that matter, set targets and benchmark bands, and lay out role-based views for dispatch, maintenance, finance, and leadership.
Automate
Every metric recalculates as work orders close, and alerts push to a manager's phone the moment a KPI drifts outside its target range.
Act
AI highlights what changed since yesterday and what to do next, so the dashboard drives decisions instead of just displaying them.
Before this, I pulled cost data from three systems every month to build a report that was always two weeks out of date. Now the dashboard updates in real time as work orders close — and we found two depots running PM compliance at 71%, a problem we had carried for eighteen months without knowing it.
Fleet Operations Manager, National Distribution Fleet
Frequently Asked Questions
Turn Scattered Maintenance Data Into One Live View
From hub readiness to cost per mile, OxMaint pulls maintenance records, telematics, fuel logs, and work orders into custom dashboards that update in real time — so every delivery decision is made on current numbers, not last month's spreadsheet.