When a delivery van goes down, the repair invoice is only the part of the cost that arrives on paper. The rest spreads quietly through overtime, rented replacements, credits to customers, idle drivers and lost future orders. Because those costs sit in different budgets, nobody adds them up, and prevention looks optional until a bad month proves otherwise. Measuring the full cost of delivery fleet downtime gives you a number you can defend in a budget meeting. Teams can track downtime and repair history in Oxmaint to build that number from their own records.
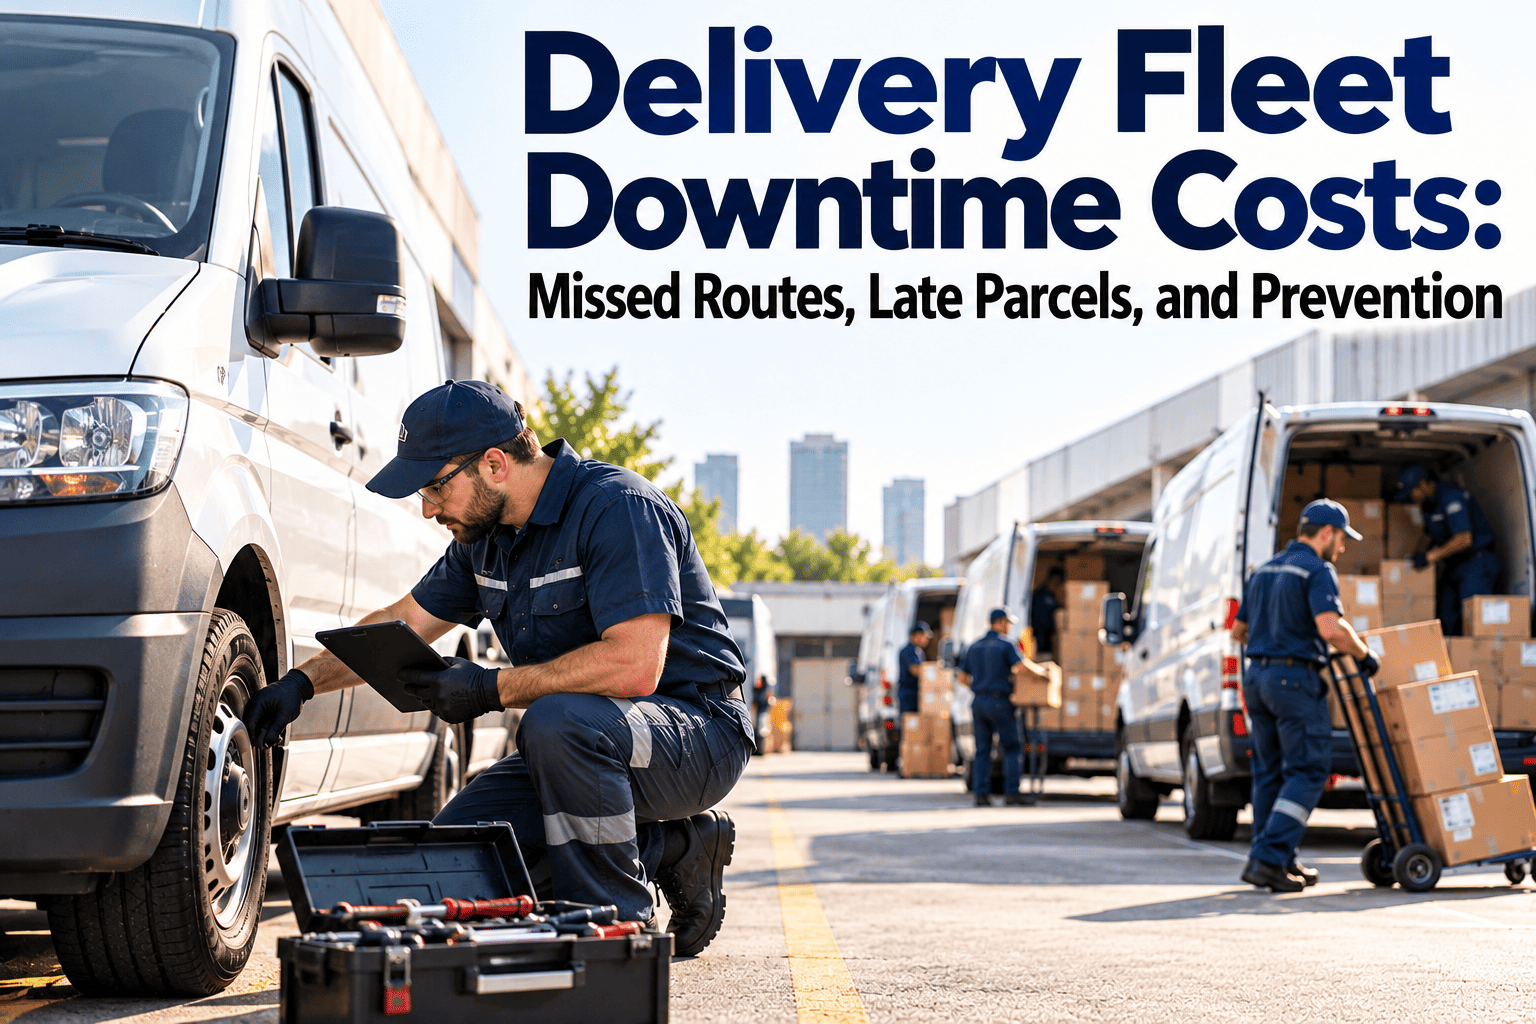
Delivery Fleet Downtime Costs: Missed Routes, Late Parcels, and Prevention
See the whole cost of a van that is not rolling, from the tow bill to the customer who stops ordering, and use it to fund prevention.
Visible Costs vs Hidden Costs
Most fleets track the first column carefully and the second barely at all. Yet the second column is often the larger one.
| Cost Type | Where It Shows Up | Usually Tracked? |
|---|---|---|
| Repair labor and parts | Maintenance budget | Yes |
| Towing and roadside service | Maintenance or operations | Usually |
| Rental or substitute vehicle | Operations or purchasing | Sometimes |
| Overtime for covering drivers | Payroll | Rarely linked to the breakdown |
| Paid time of a stranded driver | Payroll | Rarely |
| Service level penalties | Commercial or finance | Rarely linked |
| Customer credits and refunds | Customer service | Rarely linked |
| Re-delivery attempts | Operations | Rarely |
| Lost future orders | Sales | Almost never |
| Dispatcher and manager time | Overhead | Never |
The goal is not perfect accuracy. A reasonable, documented estimate of the hidden column changes the conversation about prevention.
How One Hour of Downtime Spreads
Downtime costs grow in stages. The longer a van is out, the more of the day's plan it breaks.
Duration matters more than cause
A one-hour roadside fix and a three-day parts wait can start from the same fault. Shortening the wait for parts, bays and approvals often saves more than reducing the number of faults.
Building Your Cost Per Downtime Hour
A simple model gives a repeatable figure. Build it from components you can source, then refine it each quarter.
Choose conservative inputs and write down your assumptions. A modest estimate that finance trusts is worth more than a large one they question.
Where to Find Each Input
Most of the data already exists. It is simply scattered across departments.
| Input | Likely Source | Owner |
|---|---|---|
| Hours and dates of downtime | Maintenance work orders and dispatch logs | Maintenance |
| Route value per hour | Finance or operations reporting | Operations |
| Rental and substitute costs | Purchasing invoices | Purchasing |
| Overtime and idle time | Payroll and timekeeping | HR or payroll |
| Penalties and credits | Commercial contracts and customer service records | Commercial |
| Repair and towing costs | Work order cost records | Maintenance |
Put a Real Number on Every Hour Your Vans Are Down
Oxmaint records downtime, repair costs and vehicle history in one place, giving you the foundation for a defensible cost analysis.
Where Downtime Hours Actually Go
Repair work is often the smallest share of a van's time out of service. Most hours are spent waiting, and waiting can be managed.
Time stamps unlock the answer
Record when each stage starts and ends on the work order. After a month of data, the biggest wait is usually obvious, and so is the cheapest fix.
Reactive Fleet vs Prevention-Led Fleet
The two fleets may own the same vans. What differs is how often they pay the hidden costs.
- Downtime is a surprise most weeks
- Repairs wait on parts and approvals
- Rentals and overtime fill the gaps
- Hidden costs are never added up
- Prevention competes poorly for budget
- Most downtime is planned and scheduled
- Parts and bays are ready before vans arrive
- Spare capacity is sized from data
- Full event cost is tracked and reported
- Prevention is funded from measured savings
Making the Business Case for Prevention
Finance responds to evidence, not slogans. Present downtime as a cost the business already pays, then show how prevention reduces it.
Avoid promising a specific percentage reduction before you have a baseline. Credible commitments come from your own data.
Levers That Raise Uptime
Each lever below reduces either how often vans fail or how long they stay down.
PM compliance
Defect triage
Parts availability
Smart scheduling
Spare capacity
Root cause review
Measures That Keep Downtime Visible
Report these figures monthly to operations and finance, so downtime stays on the agenda.
Frequently Asked Questions
What is included in the cost of delivery fleet downtime?
How do I calculate cost per downtime hour?
Why is waiting time so important?
How can I justify prevention spending to finance?
How does Oxmaint help reduce downtime?
Stop Paying for Downtime You Never Added Up
Track downtime by cause, plan the work that prevents it and show the savings with records your finance team can trust.