Most delivery operations know their maintenance budget to the dollar and still have no idea where it actually goes. The number on the monthly report is real, but it hides three quiet leaks — the same repairs done over and over, a handful of vehicles quietly bleeding the budget, and a layer of waste that never appears on an invoice at all. Cutting maintenance cost is rarely about spending less on each job; it is about seeing which spend is working and which is pure loss. Sign up for OxMaint to find the leaks before the next budget cycle does.
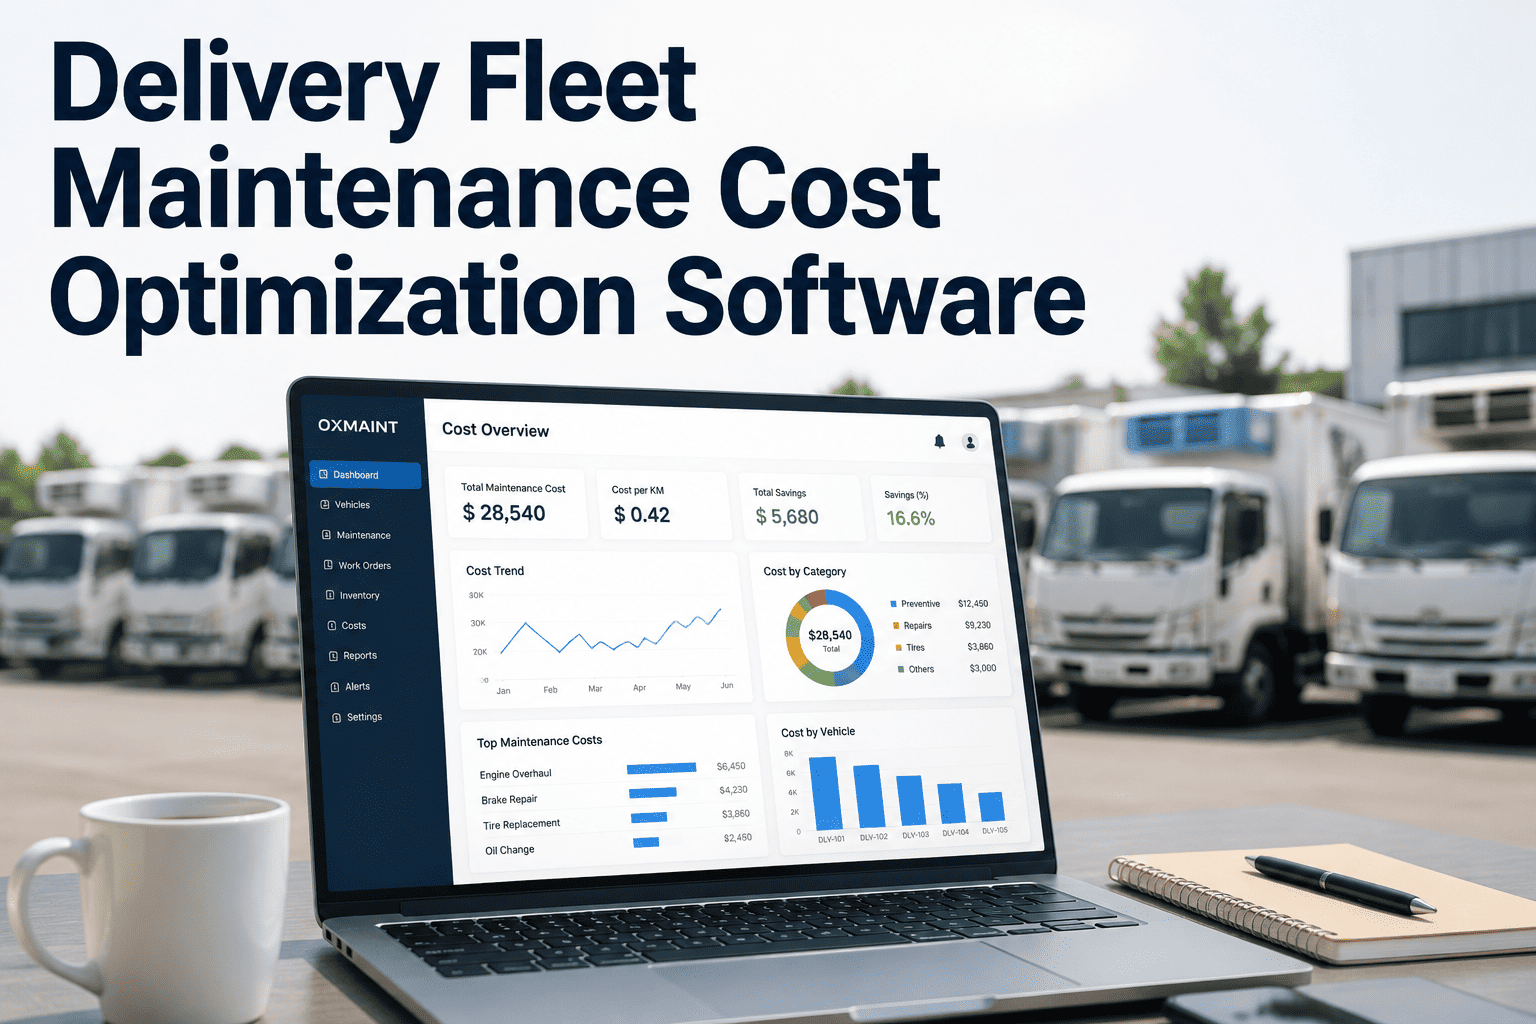
Delivery Fleet Maintenance Cost Optimization Software
Surface repeat repairs, expensive assets, and hidden waste in your maintenance spend — and turn cost-per-vehicle data into decisions that protect your margin.
Three Places Your Budget Leaks
Maintenance overspend almost always traces back to the same three sources. Most fleets cannot see any of them clearly, because the data sits in invoices and spreadsheets instead of a per-vehicle cost record.
Repeat Repairs
The same fault fixed again and again. Cheap parts and unaddressed root causes turn one repair into three — and nobody notices because each shows up as a fresh ticket, not a pattern.
Hidden as separate work ordersExpensive Assets
A small group of vehicles eats a huge share of the budget. Units over ten years old drive just 12% of the miles but consume a third of total maintenance spend, often worth less than the repairs poured into them.
Hidden by fleet-wide averagesHidden Waste
Emergency parts carry a 15-30% premium, towing and overtime stack onto every breakdown, and an idle van still costs $8,000-$14,000 a year to keep. None of it lands on the repair invoice.
Hidden off the invoice entirelyThe True Cost of Maintenance Is an Iceberg
Direct repair invoices are only the visible tip. Fleets that budget on invoices alone underestimate their real spend by a third or more — and keep aging vehicles far past the point where replacing them would have been cheaper.
You cannot cut a cost you cannot see. OxMaint captures every dollar — visible and hidden — against the vehicle that spent it, so the leaks finally have a name.
When a Repair Is Not Really a Repair
A fault that comes back is not a fixed problem — it is a recurring cost wearing a new work-order number. OxMaint links every job to the vehicle and the component it touched, so the moment the same failure returns, it surfaces as a pattern instead of a fresh expense.
Cheap part fitted, root cause missed. The vehicle goes back out.
Same fault, weeks later. Logged as a new ticket — cost doubles unnoticed.
Recurrence detected by component. Root cause and part quality reviewed once, not paid for three times.
Keep It or Replace It — Decided by Data
The signal to replace a vehicle is not its age — it is its cost trend. Two rules settle most cases: replace when annual upkeep passes 30% of the vehicle's residual value, or when cost per mile climbs past its lifetime low. The oldest vehicles make the case loudly.
The Cost Levers — and What They Return
Cost optimization is not one big move; it is a handful of levers, each with a known payback. OxMaint supplies the data that makes every one of them actionable.
| Cost Lever | Typical Return | How OxMaint Enables It |
|---|---|---|
| Shift reactive to planned PM | 25-35% lower total cost | Auto PM scheduling and a live planned-vs-reactive split |
| Plan parts procurement | 15-30% premium avoided | Work orders give 10-14 days of purchasing lead time |
| Consolidate parts volume | 8-15% supplier discount | Fleet-wide demand grouped instead of one unit at a time |
| Kill repeat repairs | Fewer recurring jobs | Fault recurrence flagged by vehicle and component |
| Right-size the fleet | $8-14K per idle vehicle | Utilization data exposes under-used assets |
| Replace at the right time | 15-20% lower TCO | Cost-per-mile trend and residual-value threshold alerts |
CMMS-driven cost programs typically pay for themselves in four to eight months. See which levers your fleet is leaving on the table.
How OxMaint Turns Spend Into Savings
Every cost decision needs the same foundation: accurate, per-vehicle data captured the moment work is done. OxMaint builds that record automatically and turns it into the four signals that drive savings. Sign up free to start tracking your first vehicle.
Per-Vehicle Cost Tracking
Labour hours, parts, and vendor invoices captured at work-order close — rolled into cost per mile and cost per vehicle, with no manual spreadsheet pulls.
Repeat-Fault Detection
Recurring failures flagged by component and vehicle, so a chronic problem is solved once at the root instead of being paid for repeatedly.
Planned Procurement
Reorders triggered with real lead time and consolidated across the fleet — converting emergency-rate purchases into planned, discounted ones.
Replacement Signals
Cost-per-mile trends and residual-value thresholds flag the exact point where keeping a vehicle costs more than replacing it.
We assumed our maintenance budget was just the cost of doing business. Once every job was tied to a vehicle, three vans stood out immediately — we were spending more repairing them each year than they were worth. Replacing them paid for the whole platform in months.
Operations Director, Regional Delivery Fleet
Frequently Asked Questions
Stop Paying for Waste You Cannot See
OxMaint captures every maintenance dollar against the vehicle that spent it, flags repeat repairs and money-losing assets, exposes the hidden costs your invoices miss, and tells you exactly when to replace — turning your maintenance budget from a black box into a controllable, optimized line on the books.