A warehouse in Atlanta was running a textbook preventive maintenance programme — oil changes every 250 hours, belt inspections every 30 days, conveyor lubrication on the first Monday of each month. It was disciplined, documented, and still suffering 18 unplanned stoppages per quarter. The calendar said everything was on schedule. The conveyor drives, the dock levellers, and the pallet jack chargers had other plans. The gap between when a PM was completed and when a failure actually occurred was invisible — because preventive maintenance answers the question "when was this last serviced?" but never asks "what condition is it in right now?" That question is what predictive maintenance answers. A CMMS like OxMaint supports both strategies, but the warehouses closing that gap fastest are the ones layering condition-based triggers onto their PM foundation — not replacing it, but making it intelligent. If your planned-to-unplanned maintenance ratio is under 70:30, your strategy is worth examining. Book a 30-minute demo to see how OxMaint structures both strategies for warehouse operations.
Warehouse Maintenance Strategy
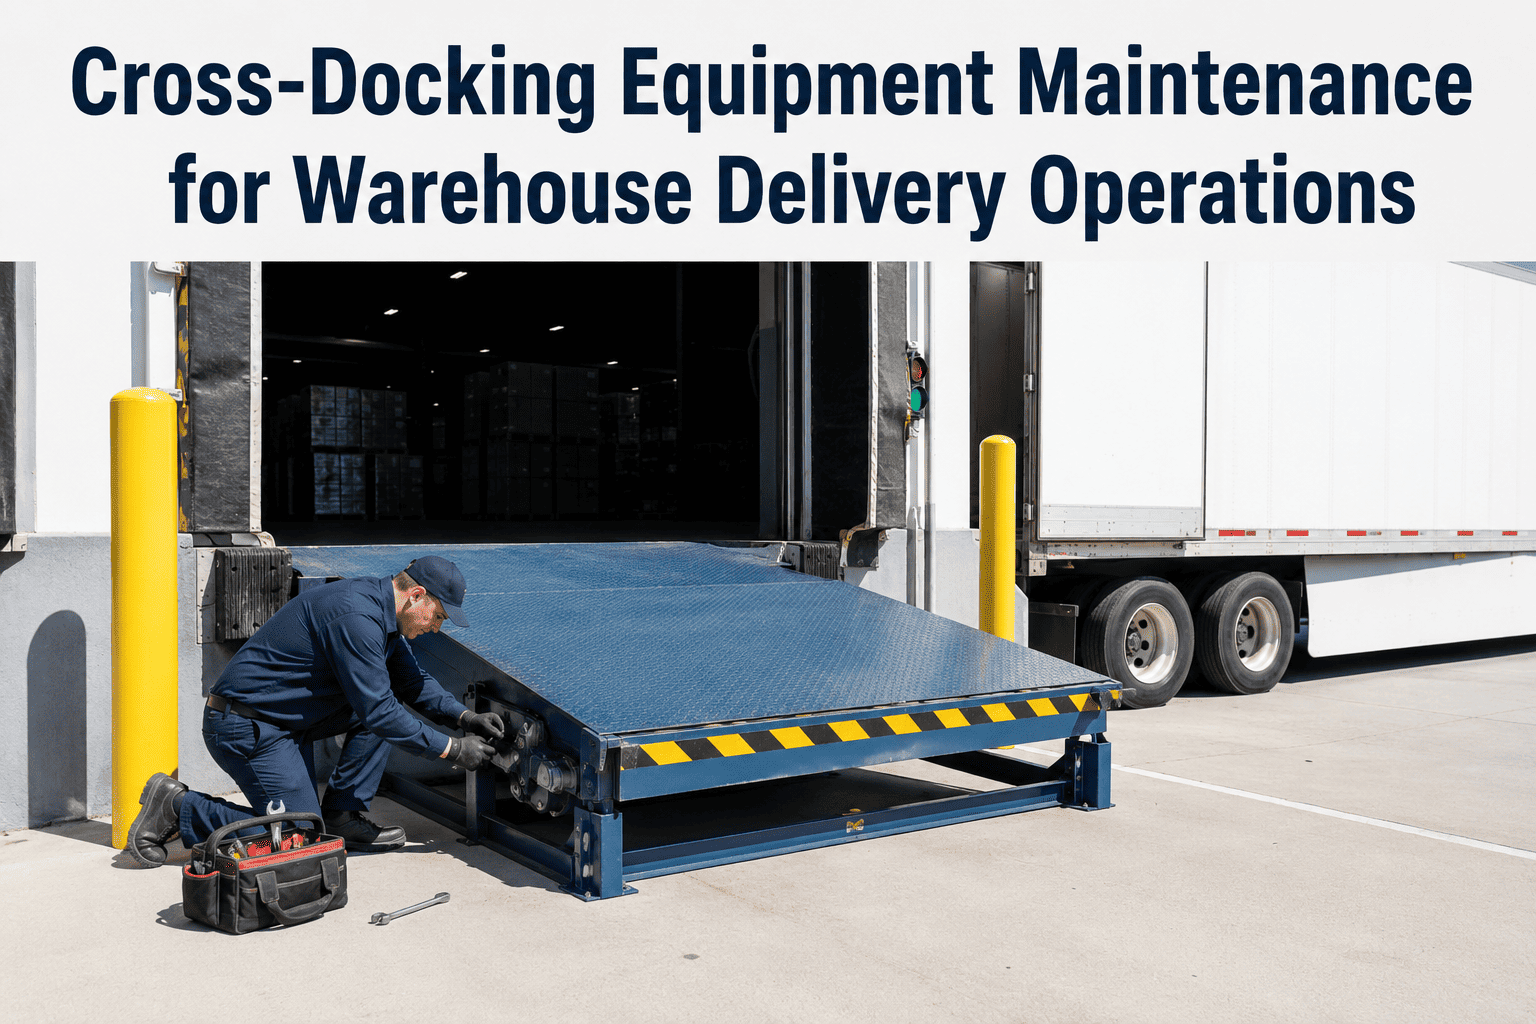
Predictive vs Preventive Maintenance for Warehouse Delivery Operations
Calendar-based PM misses the failures that sensor data catches 4–8 weeks earlier. Here is the real performance gap, the cost difference, and the hybrid strategy that leading delivery hubs are using in 2025 — built around a CMMS that supports both.
25–40%
Maintenance cost reduction with predictive vs calendar-based PM
30%
Of preventive maintenance tasks are unnecessary (IBM research)
95%
Of predictive maintenance adopters report positive ROI
3–5x
Higher cost of reactive repair vs planned preventive maintenance
The Core Difference — How Each Strategy Decides When to Act
The strategic divide between preventive and predictive maintenance comes down to a single question: does your maintenance programme respond to time, or to condition? That distinction determines your downtime exposure, your parts spend, your labour allocation, and your planned-to-unplanned ratio.
Preventive Maintenance
Acts on schedule
Trigger
Fixed calendar or meter interval
Data used
Time elapsed, hours run, distance
Failure detection
None — prevents by frequency
Over-maintenance risk
High — up to 30% tasks unneeded
Under-maintenance risk
Moderate — interval-gap failures
Implementation cost
Low — CMMS + schedule
Best for
Known wear patterns, fluid/filter cycles, safety compliance tasks
Predictive Maintenance
Acts on condition
Trigger
Sensor threshold or anomaly pattern
Data used
Vibration, temperature, current draw, error logs
Failure detection
4–12 weeks before stoppage
Over-maintenance risk
Low — acts only when data indicates
Under-maintenance risk
Low — catches degradation early
Implementation cost
Higher — sensors + analytics + CMMS
Best for
High-value motors, conveyor drives, lift equipment, battery systems
Where Preventive Maintenance Fails Warehouse Operations
PM is not broken — it is incomplete. The three structural gaps in calendar-based maintenance are predictable, well-documented, and responsible for the majority of unplanned stoppages at warehouses that otherwise appear well-maintained.
1
The Interval Gap
A bearing that was inspected on day 1 can start degrading on day 3 — but the next PM visit is day 30. If the degradation timeline is faster than the inspection cycle, the failure happens mid-interval with no warning. PM frequency cannot be set fast enough to catch all failures without becoming cost-prohibitive.
Avg 25 hours/month lost per plant to interval-gap failures
2
The Over-Service Problem
IBM research shows 30% of preventive maintenance tasks are performed on equipment that does not need them. In a warehouse running 40+ assets, this wastes hundreds of technician-hours annually on parts replacement that resets wear clocks on components still at 60–70% useful life. The budget disappears into scheduled tasks that generate no reliability benefit.
30% of PM tasks performed on healthy components
3
The Load-Variance Blind Spot
A conveyor running 16 hours per day during peak season degrades 2–3 times faster than the same unit running 8 hours in standard periods. A fixed 30-day PM interval treats both identically. Predictive maintenance sees actual degradation regardless of operational intensity — so assets that worked harder get serviced sooner, and assets that ran lightly are not serviced unnecessarily.
Seasonal hubs see 2–3x wear rate variance on the same PM schedule
OxMaint Supports Both Strategies
Your Warehouse Does Not Have to Choose One Strategy. OxMaint Runs Both.
OxMaint manages calendar-based PM schedules alongside condition-triggered work orders — so your critical conveyor drives get sensor-based monitoring while routine fluid and filter tasks continue on schedule. One platform, one maintenance history, one planned-to-unplanned ratio to improve.
Cost and Performance: What the Numbers Actually Show
The financial case for predictive maintenance is strong at scale, but the transition is not cost-free. Understanding the real numbers — upfront investment, payback timeline, and ongoing savings — is essential for building a maintenance strategy business case that holds up in a budget review.
Unplanned downtime reduction
10–20% vs reactive
30–50% vs reactive
Maintenance cost saving
12–18% vs reactive
25–40% vs reactive
Parts consumption accuracy
Moderate — schedule-driven
High — condition-driven
Equipment lifespan extension
10–20%
20–40%
ROI payback timeline
12–18 months
4–18 months (scale-dependent)
Implementation complexity
Low — CMMS + schedule setup
Higher — sensors + analytics
Best planned/unplanned ratio
65:35 typical
80:20 to 90:10 achievable
Which Assets in Your Warehouse Get Which Strategy
The answer is not "all predictive" or "all preventive" — it is matching the right strategy to each asset class based on failure mode, replacement cost, and operational criticality. Most warehouse delivery hubs run a tiered asset strategy without formally naming it that way.
Tier 1 — Predictive First
High-value, failure-critical assets
Conveyor drive motors and gearboxes
Sortation system drives
Dock leveller hydraulic systems
EV forklift battery systems
Refrigeration compressors
Main electrical panels and UPS systems
Why predictive: Failure cost exceeds monitoring cost. Degradation patterns are detectable 4–8 weeks ahead. Unplanned failure causes cascading operational disruption.
Tier 2 — Hybrid
Schedule + condition verification
Pallet rack structural integrity
Loading bay doors and seals
AGV and AMR drive systems
Compressed air systems
Sprinkler system pressure
Conveyor belts and rollers
Why hybrid: Fixed intervals cover compliance requirements; condition checks catch accelerated wear during peak season when load intensity spikes beyond design assumptions.
Tier 3 — Preventive Only
Schedule-driven is optimal
Lighting systems and emergency lighting
HVAC filters and belts
Fire suppression system checks
Manual pallet jack inspections
Safety signage and floor markings
Battery charger contact cleaning
Why preventive only: Failure cost is low, replacement is simple, and calendar-based service is cost-optimal. Adding sensor monitoring would cost more than the failures it prevents.
The Hybrid Roadmap: How Warehouse Hubs Transition from PM to PdM
Most warehouses do not switch strategies overnight. They layer condition monitoring onto existing PM programmes, starting with the assets where predictive ROI is clearest, and expanding as CMMS data reveals where interval-gap failures are most frequent.
Phase 1
Months 1–3
Baseline PM in CMMS
Register all assets in OxMaint. Build out PM schedules for every asset class. Start capturing work order completion data and failure records. This creates the baseline that makes predictive triggers meaningful.
Win: Planned/unplanned ratio becomes measurable
Phase 2
Months 3–6
Identify High-Failure Assets
Use CMMS work order history to identify the 20% of assets generating 80% of reactive work orders. These are the Tier 1 candidates for condition monitoring. Prioritising by failure cost and frequency produces the strongest early ROI.
Win: Targeted investment, fastest payback
Phase 3
Months 6–12
Layer Condition Monitoring
Deploy sensors on Tier 1 assets. Connect telemetry to OxMaint — threshold violations create work orders automatically. PM schedules remain active but condition data now supplements or extends calendar-based intervals where assets remain healthy.
Win: Unplanned downtime drops 30–50% on monitored assets
Phase 4
Months 12+
Optimise Intervals with Data
Use 12 months of condition data to adjust PM intervals — extending them on assets that consistently pass condition checks, tightening them on assets showing accelerated seasonal degradation. The programme self-optimises as the dataset grows.
Win: PM spend drops 15–25% without reliability loss
Frequently Asked Questions
Build Your Maintenance Strategy in OxMaint
Your Warehouse Does Not Need to Pick a Strategy. It Needs a Platform That Runs Both.
OxMaint manages preventive PM schedules, condition-based work order triggers, asset health histories, planned-to-unplanned ratios, and maintenance cost analytics — all in one platform designed for warehouse and delivery hub scale. Start with PM, add predictive where the ROI is clear, and let the data drive the optimisation.