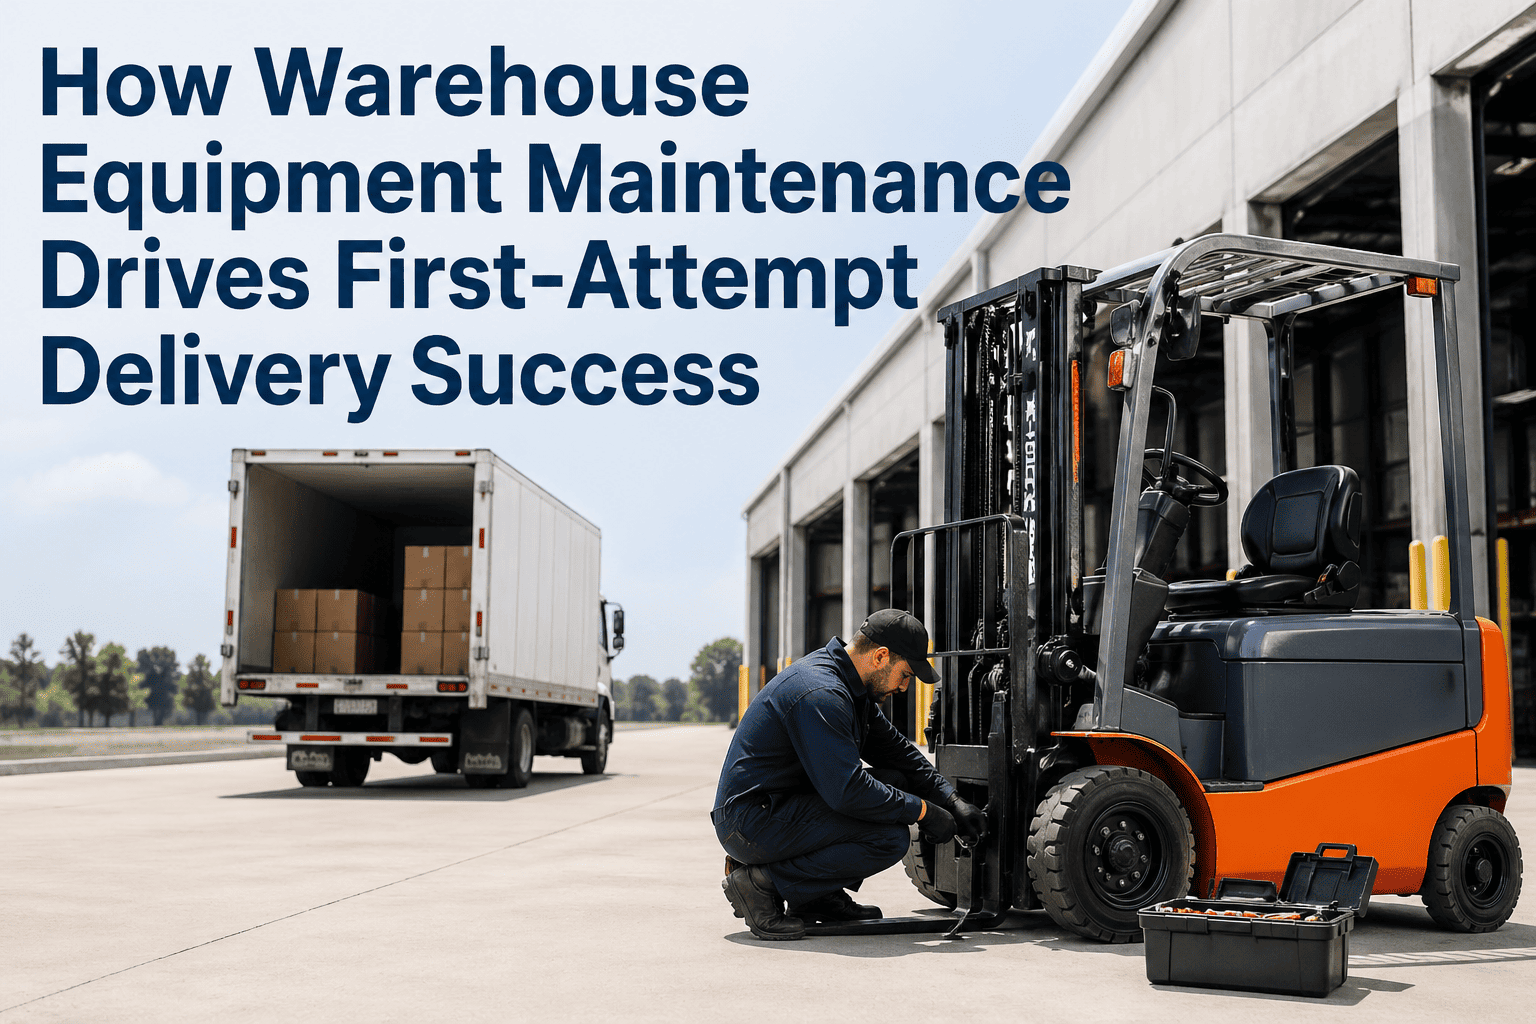
The industry talks about first-attempt delivery failure as a recipient problem: wrong address, no one home, access restrictions. That narrative is convenient — it shifts accountability away from the operation and toward the customer. But for warehouse and delivery managers who look honestly at their data, a different pattern emerges. Dispatch delays driven by equipment failures push vehicles into time windows where delivery success rates fall sharply. A conveyor jam at 7:40 AM that delays a truck's departure by 90 minutes does not show up in the failure report as a maintenance event — it shows up as a missed delivery window, absorbed quietly into the SLA penalty column. This article makes the connection explicit, puts numbers on it, and shows how a structured CMMS approach closes the gap. If your first-attempt delivery rate is below target and your maintenance records are held in spreadsheets or paper, start your free OxMaint trial and see the link for yourself within 30 days.
8–20%
of deliveries globally fail on the first attempt — costing an average of $17.20 per parcel in re-delivery, storage, and service overhead
70%
of shoppers are unlikely to return after a failed delivery experience — making first-attempt success a direct revenue retention metric
94%
of consumers blame the retailer — not the carrier — when a delivery fails, regardless of where in the chain the delay originated
£240K
average annual cost of failed deliveries for UK retailers — yet most never trace a single failure back to a warehouse equipment event
The Connection Most Operations Are Missing
When a delivery fails, the post-event review almost always focuses on the last mile: driver routing, time windows, customer availability. Rarely does anyone ask what time the vehicle left the warehouse — and why. Equipment-driven dispatch delays are the silent driver of first-attempt failure that operations systematically overlook because the data lives in two separate systems that never talk to each other.
THE HIDDEN CHAIN: EQUIPMENT FAILURE → DISPATCH DELAY → DELIVERY FAILURE
Equipment Event
Conveyor belt jam
Forklift unavailable
Loading bay door fault
Pallet wrapper failure
Dispatch Impact
Vehicle departs late
Route order disrupted
First stops now last
Time window compressed
Delivery Outcome
Missed delivery window
Recipient no longer home
SLA penalty triggered
Re-delivery cost incurred
How It Appears in Reports
"Recipient not available"
"Access issue"
"Carrier delay"
Root cause: never attributed to equipment failure
Which Equipment Failures Drive the Most Dispatch Delays
Not all warehouse equipment has equal impact on dispatch timing. The assets that sit directly in the goods-outbound flow — between pick completion and vehicle loading — have the highest influence on departure time. A failure in this zone does not just slow one order; it stops the entire outbound flow until resolved.
Critical Dispatch Impact
Outbound Conveyor Systems
A belt jam or motor failure in the outbound sort or induction zone immediately halts all order movement to loading docks. Every vehicle waiting to depart is held until resolution. Average resolution time without predictive maintenance: 2–4 hours.
A single conveyor failure during a peak dispatch window can delay 8–15 vehicles simultaneously
Critical Dispatch Impact
Loading Bay Doors and Dock Levellers
A stuck or failed loading bay door effectively removes that loading point from the dispatch schedule. Remaining bays absorb additional vehicle queues, sequencing breaks down, and departure timing for the entire fleet shifts right.
Bay door failures are the most underlogged equipment event in warehouse maintenance records
Significant Dispatch Impact
Forklifts and Reach Trucks
An unplanned forklift out-of-service event forces manual workarounds or reassignment across the outbound operation. At high-volume operations, even one unavailable forklift during the morning dispatch window adds measurable delay to departure timing.
Forklift downtime costs operations far beyond repair: idle operators, delayed routes, SLA exposure
Significant Dispatch Impact
Pallet Wrappers and Shrink Systems
Often overlooked as a maintenance priority, pallet wrapper failure at the end of the pack line forces manual wrapping — a process that is 4–6x slower and introduces inconsistency into load security, which can cause further downstream delays at vehicle loading.
Manual wrapping during peak dispatch adds 25–45 minutes to total outbound time per shift
Indirect Dispatch Impact
Dispatch Vehicles and Delivery Fleet
A vehicle that fails pre-departure inspection — brake defect, tyre issue, engine warning — cannot legally or safely depart. If the fault was detectable 2–3 weeks earlier through OBD monitoring, the vehicle could have been serviced during a planned window with zero dispatch impact.
Vehicle pre-departure failures are preventable in over 80% of cases with OBD-driven maintenance scheduling
Connect Your Equipment Maintenance to Your Delivery Performance
OxMaint links every equipment event to dispatch timing — so you see exactly which assets are costing you first-attempt delivery success.
The Dispatch Timing Window: Why 90 Minutes Changes Everything
First-attempt delivery success is heavily dependent on arrival timing relative to the recipient's availability window. The difference between a vehicle departing at 7:30 AM and 9:00 AM — a 90-minute gap — can shift an entire route's delivery completion from mid-morning into the early afternoon, when residential availability drops sharply and business delivery windows close.
DISPATCH TIMING VS FIRST-ATTEMPT SUCCESS RATE — RESIDENTIAL DELIVERY ROUTES
Equipment-driven dispatch delays push vehicles from the left side of this chart to the right. A 90-minute delay does not just mean a late departure — it means a significantly worse first-attempt outcome across the entire route.
What a CMMS-Connected Operation Looks Like vs What Most Operations Run
The operational difference between a maintenance-connected and maintenance-disconnected warehouse is not subtle. It shows up every morning at dispatch, every week in SLA reporting, and every quarter in the cost of re-deliveries that should never have been necessary.
SIDE BY SIDE: SAME EQUIPMENT FAULT, TWO DIFFERENT OPERATIONS
Without CMMS Maintenance Tracking
✕
Conveyor bearing degradation goes undetected — no sensor alerts, no condition records
✕
Bearing fails at 06:50 AM during peak outbound sort — entire conveyor line stops
✕
Emergency call-out technician arrives at 08:30 — 100-minute stoppage
✕
12 vehicles depart 90 minutes late — routes shifted into low-availability time windows
✕
34 first-attempt failures recorded — reported as "recipient not available"
✕
Root cause never connected to equipment failure — pattern repeats next quarter
Estimated cost: £4,200 emergency repair + £590 re-delivery + SLA penalties
With OxMaint CMMS Maintenance Tracking
✓
OBD and sensor data flags conveyor bearing vibration anomaly 18 days before failure threshold
✓
Planned maintenance scheduled for a Sunday non-peak window — bearing replaced in 2 hours
✓
Zero unplanned downtime — Monday dispatch runs on schedule, all vehicles depart on time
✓
First-attempt delivery rate holds at target — no SLA penalties triggered
✓
Work order closed with full record — bearing failure prevented, cost and timing logged
✓
Pattern data feeds predictive model — next bearing on same conveyor line flagged proactively
Actual cost: £380 planned repair parts + £90 technician time. Full delivery performance maintained.
"We spent six months trying to improve our first-attempt rate by optimising route scheduling and adding delivery window notifications. Rate barely moved. When we finally pulled our maintenance logs and mapped them against departure times, we found that 60% of our worst delivery days followed a morning equipment event. That was the lever we had been missing."
Head of Delivery Operations
National grocery fulfilment operation — 6 warehouse sites
The 4 Metrics That Connect Maintenance to Delivery Performance
To manage the link between equipment reliability and first-attempt delivery success, operations need four specific metrics tracked simultaneously. OxMaint calculates all four automatically from work order, defect, and dispatch data — no manual correlation required.
01
Dispatch-Ready Rate
The percentage of scheduled departure windows where all vehicles depart within 15 minutes of the target time. Equipment failures that cause delays below this threshold are flagged automatically with root cause attribution.
Target: 95%+ dispatch-ready rate in well-maintained operations
02
Equipment-Driven Delay Minutes
Total minutes of dispatch delay directly attributable to equipment failure events per week, per asset class. This metric converts the vague concept of "downtime" into a precise delivery performance number your commercial team can act on.
Track weekly — a rising trend here predicts a falling FADR 2–3 weeks ahead
03
PM Completion Rate vs FADR
When preventive maintenance completion rate drops below 85%, first-attempt delivery rates typically follow within 3–4 weeks as equipment condition deteriorates. OxMaint tracks this correlation automatically and alerts when the relationship is breaking down.
Operations with 90%+ PM completion rate average 4.2% higher FADR than those below
04
Failure-to-SLA Penalty Ratio
The commercial cost of each equipment failure expressed as the total SLA penalty and re-delivery cost it generated. This is the metric that makes the business case for maintenance investment undeniable — it converts maintenance from a cost into a revenue protection function.
Most operations find this ratio is 3–8x the direct repair cost of the equipment failure
Frequently Asked Questions
How do I prove to my commercial team that equipment is causing delivery failures?
Pull your work order timestamps alongside your dispatch departure logs for the same days. In most operations, 60–70% of the worst FADR days have a maintenance event within 4 hours of the morning dispatch window. OxMaint generates this correlation report automatically once both data sources are connected — typically a 5-minute conversation with your team rather than a week of spreadsheet work.
Which warehouse assets have the biggest impact on first-attempt delivery rates?
Outbound conveyor systems and loading bay doors carry the highest dispatch impact because they sit directly in the goods flow between pick completion and vehicle loading. A failure in either of these assets stops multiple vehicles simultaneously. Forklifts and pallet wrappers have significant but more contained impact. Fleet vehicles have the most direct impact on delivery timing when they fail pre-departure.
Can OxMaint track both warehouse equipment and delivery vehicles in one system?
Yes — OxMaint manages both warehouse assets and delivery fleet on one platform. Work orders, PM schedules, defect records, and OBD data are unified, so the dispatch-ready rate and equipment-to-FADR correlation are calculated across the full equipment estate, not just one asset type.
How quickly can we see the delivery performance impact after improving equipment maintenance?
Most operations see measurable improvement in dispatch-ready rate within 6–8 weeks of implementing structured preventive maintenance. The FADR improvement typically follows 2–4 weeks later as the routing and timing gains from consistent dispatch timing flow through to delivery outcomes.
We already have a WMS — do we need a separate CMMS?
WMS systems track inventory and order flow, not equipment condition or maintenance history. OxMaint integrates alongside your WMS and adds the maintenance and equipment reliability layer that WMS platforms do not cover. The two systems are complementary — together they give you full visibility from stock movement to vehicle departure timing.
OXMAINT · WAREHOUSE AND FLEET MAINTENANCE MANAGEMENT
Stop Blaming Recipients for Delivery Failures Your Equipment Is Causing
Connect your warehouse equipment, fleet vehicles, and dispatch records. OxMaint shows you exactly which maintenance events are driving first-attempt failure — and gives you the tools to fix them before the next dispatch window.