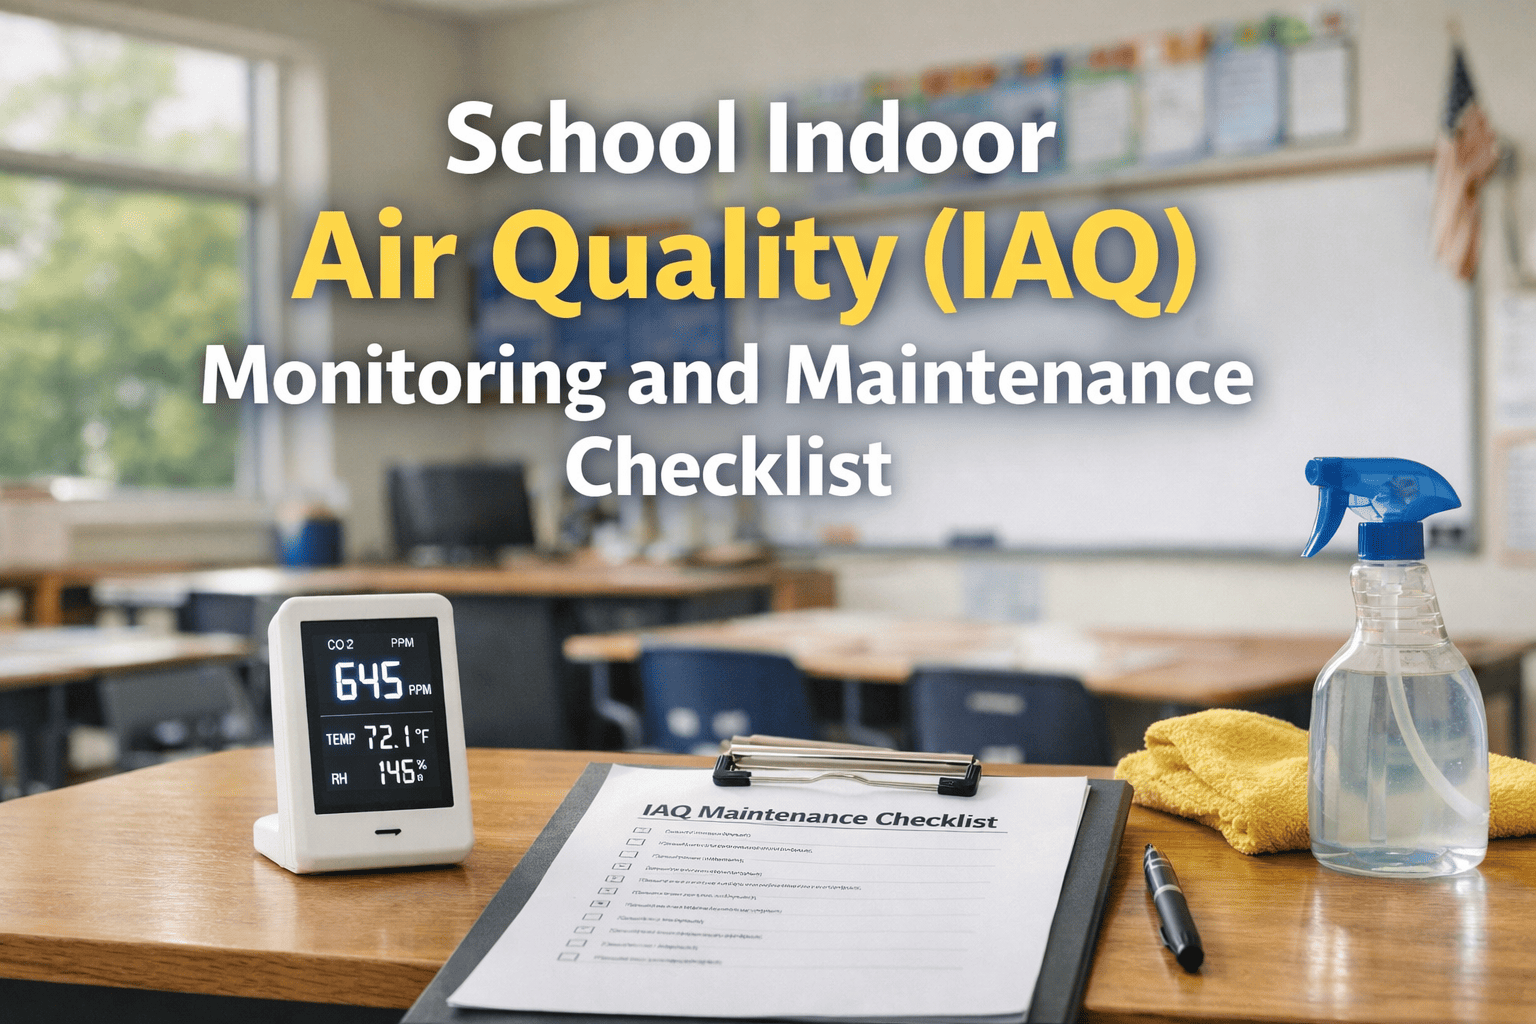
A research study published by Lawrence Berkeley National Laboratory in 2024 surveyed 2,444 classrooms across 125 studies and found a median CO2 concentration of 1,487 ppm — nearly 50% above the 1,000 ppm threshold where measurable cognitive performance decline begins. The same body of research documented 13–14% improvements in student test performance when ventilation rates met ASHRAE standards. That is not a marginal academic finding. It is the gap between students whose ventilation system is being maintained and students whose isn't. Every campus that monitors classroom CO2, humidity, and particulate matter is operating in a different educational reality from one that doesn't — because the ventilation system either supports cognitive performance or measurably suppresses it. If your campus still monitors air quality with quarterly handheld spot checks (or doesn't monitor it at all), sign up to try Oxmaint free for 30 days or book a demo.
Campus Air Quality & Cognitive Performance —
81% of Naturally Ventilated Classrooms Exceed the 1,000 ppm CO2 Threshold Where Student Cognition Begins to Decline
1,487 ppm
Median classroom CO2
Across 2,444 classrooms in a 2024 systematic review of 125 studies — nearly 50% above cognitive threshold
13–14%
Test score improvement
Berkeley Lab data on student performance with ASHRAE-compliant ventilation
85%
CA HVAC systems failing
UC Davis / Berkeley Lab — 51% have equipment, fan control, or maintenance problems
40%
Reduction in respiratory absences
Documented by schools deploying ventilation improvement programs and continuous monitoring
The Four Air Quality Parameters Every Campus Should Monitor Continuously
Indoor air quality is not a single number — it is the interaction of at least four measurable parameters that together determine whether a classroom is supporting student health and cognition or quietly degrading both. Continuous monitoring exists because spot checks miss the very excursions that matter most.
CO2
Carbon Dioxide
Target: under 1,000 ppm | Optimal: under 800 ppm
Direct proxy for ventilation rate. Outdoor ambient is ~420 ppm. Above 1,000 ppm cognitive performance measurably declines. CA Public Health recommends classrooms stay below 800 ppm. ASHRAE 62.1 caps at outdoor + 700 ppm.
Trigger: HVAC outdoor air damper inspection
RH
Relative Humidity
Target range: 30–60%
Below 30% causes respiratory irritation and increases viral transmission. Above 60% promotes mold growth and dust mite proliferation. Critical for laboratory environments and historic library collections in addition to classrooms.
Trigger: humidifier or dehumidifier service
PM
Particulate Matter (PM2.5 / PM10)
Target: PM2.5 under 12 μg/m³ (24-hr avg)
Linked to respiratory symptoms, asthma, and reduced cognitive performance. Wildfire season, urban traffic, and clogged HVAC filters all drive elevations. Schools with HEPA filtration document up to 60% PM reductions.
Trigger: filter replacement work order
VOC
Volatile Organic Compounds
Target: TVOC under 500 ppb
Off-gassing from new furniture, cleaning products, art supplies, and chemistry lab activities. IT classrooms with electronics emit specific VOC profiles. Acute exposure causes headaches and irritation; chronic exposure has documented respiratory effects.
Trigger: ventilation increase + source investigation
Four Hidden Air Quality Failures on Most University Campuses
01
HVAC Outdoor Air Dampers Stuck Closed
The single most common cause of classroom CO2 elevation. Dampers that stick at 10% open instead of cycling to 30%+ during occupied hours look fine on a system check — until CO2 sensors show classrooms hitting 1,800+ ppm during midmorning lectures. UC Davis / Berkeley Lab found 51% of California school HVAC systems had equipment, fan control, or maintenance problems.
02
Filter Replacement Schedules Calendar-Based Instead of Load-Based
A MERV 13 filter replaced every 90 days regardless of actual loading is wasteful in spring and dangerous in wildfire season. Particulate-loaded filters increase static pressure, reduce ventilation rate, and become the cause of the air quality problem they were installed to prevent.
03
Sensor Data Not Connected to Maintenance Workflow
Many campuses already have CO2 monitors. The data sits in a building automation dashboard nobody opens. When CO2 in Lecture Hall 4 hit 1,650 ppm three Tuesdays in a row, no work order was generated because the BAS and the CMMS don't talk. Sensor investment without integration produces compliance theater, not air quality.
04
No Documentation Trail for State IAQ Compliance
Connecticut now mandates annual EPA Tools for Schools inspections. California's AB 2232 requires ventilation rate compliance. Delaware mandates routine IAQ monitoring. Without timestamped sensor records and corresponding maintenance work orders, the institution cannot prove compliance — even if the actual air quality is fine.
Built for Continuous Air Quality Maintenance
Sensors Without Maintenance Workflow Is Just Data. With Oxmaint, It's Action.
Oxmaint integrates CO2, humidity, PM, and VOC sensor streams directly into the maintenance system — generating work orders the moment a parameter trends out of spec, with the documentation trail that satisfies state IAQ compliance requirements.
How Oxmaint Connects Air Quality Sensors to Campus HVAC Maintenance
01
Live IAQ Sensor Integration
CO2, humidity, PM2.5/PM10, and VOC sensor data streams directly into Oxmaint via API or BAS bridge. No separate dashboard for facilities to monitor. Live readings visible per classroom, per building, per zone.
Single platform for sensors and maintenance
02
Threshold-Triggered Work Orders
When CO2 exceeds 1,000 ppm for more than 30 minutes during occupied hours, an HVAC inspection work order generates automatically with the specific zone and timing data attached. PM spikes trigger filter replacement orders. VOC excursions trigger ventilation increase + source investigation workflows.
Sensor alerts become resolved work, not background noise
03
Filter Replacement on Loading, Not Calendar
Filter replacement work orders trigger from differential pressure trends and PM2.5 trapping efficiency rather than fixed 90-day intervals. During wildfire season, filters change at week 6. During light spring loading, they go to week 16. Maintenance dollars allocated by actual condition.
25–35% reduction in filter spend with same air quality
04
HVAC PM Programs Aligned to ASHRAE 62.1
Outdoor air damper inspections, economizer testing, fan control verification, coil cleaning — preventive maintenance schedules built around the failure modes that cause the IAQ problems. Annual ASHRAE 62.1 ventilation rate verification documented per zone.
Ventilation system reliability documented zone by zone
05
State IAQ Compliance Documentation
Connecticut EPA Tools for Schools inspections, California AB 2232 ventilation rate evidence, Delaware IAQ program records — all generated from the underlying sensor and work order data without manual report assembly. Audit packages exportable on demand.
State IAQ audit response in minutes
06
Cognitive Environment Reporting
Reports correlating classroom CO2 trends with ASHRAE benchmarks, building-level air quality scorecards for academic administrators, and trend analysis showing where IAQ investment delivers measurable cognitive performance environments. Data the provost and dean can act on.
IAQ performance visible to academic leadership
Spot Checks vs. Continuous Monitoring + Integrated Maintenance
| Dimension | Quarterly handheld spot checks | Standalone IAQ dashboard | Oxmaint integrated workflow |
|---|
| Data continuity | 4 readings per year per zone | Continuous, but not actioned | Continuous + work orders triggered |
| Excursion detection | Misses 99% of CO2 events | Detected, ignored | Detected, work order in minutes |
| Filter replacement basis | Calendar quarterly | Calendar quarterly | Loading + differential pressure |
| HVAC damper inspection | Only on annual PM cycle | Only on annual PM cycle | CO2-triggered when needed |
| State compliance documentation | Spot check report only | Sensor logs only | Full sensor + maintenance record |
| Wildfire / acute event response | None until next quarter | Manual response if noticed | Auto-escalated work orders |
| Cognitive environment delivery | Unknown | Visible but not maintained | Continuously maintained |
Frequently Asked Questions
Does Oxmaint require a specific brand of IAQ sensors?+
No. Oxmaint integrates with any sensor that exposes data via API, MQTT, or BACnet — including major IAQ vendors (Awair, Kaiterra, Airthings, Senseair, Aranet) and most building automation systems. Existing CO2 sensor deployments connect during setup. Campuses without sensors yet receive deployment guidance for cost-effective coverage of high-occupancy spaces first.
Book a demo to see integration patterns.
How many sensors does a typical classroom or building need?+
Research from New Zealand classroom studies showed a single sensor placed at 1.5 meters height on a wall (away from ventilation openings) produces temporal variations of only ±100 ppm — adequate accuracy for compliance monitoring. For typical classrooms one sensor per room is sufficient. Lecture halls and large open spaces may need two to three for spatial coverage. Critical research labs may justify denser sensor arrays.
What is the typical ROI of integrating sensors with maintenance workflow?+
Three documented return streams: (1) filter spend optimization — typically 25–35% reduction by replacing on actual loading vs calendar, (2) emergency repair avoidance — sensor-triggered work orders catch HVAC issues weeks before they become tenant complaints, (3) cognitive environment delivery — Berkeley Lab research links proper ventilation to 13–14% test score improvements, a meaningful institutional outcome. Federal funding through the Indoor Air Quality and Healthy Schools Act of 2024 supports up to $100M annually in IAQ improvements through 2029.
How does the platform handle wildfire smoke or acute pollution events?+
When PM2.5 spikes above the EPA AQI hazardous threshold, Oxmaint escalates immediately — emergency filter check work orders, outdoor air damper closure recommendations to BAS, and notification to the operations director with affected building list. The same workflow handles HVAC equipment failures that cause acute IAQ degradation. Documentation is automatic for any subsequent regulatory reporting.
How long does sensor + maintenance integration deployment take?+
For campuses with existing IAQ sensors, integration is typically 2–4 weeks — API mapping, threshold configuration, work order template setup, and BAS bridging where required. Campuses deploying sensors and Oxmaint together typically take 6–10 weeks for a phased rollout starting with high-occupancy classrooms and lecture halls before expanding to dorms, libraries, and labs.
Campus IAQ & Maintenance — Oxmaint
Air Quality Is a Maintenance Problem. Solve It Like One.
Continuous CO2, humidity, PM, and VOC monitoring integrated directly into HVAC maintenance workflows. Sensor excursions become work orders. Filter replacements happen on loading, not calendar. State IAQ compliance documents itself. The cognitive environment students learn in becomes something the institution actually delivers.
13–14%
Test score lift documented with proper ventilation
25–35%
Filter spend reduction on loading-based replacement
40%
Reduction in respiratory absences with monitoring
Minutes
From sensor excursion to work order generated