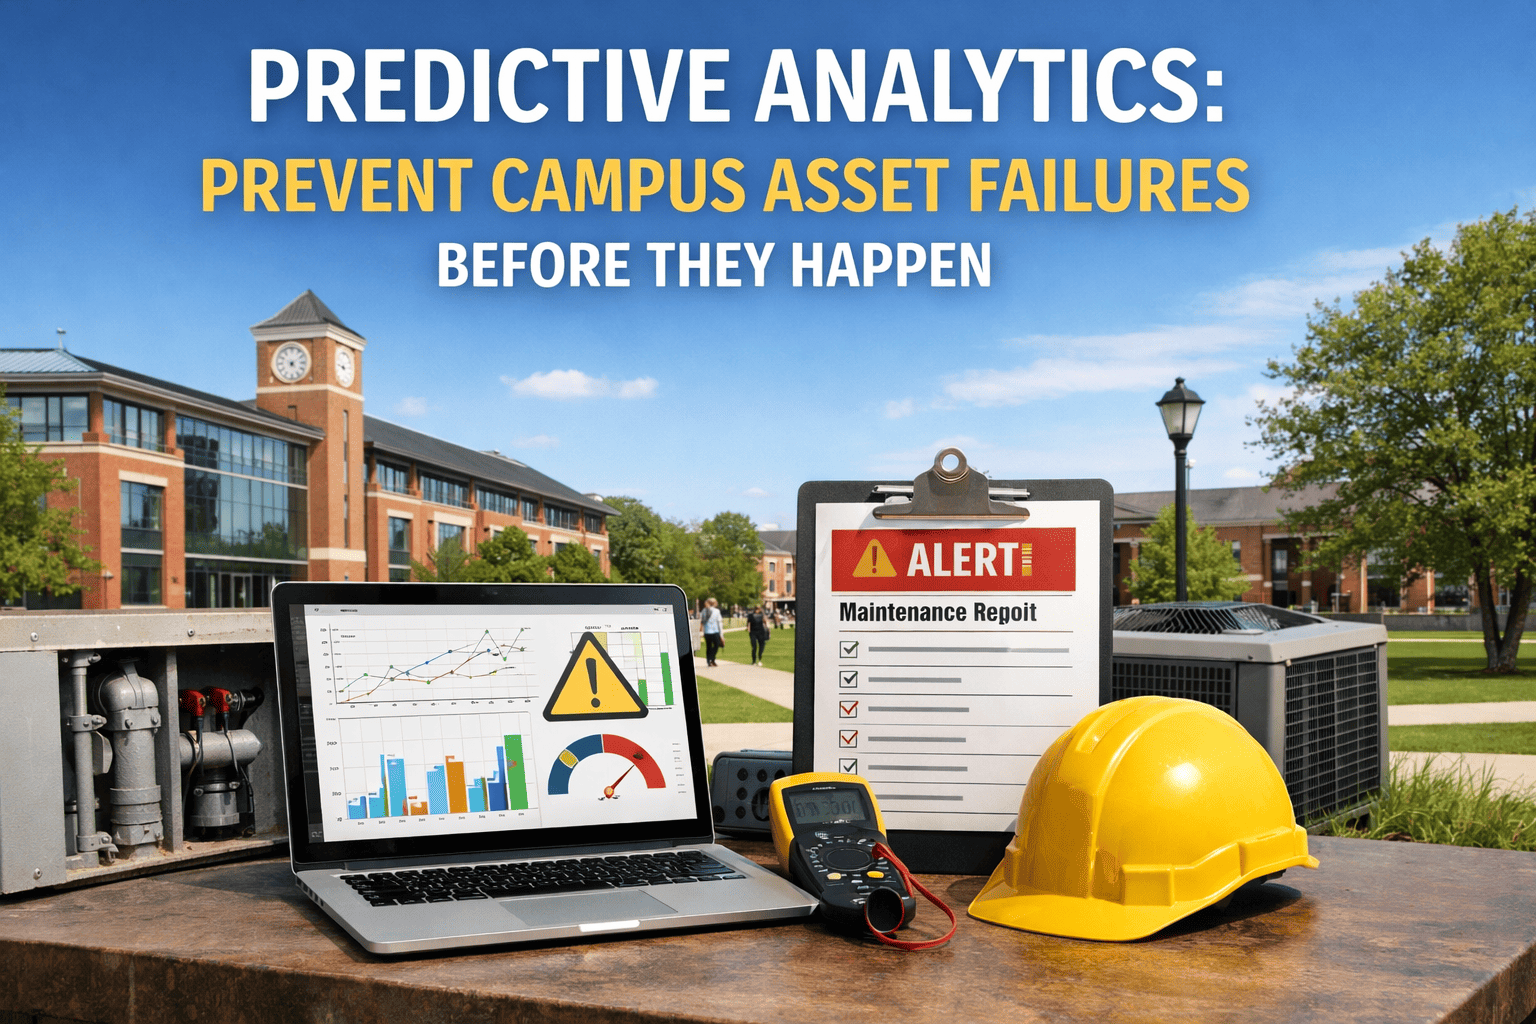
Your walk-in cooler compressor has been running 23% longer than normal for the past six days. The pattern is subtle—nothing that would trigger an alarm or catch a technician's attention during a routine check. But an AI monitoring system recognizes this as the early signature of refrigerant loss. In 10-14 days, that compressor will fail during a Friday lunch service, destroying $12,000 in inventory and leaving 1,200 students without hot meals. The repair will cost $4,800 in emergency service rates. Or, you could schedule a $400 refrigerant recharge next Tuesday morning.
This is the difference between reactive and predictive maintenance in campus dining operations. Traditional maintenance waits for failure. Predictive maintenance detects the conditions that precede failure—weeks before equipment stops working. For campus kitchens where food safety, service continuity, and compliance all depend on equipment reliability, AI-driven predictive maintenance isn't a luxury. It's how modern dining operations protect their students, their budgets, and their reputations. Book a Demo — see predictive maintenance in action for your campus kitchen.
This guide explains how AI-powered condition monitoring works for campus kitchen equipment, which assets benefit most from predictive approaches, and how to implement a system that catches problems before students ever notice them. Sign Up — start tracking your kitchen equipment health digitally.
A $400 scheduled repair or a $4,800 emergency call—AI monitoring gives your team the data to choose planned over panic, every time.
Why Campus Kitchens Need Predictive Maintenance
Campus dining operations face a unique combination of pressures that make equipment reliability non-negotiable. Unlike restaurants that can close for a day or adjust menus, university dining halls must serve thousands of students on fixed schedules—often with limited backup options.
| Challenge | Traditional Approach | Predictive Approach |
|---|---|---|
| Food Safety | Discover temperature excursions after food is compromised | Alert when cooling performance degrades, before temperatures rise |
| Service Continuity | React when equipment fails during lunch rush | Schedule repairs during breaks and off-hours |
| Budget Management | Unpredictable emergency repair costs | Planned maintenance with predictable expenses |
| Compliance | Document failures after they occur | Demonstrate proactive monitoring to inspectors |
| Equipment Lifespan | Run to failure, replace prematurely | Optimize maintenance timing, extend useful life |
When a single walk-in cooler failure can cost more than an entire semester of planned maintenance, the math is clear. Sign Up — log every cooler, oven, and dishwasher into one asset register in minutes.
How AI-Powered Predictive Maintenance Works
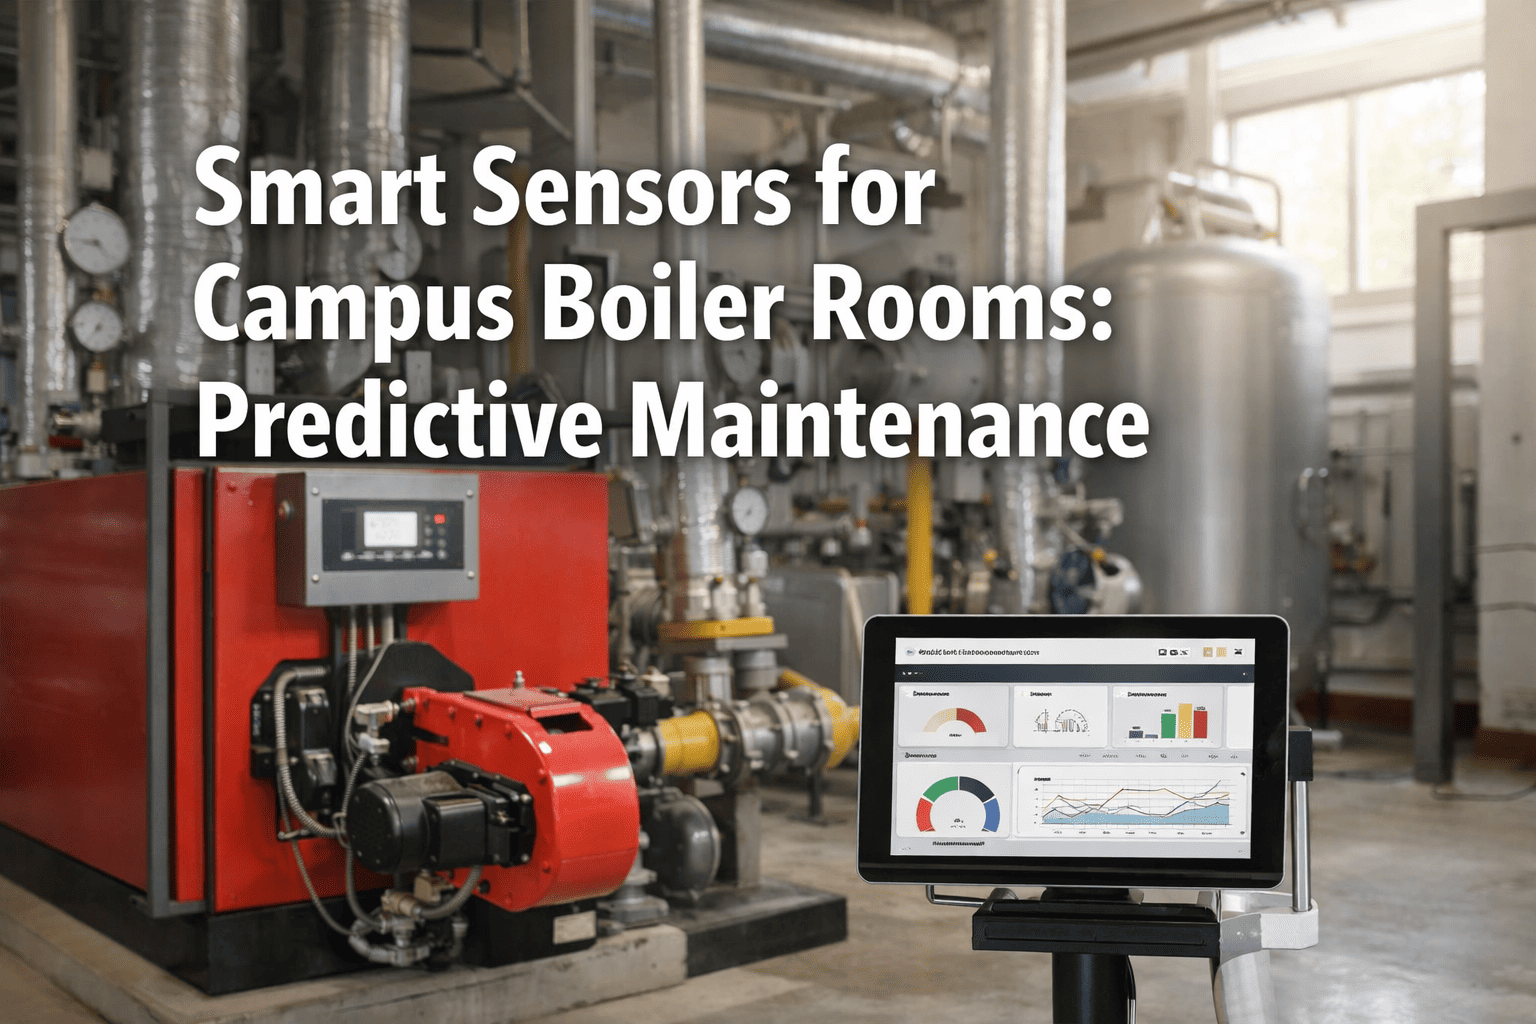
IoT sensors track temperature, vibration, current draw, and runtime patterns 24/7
AI algorithms compare current readings against baseline and known failure signatures
System alerts maintenance team when degradation patterns emerge—weeks before failure
Work order generated automatically, scheduled for optimal timing with parts pre-ordered
Every sensor reading flows into Oxmaint as a live asset health record — no clipboards, no missed readings, no guesswork. Book a Demo — walk through the sensor-to-work-order pipeline for your kitchen.
What Makes AI Different from Simple Alerts
| Capability | Threshold Alerts | AI Predictive |
|---|---|---|
| Detection Timing | After threshold is crossed | 2-6 weeks before failure |
| Pattern Recognition | Single-variable triggers | Multi-variable correlation analysis |
| False Alarms | High—any spike triggers alert | Low—AI filters normal variations |
| Failure Prediction | None—only detects current state | Estimates time to failure |
| Learning | Static thresholds | Improves accuracy over time |
| Maintenance Optimization | None | Recommends optimal intervention timing |
Kitchen Equipment Monitoring Applications
| Equipment | What Sensors Track | Failure Signatures AI Detects | Warning Lead Time | Prevented Cost |
|---|---|---|---|---|
| Walk-In Coolers | Compressor runtime, temperature delta, door cycles | Extended runtime indicating refrigerant loss or coil icing | 2-4 weeks | $8,000-15,000 |
| Walk-In Freezers | Defrost cycle timing, temperature recovery, compressor current | Defrost heater degradation, compressor strain | 2-4 weeks | $10,000-20,000 |
| Commercial Dishwashers | Wash/rinse temperatures, cycle times, water pressure | Booster heater degradation, pump wear | 1-3 weeks | $2,000-5,000 |
| Combi Ovens | Steam generation time, temperature accuracy, drain flow | Scale buildup, heating element degradation | 2-4 weeks | $3,000-8,000 |
| Commercial Fryers | Heat-up time, temperature stability, thermostat cycling | Burner/element degradation, thermostat drift | 1-2 weeks | $1,500-4,000 |
| Ice Machines | Harvest cycle time, production rate, condenser temperature | Refrigerant issues, scale buildup, condenser fouling | 2-4 weeks | $1,000-3,000 |
| Hood Exhaust Systems | Airflow velocity, motor current, static pressure | Filter loading, belt wear, motor degradation | 3-6 weeks | $2,000-6,000 |
From cooler compressors to exhaust fans—identify which assets in your kitchen are showing early signs of degradation before they disrupt service.
Refrigeration Monitoring Deep Dive
Refrigeration is the single highest-risk equipment category in any campus kitchen — combining food safety liability, expensive inventory exposure, and costly emergency repairs into one asset class. Here is exactly what a sensor array monitors and why each data point matters.
| Sensor Type | What It Measures | Normal Range | Warning Pattern | Indicates |
|---|---|---|---|---|
| Temperature Probe | Interior air temperature | 35-38°F (cooler) | Gradual drift upward over days | Refrigerant loss, coil issues |
| Runtime Sensor | Compressor on/off cycles | 40-60% duty cycle | Increasing runtime percentage | Reduced cooling efficiency |
| Current Monitor | Compressor electrical draw | Manufacturer spec ±10% | Rising current draw | Motor strain, bearing wear |
| Door Contact | Door open/close events | Varies by operation | Unusual patterns, long opens | Gasket issues, staff behavior |
| Vibration Sensor | Compressor/fan vibration | Baseline established | Increasing vibration amplitude | Bearing wear, mounting issues |
Every reading above feeds directly into your asset history — building the trend data that turns a $12,000 emergency into a $400 scheduled fix. Sign Up — start building refrigeration health baselines for your walk-ins today.
Implementation Roadmap
You do not need to monitor every piece of equipment on day one. The most successful campus dining operations follow a phased rollout that proves ROI fast and scales from there. Book a Demo — build a phased rollout plan matched to your campus dining calendar.
- Complete inventory of all kitchen equipment with age, condition, and criticality
- Calculate failure cost for each asset (repair + downtime + inventory loss)
- Identify top 10-15 highest-value monitoring candidates
- Install IoT sensors on priority equipment (refrigeration first)
- Configure CMMS integration for automated data collection
- Establish baseline performance metrics for each asset
- AI system learns normal operating patterns for each asset
- Refine alert thresholds based on actual operating data
Phase 1 takes under an hour when you start with a digital asset register. Sign Up — register every kitchen asset and rank them by failure cost before your next service.
Frequently Asked Questions
How far in advance can AI actually predict kitchen equipment failures?
It depends on the equipment and failure type. Refrigeration compressor issues are typically detected 2-4 weeks before failure through runtime and current draw pattern changes. Dishwasher booster heater degradation shows up 1-3 weeks early. Hood exhaust motor wear can be caught 3-6 weeks ahead. The key factor is baseline data—systems become more accurate after 4-8 weeks of learning normal operating patterns for each specific asset.
What does predictive maintenance cost compared to what it saves?
Sensor hardware typically runs $200-500 per monitored asset, plus software subscription fees. For context, a single walk-in cooler failure can cost $12,000+ in lost inventory plus $4,800 in emergency repairs. Most campus dining operations see full payback within 3-4 months on refrigeration monitoring alone. The ROI compounds as the AI learns your specific equipment and catches subtler degradation patterns over time. Book a Demo — calculate your projected ROI based on your actual equipment and failure history.
Do we need to monitor every piece of kitchen equipment?
No—start with the assets where unplanned failure carries the highest cost. Refrigeration units are almost always the top priority because they combine expensive inventory at risk, food safety liability, and high emergency repair costs. Dishwashers rank next since they create immediate service bottlenecks. Combi ovens, fryers, and ice machines follow based on your operation's specific menu and service demands. Most campuses see 80% of the benefit from monitoring just 10-15 critical assets.
How does AI monitoring differ from the temperature alarms we already have?
Standard temperature alarms only trigger after a threshold is crossed—by then, food may already be compromised and the failure is underway. AI monitoring tracks multiple variables simultaneously (runtime percentage, current draw, vibration, temperature recovery time) and detects subtle degradation trends days or weeks before any single reading crosses a threshold. It also learns to distinguish real problems from normal operational variations, dramatically reducing false alarms. Sign Up — replace single-point alarms with multi-variable asset health tracking.
What infrastructure do we need to get started?
You need reliable Wi-Fi coverage in kitchen and equipment areas, which most campuses already have. IoT sensors are typically battery-powered and wireless, requiring no hardwiring. The CMMS software runs cloud-based, so no on-premise servers are needed. Phase 1 is just asset inventory and prioritization—sensor deployment usually begins in weeks 5-8, starting with refrigeration units where the ROI case is clearest. Book a Demo — assess your infrastructure readiness in a 15-minute walkthrough.
Will this replace our maintenance technicians?
No—it makes them significantly more effective. Instead of spending time on scheduled inspections where 95% of equipment checks out fine, technicians focus on assets that actually show early warning signs. They arrive with diagnostic data already in hand, which cuts troubleshooting time by 40-60%. Predictive systems also help less experienced staff make better decisions by flagging which issues need immediate attention versus which can wait for scheduled downtime.