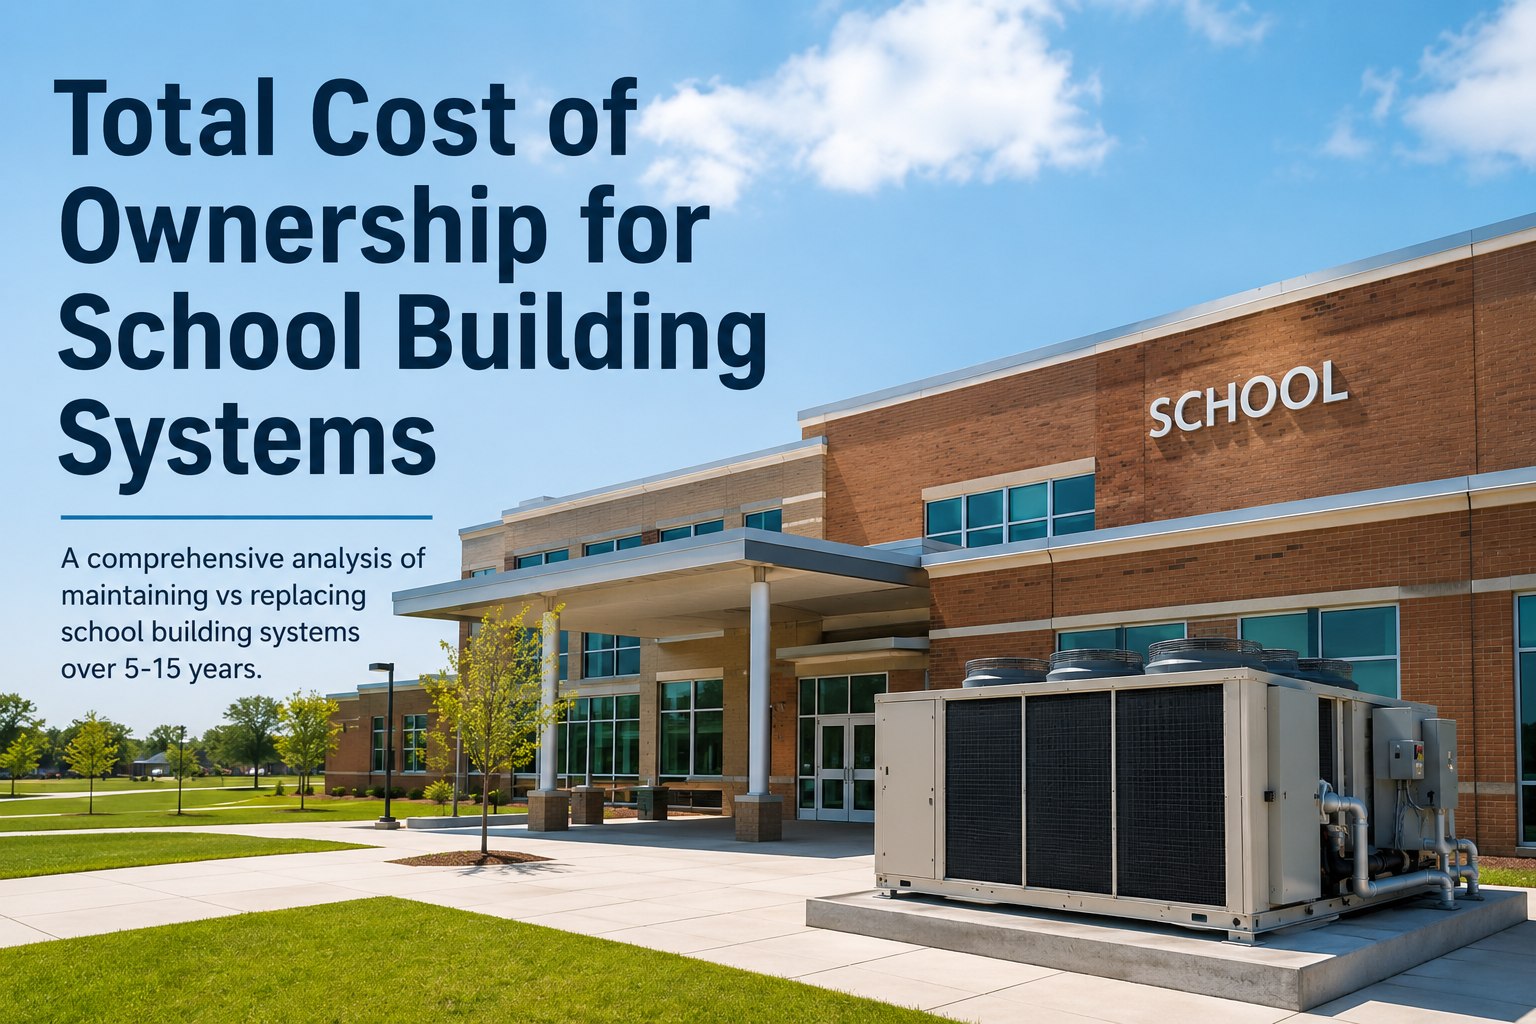
School districts routinely approve equipment based on the lowest sticker price, then spend the next two decades paying for that decision through rising energy bills, emergency repairs, and unplanned classroom closures. Total cost of ownership (TCCO) reframes procurement by adding energy, maintenance, downtime, and end-of-life disposal to the upfront purchase price across a 15- to 25-year horizon. For a mid-sized district operating 12 buildings, the gap between the cheapest boiler on install day and the cheapest boiler over its full lifecycle often exceeds $180,000. Our platform helps facilities teams build defensible TCO models in hours instead of weeks — Start Free Trial and turn next year's capital request into a finance-ready business case.
The cheapest chiller on install day is rarely the cheapest chiller over 25 years.
A full lifecycle model adds energy, labor, downtime, and disposal to the purchase price — giving your business office the numbers it needs to defend a replacement instead of another repair.
Purchase price is roughly 15% of what a school actually pays.
ASHRAE and IFMA lifecycle research consistently shows that for commercial HVAC systems, first cost represents only 10–20% of total spend over a 20-year service life — energy consumes 50–60%, maintenance and repair 15–20%, and the remainder is downtime, compliance, and disposal. A district that buys strictly on lowest bid is optimizing for the smallest slice of the pie.
- Energy & utilities 55%
- Maintenance & repair 20%
- Downtime & disruption 15%
- Purchase & install 10%
Modeled 25-year TCO for a 200-ton air-cooled chiller serving an 85,000 sq ft high school. Energy at $0.11/kWh, 2,400 full-load equivalent hours.
Five cost streams every school business office should model.
A defensible TCO calculation is not a single number — it is the discounted sum of five cost streams over the asset's expected service life. The formula below is the same structure used in ISO 55000-aligned capital planning.
Purchase, delivery, installation, commissioning, permits.
kWh, therms, demand charges, water — discounted over service life.
Preventive labor, parts, contractor calls, escalating with age.
Lost classroom days, relocation cost, IT shutdowns, mold risk.
Decommission, refrigerant recovery, disposal, site restoration.
Where the hidden costs actually live, by system type.
Each building system has a different cost-aging profile. The table below shows typical 20-year TCO splits and the inflection year — the point at which annual maintenance begins to exceed the amortized cost of replacement.
| System | Typical life (yrs) | Energy share | Maint. share | Inflection year | Top hidden cost |
|---|---|---|---|---|---|
| Central chiller plant | 20–25 | 62% | 18% | Year 14 | Compressor rebuild + refrigerant recovery |
| Hot-water boiler | 22–30 | 68% | 14% | Year 16 | Heat-exchanger de-scaling & stack repair |
| RTU / rooftop unit | 12–18 | 54% | 24% | Year 11 | Coil corrosion + economizer failure |
| Low-slope roofing | 20–30 | 12% | 28% | Year 18 | Leak detection + insulation saturation |
| BAS / controls | 10–15 | 31% | 22% | Year 9 | Protocol obsolescence + re-commissioning |
| Lighting (LED + drivers) | 10–15 | 74% | 9% | Year 12 | Driver failure + lumen-depreciation penalty |
A 200-ton chiller: maintain for 8 more years or replace now?
Consider a 14-year-old air-cooled chiller serving an 85,000 sq ft high school in a 2,400-equivalent-full-load-hour climate. The compressor has logged 47,000 run-hours, refrigerant leaks have doubled year-over-year, and the business office is weighing a $28,000 compressor rebuild against a $148,000 high-efficiency replacement.
Rebuild & maintain
- $28KCompressor rebuild + refrigerant top-off
- $46K/yrEnergy at 1.15 kW/ton (degraded efficiency)
- $11K/yrMaintenance, rising 9% annually after year 15
- 3 days/yrEstimated unplanned downtime (mold risk in August)
Replace with high-efficiency unit
- $148KNew chiller, install, commissioning, controls integration
- $31K/yrEnergy at 0.78 kW/ton + utility rebate of $14K
- $6K/yrMaintenance under warranty for years 1–3
- <0.5 days/yrDowntime risk, with 10-yr compressor warranty
Replacement saves $133,500 over 8 years and cuts annual energy by 33%. Even without the rebate, the payback crossover occurs in year 4. The maintain option crosses its inflection point at year 16, after which every additional service year costs more than the amortized replacement.
How costs shift across a 25-year asset life.
TCO is not flat — it curves. Energy dominates early, maintenance accelerates after the inflection year, and end-of-life costs spike in the final 10% of the asset's life. Planning around these curves is what separates proactive districts from reactive ones.
Break-in & warranty
Lowest cost window. Energy dominates at 60–70% of annual spend. Maintenance is mostly preventive — filter changes, belt adjustments, sensor calibration. Capture baseline kWh/ton here; every future comparison depends on it.
Stable operation
Energy still leads, but wear parts begin to fail — contactors, valves, bearings. Maintenance holds flat if PM discipline is strong; without it, costs climb 4–6% per year. This is the window where retro-commissioning pays back fastest.
Inflection & decline
Efficiency drops 8–15% as heat exchangers foul, seals degrade, and controls drift. Annual maintenance crosses the amortized cost of replacement. Downtime events double. This is where the maintain-vs-replace decision must be made — not deferred.
End-of-life
Catastrophic-failure risk spikes. Refrigerant recovery, crane rental, asbestos abatement, and classroom relocation costs pile on. End-of-life disposal alone can reach 8–12% of lifetime TCO. Plan replacement 24 months ahead — emergency swaps cost 30% more.
Build your next capital request on numbers finance can't argue with.
Plug real energy, maintenance, and downtime data into a TCO model your business office will actually approve.
TCO questions school facilities directors ask first.
What discount rate should a school district use in a TCO model?
Most public-school business offices use a 3–5% real discount rate, aligned with their bond cost of capital or the EPA's social discount rate guidance for public infrastructure. Use a consistent rate across every comparison so the maintain-vs-replace decision isn't distorted. Higher rates favor deferral; lower rates favor replacement — model both endpoints.
How do we quantify downtime cost for a classroom building?
Start with $0.30–$0.45 per square foot per day of lost instructional time, plus relocation cost if classes must move, plus IT shutdown risk for server rooms and science labs. A two-day August chiller failure in a 85,000 sq ft high school typically costs $51,000–$76,000 in combined disruption, mold remediation risk, and staff time. You can model this precisely in our platform — Book a Demo and we'll walk through your building's numbers.
When does maintaining an aging system become more expensive than replacing it?
The inflection point is typically 60–70% of expected service life — around year 14 for a chiller, year 16 for a boiler, and year 11 for a rooftop unit. You'll see it as annual maintenance spend crossing the amortized annual cost of a new unit. Once efficiency has dropped 10% and unplanned downtime exceeds two days per year, the math almost always favors replacement.
Should TCO include utility rebates and incentive programs?
Yes — rebates directly reduce C_acq and can shift a borderline replacement into clearly positive territory. Document them as a negative line item in the acquisition cost stream, not as energy savings. Most utility programs cap rebates at 50–75% of incremental upgrade cost, and they expire — model them as time-bound, not perpetual.
How long does it take to build a defensible TCO model for one building system?
With asset history, energy bills, and maintenance logs in hand, a single-system TCO model takes 4–6 hours in a spreadsheet. With our platform, the same model builds in under 30 minutes because energy, work-order, and meter data flow in automatically. You can model all six major systems in a building in a single afternoon and present a capital plan finance can defend.
Turn next year's capital plan into a finance-ready TCO case.
Import asset history, energy data, and work orders — then export a TCO model your business office will actually approve.
Free 14-day trial · No credit card