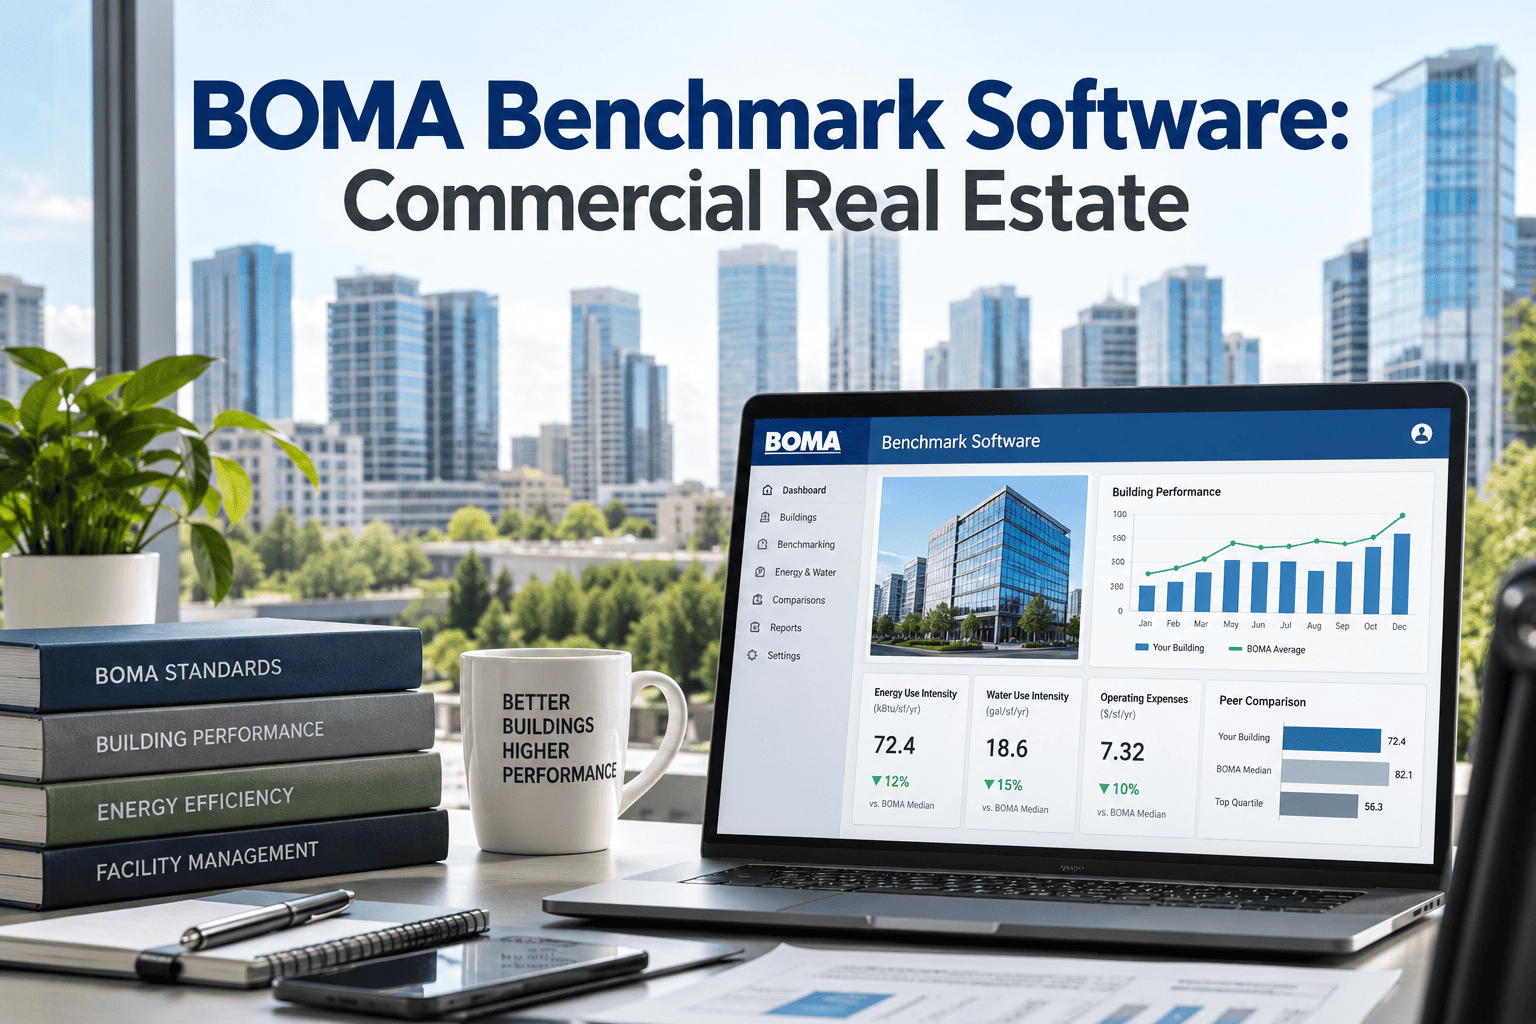
A property manager preparing next year's operating budget for a mid-size office asset faces a familiar question: are these expenses actually competitive, or just familiar? Without an outside reference point, familiar and efficient get treated as the same thing, and a budget built on last year's number quietly locks in whatever inefficiency was already sitting inside it. BOMA benchmark software pulls a building's income and expense figures directly against the Experience Exchange Report dataset covering thousands of properties across hundreds of markets, showing exactly where a line item sits high, low, or right at the market median. Sign up free and run your first comparison this week.
BOMA Benchmark Software for Commercial Real Estate
Compare your building's operating expenses against BOMA Experience Exchange Report data by market, submarket, and building class, and turn budget season into a data-backed conversation instead of a guessing game built on last year's spreadsheet.
The Experience Exchange Report has tracked commercial property performance for over a century, and it remains the reference point owners, managers, and lenders use to judge whether a building's operating budget is reasonable. Comparing your own numbers against it changes three conversations at once.
U.S. private-sector office buildings report a fairly consistent expense structure across the Experience Exchange Report dataset. Seeing your own building's split against this structure is usually the fastest way to spot an outlier category.
| Category | Market median (psf) | Above median flag | Typical action |
|---|---|---|---|
| Utilities | $2.16 | 10%+ above | Energy audit, retro-commissioning |
| Repairs and maintenance | $2.00 | 15%+ above | Shift reactive work to preventive |
| Cleaning | $1.52 | 10%+ above | Rebid contract, adjust scope |
| Administrative | $1.45 | 20%+ above | Review staffing and overhead allocation |
| Security | $0.72 | 15%+ above | Evaluate coverage hours versus risk profile |
A single quarter above the median is not automatically a problem, since building age, class, and market can all shift the fair comparison point. A category running consistently high across four or more consecutive quarters is the pattern worth a closer look, and it is usually easier to explain to an owner or lender once it has been tracked over that longer window rather than reacted to in isolation.
Benchmarking against BOMA Experience Exchange Report data only works as well as the expense categorization feeding it, which is the detail most property teams underestimate when they start. If repairs and maintenance in your own accounting system quietly includes janitorial supplies, or if utilities is bundled together with roads and grounds, every comparison against the benchmark will be distorted before it even starts. Property teams that get real value from benchmarking usually spend the first quarter simply mapping their chart of accounts to match the standard categories, which feels like unglamorous groundwork but determines whether every comparison afterward is trustworthy, and it only needs to be done once for the mapping to keep paying off every future budget cycle.
Building class and age matter more than most property managers initially assume when reading a benchmark report. A twenty-five-year-old Class B building in a secondary market will never post the same utilities figure as a five-year-old Class A tower with a modern building automation system, and treating both against the same flat median produces misleading conclusions in either direction. The Experience Exchange Report dataset allows filtering by building size, class, and market for exactly this reason, and skipping that filtering step is the single most common way property teams end up chasing a benchmark that was never a fair comparison to begin with.
Utilities remains the category where active benchmarking tends to pay off fastest, largely because energy waste is easy to overlook day to day but shows up immediately once a building's cost per square foot is placed next to comparable properties. A documented industry analysis found that utility expenses accounted for roughly two-thirds of a broader operating expense reduction achieved across benchmarked properties in a single year, driven mainly by retro-commissioning, control system tuning, and lighting upgrades that individually seem minor but compound across a full building's square footage. Property teams that start their benchmarking effort with utilities usually see the fastest return on the time invested.
Occupancy and space utilization figures deserve a place in the same benchmarking exercise as operating expenses, because a building running lean on square feet per tenant employee is often also running efficient on a per-square-foot operating cost basis, and the two figures reinforce each other in a budget conversation. Comparing occupancy against the roughly 96 to 97 percent average seen across the benchmarked private-sector dataset gives owners a second reference point beyond raw dollars, useful for spotting a building that looks efficient on cost alone but is actually under-occupied and masking the real per-tenant expense picture.
A benchmarking effort can produce confident but wrong conclusions when the comparison itself is flawed. These are the errors that show up most often once property teams start pulling BOMA Experience Exchange Report data into their own budget review.
Lenders and appraisers already use Experience Exchange Report data as a reference point when underwriting acquisitions and refinances, which means a building owner who benchmarks proactively is speaking the same language the other side of the table is already using. Showing up to a refinance conversation with a building's operating expenses already mapped against the market median, submarket by submarket and category by category, shifts the tone of that conversation considerably. Instead of a lender's underwriting team flagging an unexplained expense line during their own diligence, the owner has already identified it, explained the driver, and in many cases already started correcting it, which reads very differently in a credit committee memo.
Portfolio owners managing a mix of building classes and vintages often find the most value not in any single benchmark comparison but in watching how each property's position relative to the median shifts over time. A building that sits comfortably at the market median for three years and then drifts ten percent above it over two quarters is telling a very specific story, usually a maintenance backlog building up, a vendor contract that has gone unreviewed, or an operational change like reduced staffing that is quietly shifting costs elsewhere. Tracking that trajectory building by building turns benchmarking from an annual budget exercise into an early warning system that catches problems while they are still cheap to fix.
The categories that resist easy benchmarking, such as roads and grounds or parking, are often the ones property teams skip entirely, but they can still reveal useful patterns even with less standardized reporting across the industry. A parking expense running well below the market figure might reflect a genuinely efficient operation, or it might reflect deferred striping, lighting repair, and structural maintenance that will eventually show up as a much larger capital expense. Treating every category as worth at least a light annual review, even the smaller ones that rarely drive the headline budget number, closes a gap that purely dollar-driven benchmarking programs tend to leave open.