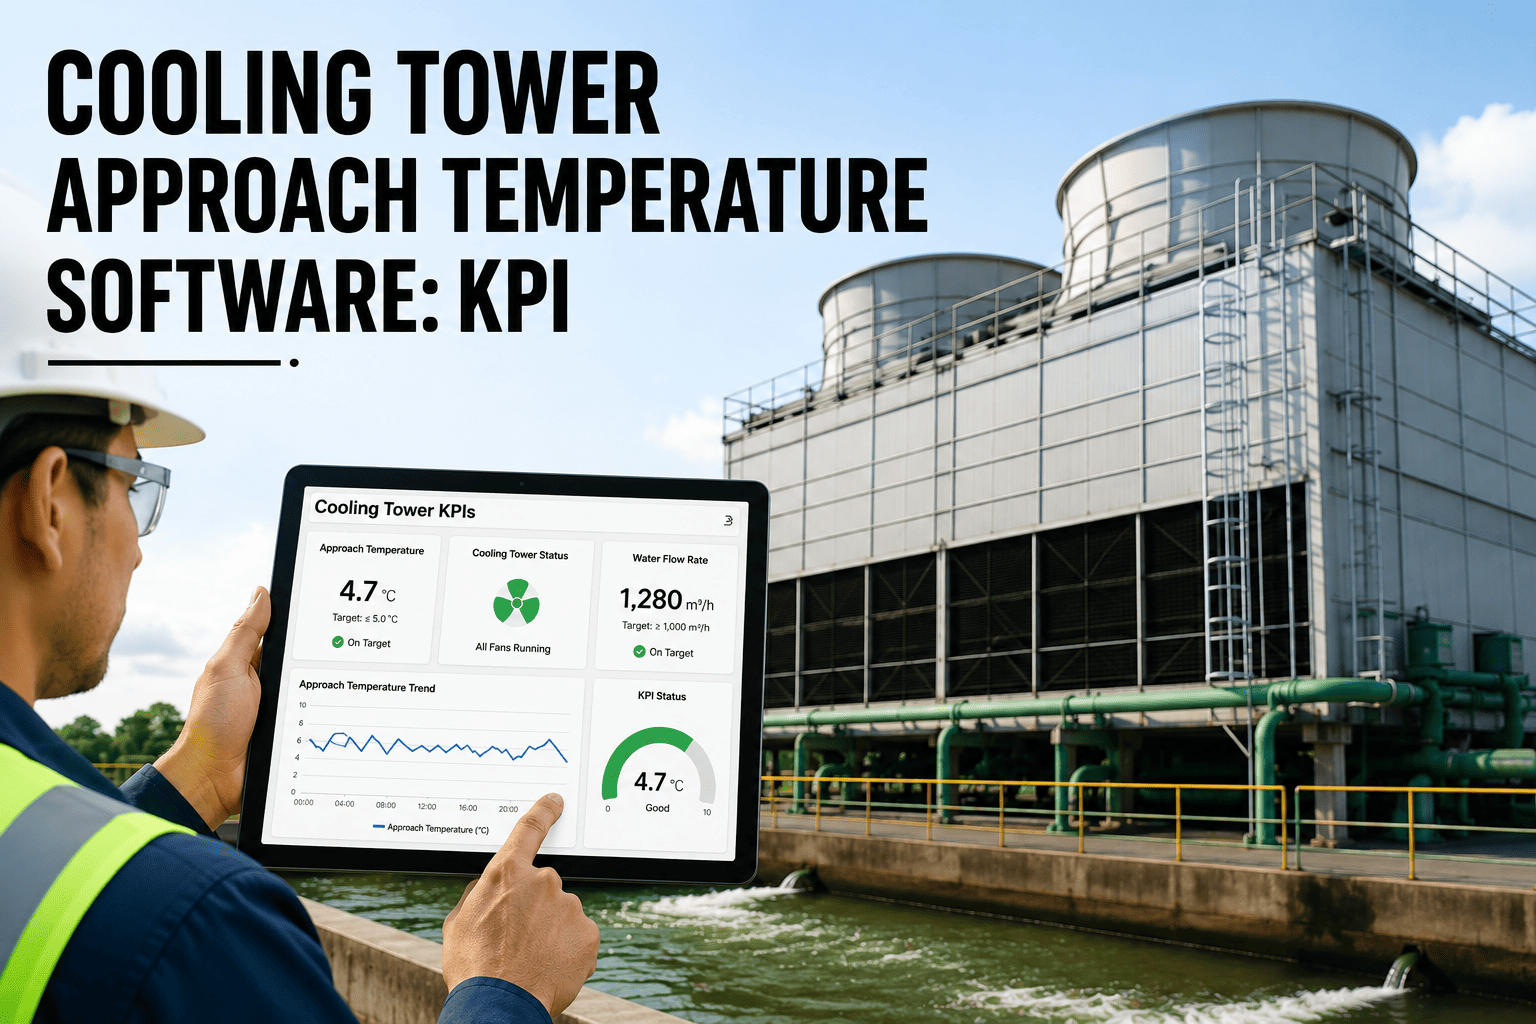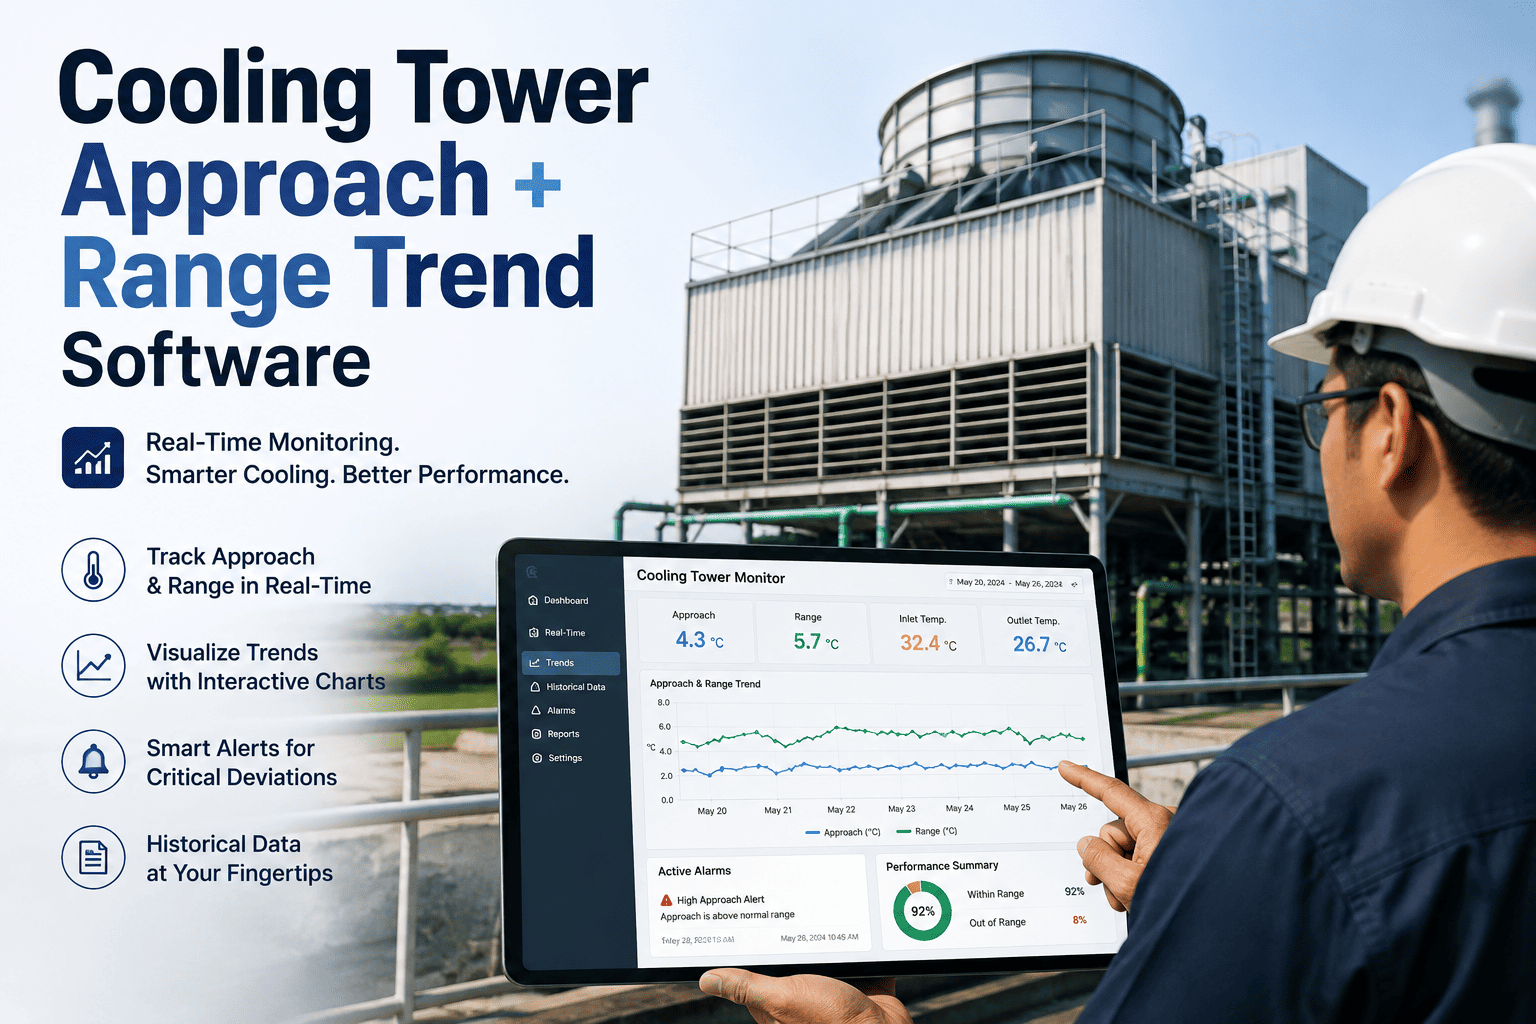
Cooling towers rarely fail overnight — they drift. A half-degree of approach creep this month becomes a two-degree loss of capacity by the time compressors start short-cycling and chillers pull extra amperage just to hit setpoint. Most facility teams still log range and approach on a clipboard once a shift, which means the drift stays invisible until the energy bill spikes or a chiller trips on high head pressure. Cooling tower CMMS software that trends approach and range continuously turns that clipboard reading into a rolling performance curve, flagging fouling and scaling weeks before they cost real money. Facilities running continuous trend monitoring catch thermal performance loss well before it shows up as downtime. You can visit app.oxmaint.ai to see how approach and range trending plugs directly into your existing work order system.
Is your cooling tower losing capacity one degree at a time?
Approach and range are the two numbers that tell you exactly how well your cooling tower is transferring heat. Left to manual log sheets, small drifts hide for weeks. A CMMS that trends both metrics against wet-bulb conditions catches scaling, fouling, and fan degradation while the fix is still a five-minute adjustment instead of a weekend outage.
What untracked approach and range drift actually costs
A mid-size chilled water plant running two 500-ton towers can lose thousands of dollars a month to thermal performance decay that never shows up on a maintenance calendar because nothing is tracking the trend line. Here is where the loss accumulates.
Approach and range, and why the trend matters more than the reading
A single reading tells you the tower's condition at one moment. A trend line tells you whether the tower is healthy or quietly failing. The formula below is what cooling tower trend software calculates every time a new reading lands.
Five-stage approach and range trend workflow
Each stage feeds the next, so a single missed reading does not break the trend line — it just gets flagged and backfilled before the weekly rollup.
Reading capture
Technicians log hot water, cold water, and wet-bulb temperatures from a mobile checklist tied to the tower asset, or the CMMS pulls the same values automatically from a connected BMS or IoT sensor feed.
Automatic normalization
Every reading is converted into approach and range values and normalized against outdoor wet-bulb conditions at the time of capture, so a hot afternoon reading is never compared unfairly against a cool morning one.
Rolling trend line
The CMMS plots a rolling 30, 60, and 90-day trend for each tower, so a facility manager can see whether approach is climbing steadily rather than just spiking on one hot day.
Deviation alert
When approach exceeds the design threshold for three consecutive readings, or range drops sharply at a stable load, the system auto-generates a work order and routes it to the assigned technician.
Root cause and closeout
The technician logs findings — scale, fouled fill, belt slip, low flow — against the work order, and the fix is timestamped on the same trend chart so the next reading confirms whether performance recovered.
Manual log sheets vs. trend-based cooling tower software
The gap is not just data entry time — it is whether a facility team can see a problem coming instead of reacting to it.
| Monitoring Dimension | Manual Log Sheets | Trend Software |
|---|---|---|
| Reading frequency | Once per shift, often skipped during peak season | Continuous or per-checklist, never skipped once configured |
| Wet-bulb normalization | Rarely calculated in the field | Automatic, applied to every single reading |
| Drift detection | Caught only if someone compares sheets by hand | Automatic alert after threshold is crossed |
| Root cause visibility | Findings live in a separate paper work order | Findings timestamped directly on the trend chart |
| Seasonal comparison | Nearly impossible across binders of logs | One-click 12-month overlay by tower |
| Typical detection lag | Weeks to a full season | Days once threshold logic is tuned |
A 500-ton tower, six weeks, one avoided compressor overload
A campus chilled water plant running continuous approach and range trending on both of its towers caught a fouling event well before it reached the chiller.
The trend software flagged the climbing approach in week four, two full weeks before the chiller would have hit its high head-pressure lockout. A technician was dispatched with a targeted work order referencing the exact deviation, cleaned the fill, and confirmed recovery on the next scheduled reading. No emergency callout, no unplanned chiller downtime, and no guesswork about which tower or which stage of fouling was responsible.
Stop finding out about fouling from your energy bill.
Trend approach and range continuously and catch thermal performance loss weeks before it becomes an unplanned outage.
Cooling tower trend software setup checklist
These eight steps get a tower from a blank asset record to a fully alerting trend line. The CMMS automates items 1 through 5; items 6 through 8 need a one-time engineering decision.
Asset and design baseline
Tower nameplate design approach, range, and flow rate are entered once and stored against the asset record.
Reading checklist template
A mobile checklist prompts hot water, cold water, and wet-bulb readings at the interval you set, per tower.
Automatic normalization
Every reading is converted into approach and range and stored against the same rolling trend chart automatically.
Threshold-based alerting
Alerts fire when approach exceeds tolerance for consecutive readings, not on a single noisy data point.
Work order auto-generation
A flagged deviation opens a work order referencing the exact reading and trend chart, ready for dispatch.
Tolerance tuning
Engineering sets the acceptable approach band per tower based on design conditions and site history.
Seasonal review cadence
A quarterly review compares the current trend against last year's same-season data for the same tower.
Root cause sign-off
The technician's logged finding is reviewed and closed out only once the following reading confirms recovery.
Cooling tower approach and range trending, answered
The questions facility and reliability engineers ask most before moving off manual log sheets.
Do we need IoT sensors, or can technicians keep logging readings manually?
Either works. Manual readings entered through a mobile checklist still build a full trend line, sensors just remove the shift-based gaps. Most facilities start manual and add sensors later. You can see both setups by visiting app.oxmaint.ai.
How is approach different from just watching supply water temperature?
Supply temperature alone hides the effect of outdoor conditions. Approach subtracts the wet-bulb temperature, so a facility can tell true tower degradation apart from a simply hot, humid day.
What threshold should trigger an alert for approach creep?
Most towers alert well at 2 to 3°F above design approach sustained across three consecutive readings. Tighter thresholds catch issues earlier but need more tuning to avoid noisy false alerts.
Can one dashboard trend multiple towers across different buildings?
Yes. Each tower keeps its own design baseline and threshold, and a portfolio view rolls every tower's current approach and range status into a single facility-wide dashboard.
How long before we see a usable trend line after setup?
A meaningful trend usually appears within two to three weeks of consistent readings. Book a walkthrough at calendly.com/oxmaintapp/30min to see a live tower dashboard from an active deployment.
Turn every cooling tower reading into an early warning.
See approach and range trend continuously, catch drift weeks earlier, and keep chillers off the emergency call list.
Free 14-day trial · No credit card