A 1.1-million-square-foot corporate campus was spending well above the industry benchmark on cooling tower energy every summer, with fouled fill media, drifting fan belts, and delayed water treatment adjustments quietly inflating the chiller plant's electricity draw month after month. The facility team could see the utility bills climbing but had no reliable way to pinpoint which asset, which shift, or which failure pattern was driving the waste. After a phased rollout of an AI-powered CMMS, the facility cut cooling tower energy consumption by 24% within a single cooling season and avoided more than $340,000 in annual utility spend. This case study breaks down exactly how predictive maintenance, sensor-driven scheduling, and automated work orders got them there, using CMMS software built for cooling energy management.
Case Study / Energy Performance
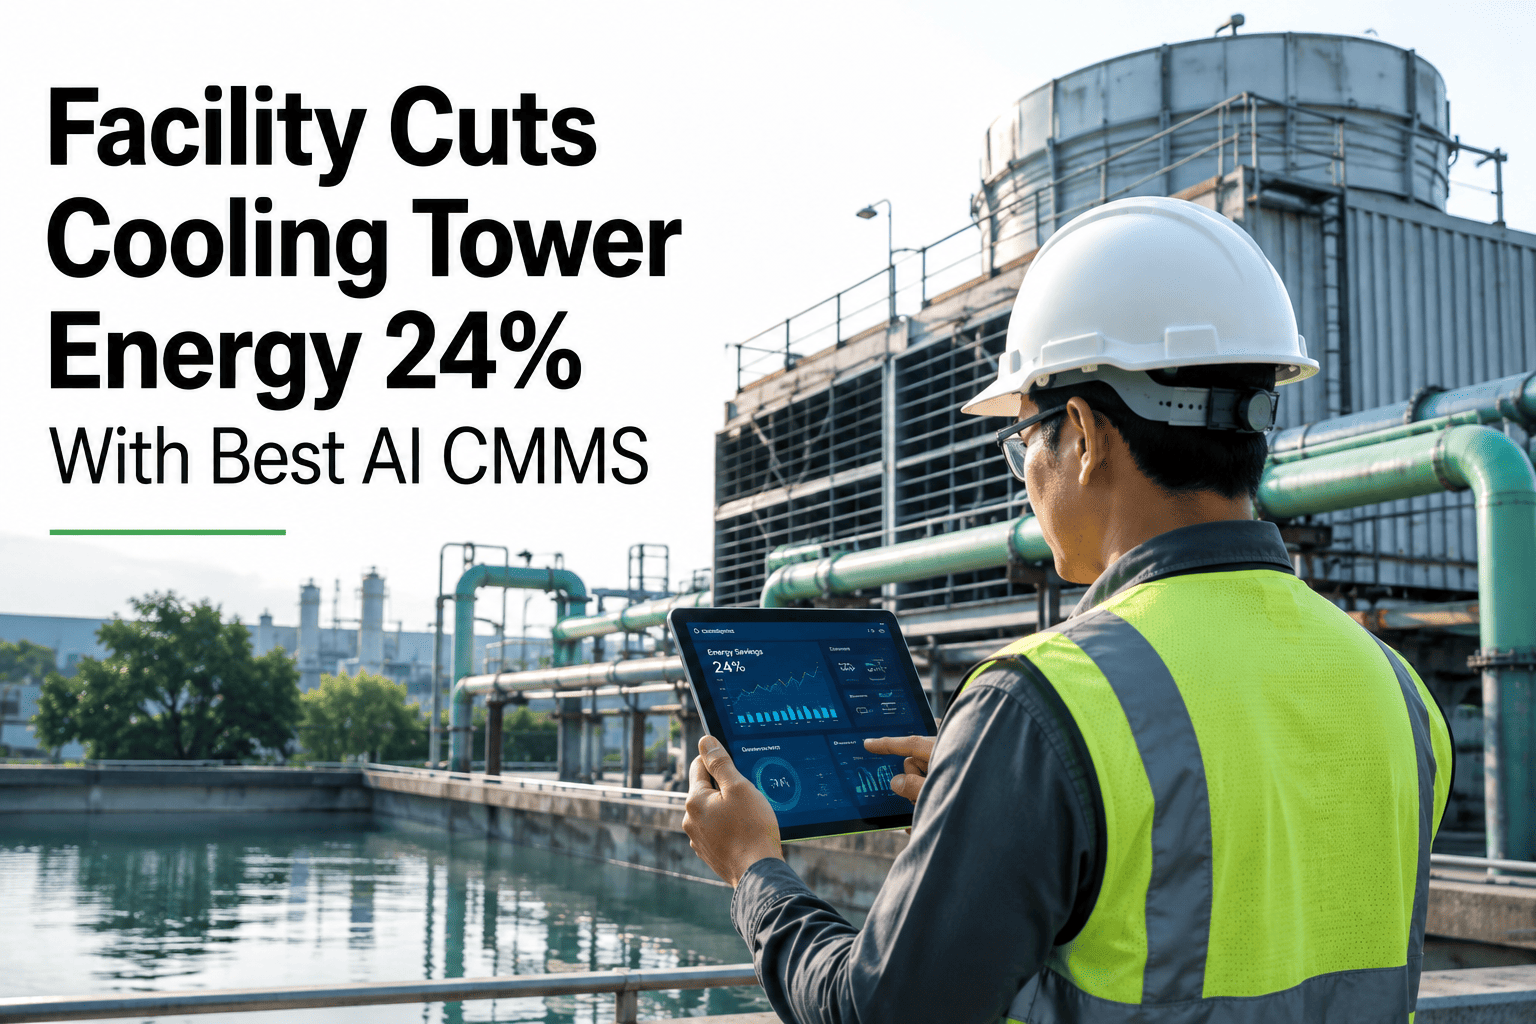
Facility Cuts Cooling Tower Energy 24% With AI CMMS
A 60-day predictive maintenance rollout that turned a 1.1M sq ft campus's cooling plant from a reactive cost center into a measurable energy-savings program.
24%
Cooling tower energy reduction
$340K
Annual utility savings
1.1M
Square feet under management
Why Cooling Towers Quietly Drain Energy Budgets
Cooling towers rarely fail all at once. Fill media fouls gradually, fan belts drift out of tension, and water treatment dosing slips out of range days before anyone notices a spike on the utility bill. Each of these small drifts forces the chiller plant to work harder for the same cooling output, and by the time facility staff notice the pattern, weeks of excess energy have already been consumed. Most teams only find out during a monthly utility review, long after the waste has compounded.
30-40%
Of chiller plant energy waste traces back to undetected cooling tower fouling and drift
3-6 wks
Typical lag between a cooling tower performance drift and staff noticing it on utility bills
How the 24% Reduction Happened
01
Days 1-15 — Baseline Audit and Sensor Install
The team mapped every cooling tower cell, pump, and chiller into the CMMS asset register and installed approach-temperature and vibration sensors to establish a real performance baseline instead of relying on manufacturer defaults.
02
Days 16-30 — Predictive PM Scheduling Activated
Fixed-interval fill cleaning and belt inspections were replaced with condition-based schedules, triggered only when sensor readings actually drifted outside optimal range.
03
Days 31-45 — Automated Fouling and Vibration Alerts
Work orders started generating automatically the moment fill fouling or fan belt vibration crossed a set threshold, cutting the detection-to-repair window from weeks to hours.
04
Days 46-60 — Energy Dashboard and Dosing Automation Live
A live energy dashboard tied cooling tower performance directly to kWh consumption, and water treatment dosing was automated to hold conductivity and pH inside the efficient operating band.
See What a Predictive Cooling Program Looks Like on Your Assets
Walk through the same rollout sequence with your own cooling tower and chiller plant data.
What Changed on the Ground
01
Predictive Fill Cleaning Schedules
Cleaning cycles shifted from calendar-based to condition-based, cutting unnecessary cleanings while catching fouling before it hit fan energy.
02
Vibration-Triggered Belt Replacement
Fan belts were replaced based on vibration signatures instead of run hours, preventing the slow efficiency loss of a drifting belt.
03
Automated Water Treatment Dosing
Chemical dosing adjusted automatically to hold conductivity in range, protecting heat transfer efficiency across every tower cell.
04
Real-Time Approach Temperature Tracking
Live approach-temperature monitoring flagged performance drift days earlier than a monthly utility bill ever could.
Before and After: The Numbers That Moved
| Metric |
Before AI CMMS |
After AI CMMS |
| Cooling tower energy use |
Baseline |
Down 24% |
| Unplanned chiller plant downtime |
9 hrs/month |
2 hrs/month |
| Water treatment adjustment lag |
2-4 days |
Under 2 hours |
| Average approach temperature |
7.8°F |
5.1°F |
| Annual cooling utility spend |
Full rate |
$340K lower |
Swipe horizontally on mobile to view the full comparison
Where the $340,000 in Savings Came From
Reduced emergency repairs
Water treatment efficiency
Frequently Asked Questions
How does an AI CMMS actually reduce cooling tower energy use?
It replaces fixed-interval maintenance with condition-based triggers from sensor data, so fill cleaning, belt replacement, and dosing adjustments happen exactly when performance drifts rather than on a generic calendar. Learn more with a
live demo walkthrough.
How long does it take to see measurable energy savings?
This facility saw its full 24% reduction within one cooling season, with the first improvements visible around day 30 once predictive PM schedules and alerts went live. Most facilities following a similar rollout see early gains within the first month.
What data sources feed the predictive maintenance alerts?
Approach temperature, vibration, and water chemistry sensors feed directly into the CMMS, which correlates readings against each asset's maintenance history to flag drift before it shows up as wasted energy.
Can this case study playbook apply to smaller facilities?
Yes. The same four-phase sequence, baseline audit, predictive scheduling, automated alerts, and dashboard rollout, scales down to single-tower operations just as it scaled up on this 1.1M sq ft campus.
Sign up free to map it to your own site.
Is a $340,000 savings figure typical across facility sizes?
The dollar figure scales with cooling load and local utility rates, but the underlying percentage reduction, roughly 20-25% of cooling tower energy, has held consistent across comparable campus-scale rollouts.
Ready to Write Your Own Energy Savings Case Study?
Join facility teams turning cooling tower maintenance from a reactive cost center into a measurable, reportable energy-savings program.