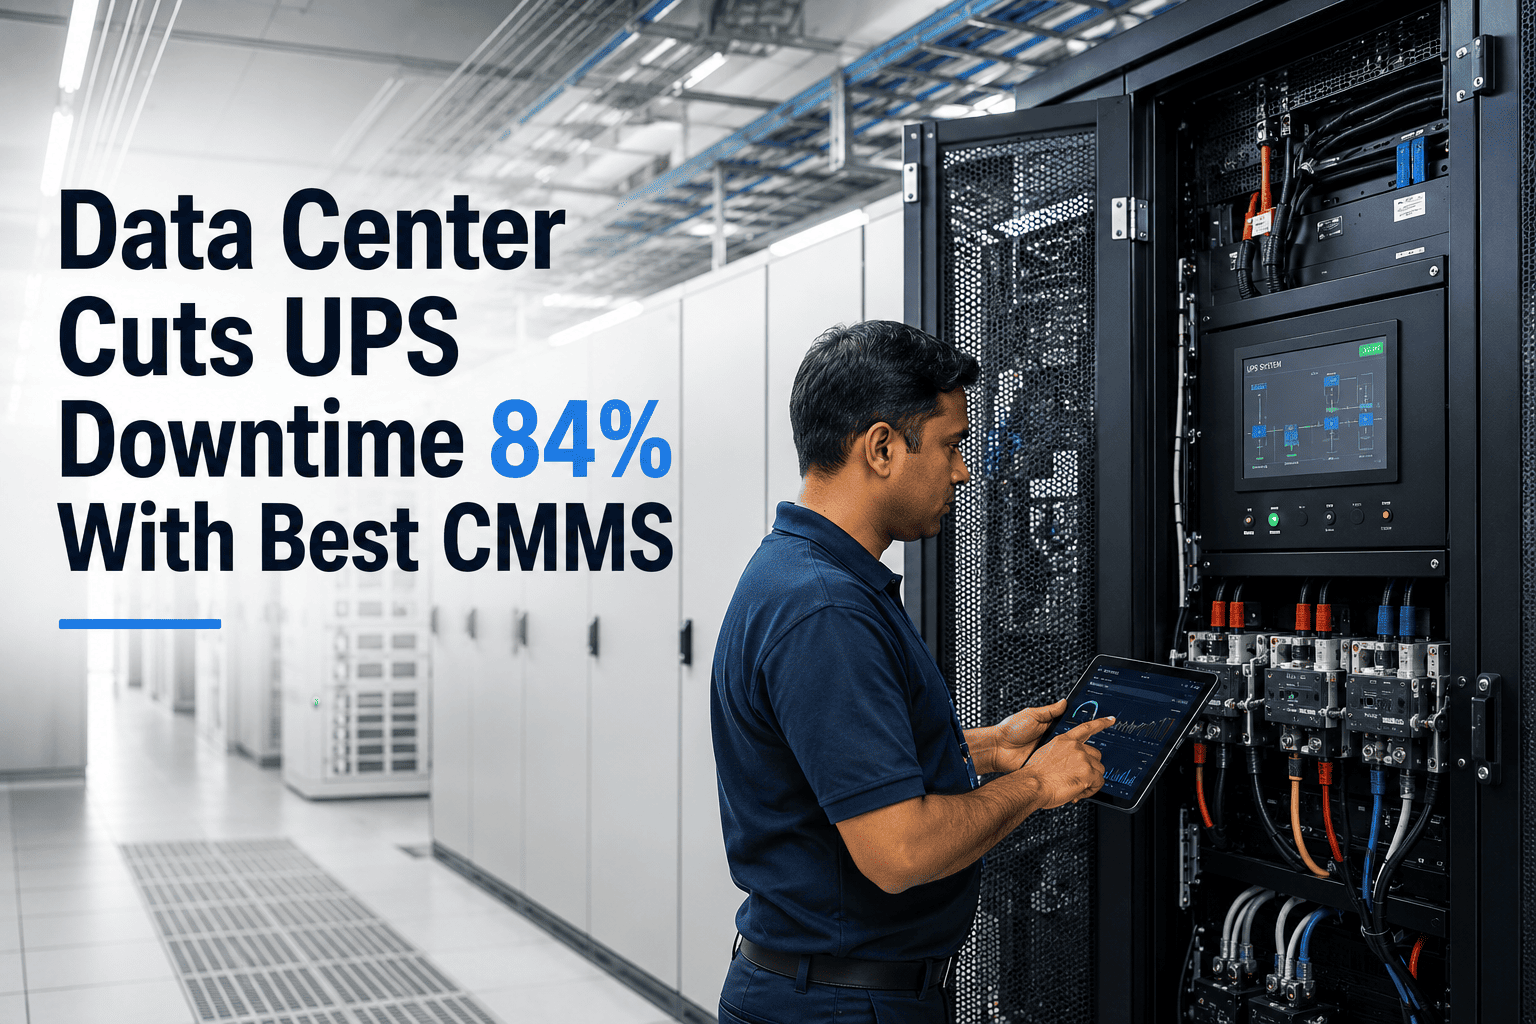
Unplanned UPS events are the single biggest reason data centers go dark — industry outage tracking consistently points to power-chain failures, most often tied to UPS batteries, capacitors, and transfer switches, as the leading cause of serious incidents. This case study follows a 42MW Tier III colocation facility in the U.S. Southeast that was averaging six UPS-related incidents a year, each one triggering client SLA penalties and emergency vendor callouts. Over a 14-month rollout of a modern CMMS-driven maintenance program, the facility cut UPS-related downtime by 84% and avoided an estimated $2.1M in annual outage and repair costs. Below is the exact breakdown of what changed, in what order, and why — starting with the numbers, and ending with how you can review the same playbook on OxMaint.
Data Center Cuts UPS Downtime 84% With a CMMS-Led Maintenance Overhaul
How a 42MW Tier III colocation site turned six UPS incidents a year into less than one, and converted the savings into a $2.1M annual cost avoidance figure the finance team could actually defend.
The Problem: Reactive Maintenance on Mission-Critical Power
The facility ran a conventional 2N UPS topology with lead-acid strings and quarterly vendor inspections — a setup that looked sound on paper but left long gaps between the point a cell started degrading and the point anyone noticed. Maintenance was tracked in spreadsheets and vendor PDFs, so nobody had a single view of battery age, discharge history, or which strings were approaching end of life. Three of the six annual incidents traced back to the same root cause: batteries that failed a load test the facility didn't know was overdue.
The 14-Month Rollout
The facility didn't rebuild its power chain — it rebuilt the maintenance program around it. The rollout was sequenced deliberately so the highest-risk gap, battery visibility, closed first.
This Same Root-Cause Visibility Is What Most UPS Incidents Are Missing
The facility didn't need new hardware to cut downtime 84% — it needed one system that could see battery age, PM status, and sensor data in the same place. That's the gap a CMMS is built to close.
Before vs After: The 12-Month Comparison
The clearest way to see the impact is side by side — the same facility, the same UPS hardware, measured a year apart.
| Metric | Before (Baseline Year) | After (Month 14) |
|---|---|---|
| UPS-related incidents | 6 per year | 1 per year |
| Average downtime per incident | 47 minutes | 12 minutes |
| Battery load-test compliance | 61% on schedule | 98% on schedule |
| Mean time to detect degradation | Weeks (next inspection cycle) | Under 24 hours |
| Emergency vendor callouts | 9 per year | 2 per year |
| Audit documentation prep time | 3–4 days per review | Same-day export |
Where the $2.1M Came From
The savings figure wasn't a single line item — it was five smaller categories that added up once downtime, labor, and parts spend all started moving in the same direction.
Facility Team Takeaway
We weren't short on maintenance activity before this — we were short on visibility. Quarterly inspections gave us a false sense of coverage because a battery string could fail a load test two months after the last check and nobody would know until it dropped under load. Moving PM and sensor data into one system meant the failure showed up as a work order, not an outage. That's the entire difference between six incidents a year and one.
Frequently Asked Questions
Your UPS Downtime Is Probably a Visibility Problem, Not a Hardware Problem
If battery load tests, PM schedules, and sensor alerts all live in different places today, that gap is exactly where the next unplanned outage will come from. See what a centralized maintenance record looks like for your own power chain — start free or walk through it live.