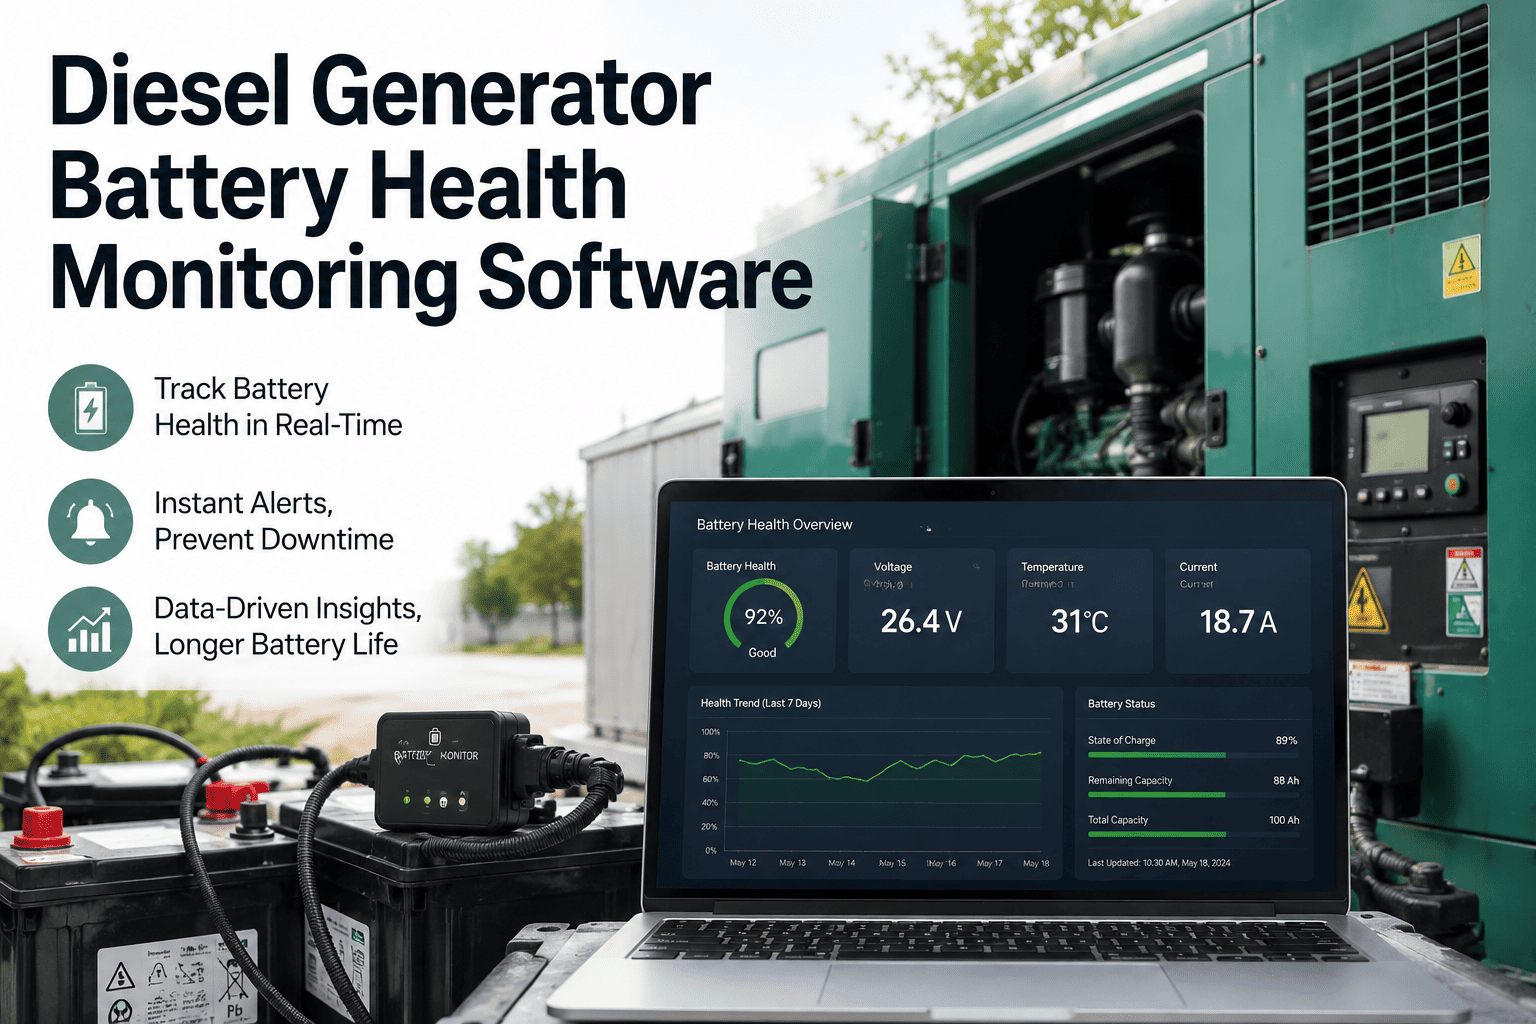
Diesel generator batteries fail silently. A DG can pass every scheduled load test and still refuse to crank the moment mains power actually drops, because a simple voltmeter reading cannot reveal internal resistance, sulfation, or cell-level imbalance building up between visits. Facility teams that rely on paper battery logs typically discover a weak battery bank only after a failed start during a real outage — the one moment failure is not an option. In 2026, IoT-based battery health monitoring closes that gap by continuously reading cell voltage, temperature, and internal impedance instead of waiting for the next scheduled inspection. This guide breaks down what actually predicts a failed start, how continuous monitoring compares to manual testing, and how facility teams are cutting DG start failures with monitoring built directly into their CMMS. If your team is still logging battery checks on paper, start a free trial or book a demo to see continuous battery health monitoring inside OxMaint.
Battery Health Monitoring · DG Readiness · 2026
Diesel Generator Battery Health Monitoring Software That Catches a Weak Battery Before It Costs You an Outage
Continuous cell voltage, temperature, impedance, and ripple current data — turned into readiness scores and work orders long before a weak battery ever leaves your DG unable to start when it matters most.
42%
Of failed generator starts trace back to battery condition rather than an actual engine or fuel fault
3–5 yrs
Typical service life of a DG starting battery before internal resistance begins rising sharply toward end of life
90 sec
Window a data center or hospital DG has to start before backup runtime is at risk
24/7
Continuous monitoring coverage vs. a single monthly or quarterly manual check
The Blind Spot
Why a Passed Voltage Check Does Not Mean Your DG Battery Will Start the Generator
A healthy-looking terminal voltage reading is one of the least reliable indicators of starting capacity. As lead-acid or VRLA cells age, internal resistance climbs long before resting voltage drops — which means a battery can read 12.6 volts on a clipboard check and still fail to deliver enough cranking current under load. Specific gravity, cell temperature, and electrolyte condition all shift independently of one another, and none of them show up during a five-minute manual inspection. That is exactly why facilities that rely only on scheduled visual checks are consistently the ones surprised by a failed start during an actual utility outage. Battery degradation is a slow, cumulative process, and a snapshot reading taken once a month can only ever tell you what the battery looked like at that single moment — not what it is doing for the other twenty-nine days in between, which is precisely when most of the damage actually happens. The four hidden risks below are the ones a continuous monitoring program is specifically designed to surface early.
Hidden Risk
Rising Internal Resistance
Internal resistance increases as plates sulfate and grid corrosion sets in, reducing the current a battery can deliver in the first two seconds of cranking — the exact window that determines whether the engine turns over. This rise happens gradually over months, which is exactly why a trend line built from continuous readings catches it while a single test reading cannot.
Hidden Risk
Cell-Level Imbalance
In a multi-cell string, one weak cell can drag down the entire bank even while the pack-level voltage looks normal, because a single cell reading is averaged out across the rest of the healthy cells. Without per-cell visibility, a technician has no way to know which specific cell — or which specific battery in a bank of several — is the one actually driving the risk.
Hidden Risk
Temperature-Driven Aging
Every 8°C above the recommended operating range roughly halves expected battery life, yet ambient temperature inside a genset enclosure is rarely logged as part of a manual inspection round. Enclosures near rooftop units, direct sunlight, or poorly ventilated rooms often run hotter than technicians assume, quietly shortening battery life for years without anyone noticing.
Hidden Risk
Undetected Ripple Current
A faulty battery charger can push excess AC ripple into the battery bank, quietly accelerating plate degradation for months before any visible symptom appears on a routine walk-through. By the time swelling or leakage becomes visible to the eye, the underlying damage has usually already been building for a long stretch of time.
What To Actually Monitor
The Six Data Points That Predict a DG Battery Failure Before It Happens
Battery health monitoring software earns its value by tracking the variables that a clipboard round cannot capture continuously. These are the six signals that facility and reliability teams should expect any battery monitoring platform to surface in real time, mapped to what each one actually reveals about starting readiness. A platform that only reports resting voltage is not giving you battery health data — it is giving you a single, easily misleading number that misses almost everything that actually predicts a failed start.
Cell Voltage Under Load
Voltage measured while the starter draws current reveals true capacity far better than resting voltage, exposing weak cells that look fine at rest but collapse under a cranking load. This is the single closest proxy available for what actually happens the moment mains power fails and the generator is asked to start.
Internal Impedance / Resistance
The single strongest leading indicator of battery aging. A rising impedance trend over weeks gives a maintenance team a clear replacement window before a failure ever occurs, turning battery replacement into a planned line item instead of an emergency purchase order.
Ambient and Cell Temperature
Continuous temperature tracking flags enclosures running hot, charger faults, and thermal runaway risk in VRLA batteries long before it becomes visible or smells like a problem, giving a technician time to correct ventilation or charging issues before the battery itself is damaged.
Specific Gravity / State of Charge
For flooded lead-acid banks, electrolyte specific gravity confirms actual charge state, catching undercharging or sulfation trends that voltage alone will not reveal, and helping confirm whether a charger is correctly maintaining every cell across the entire string.
Charger Output and Ripple Current
Monitoring the float charger's output current and AC ripple identifies a failing charger before it silently cooks the battery bank it is supposed to be protecting, which is one of the most overlooked root causes of premature battery replacement across facility portfolios.
Cranking Event History
Logging every start attempt with cranking duration and current draw builds a trend line per battery bank, turning every generator test into a data point instead of a one-time pass or fail, and making a slowly lengthening crank time visible long before it becomes a full failure.
Approach Comparison
Manual Testing vs. Continuous IoT Monitoring — What Each Approach Actually Catches
Not every battery health method delivers the same warning window. The table below compares the most common approaches facility teams use today, scored against what actually causes DG start failures — and how much runway each method gives a team to act before a battery leaves a generator unable to start. Cost and labor intensity matter too, but the column that decides whether an outage becomes a non-event or a headline is warning window, which is why it sits at the far right of the comparison.
| Method |
Check Frequency |
Detects Internal Resistance |
Detects Cell Imbalance |
Detects Charger Faults |
Warning Window |
| Manual Voltmeter Round |
Weekly to monthly |
No |
No |
No |
None — reactive only |
| Scheduled Load Bank Test |
Quarterly to annual |
Partial |
Partial |
No |
A few weeks |
| Hydrometer / Specific Gravity |
Monthly |
No |
Yes — flooded cells only |
No |
A few weeks |
| Continuous IoT Monitoring |
Real time, every start |
Yes |
Yes |
Yes |
Weeks to months |
| Visual Inspection Only |
Ad hoc site visits |
No |
No |
No |
None — surface issues only |
Stop Guessing at Battery Health
See Real-Time Battery Data From Every Generator on One Dashboard
OxMaint connects to your existing battery monitoring and generator sensors and turns raw voltage, temperature, and impedance readings into a single readiness score per site — with a work order created automatically the moment a battery trends toward failure. No spreadsheets, no separate monitoring portal to check, and no technician has to remember to log a reading on a schedule.
The Failure Timeline
How a DG Battery Actually Degrades — From Healthy to a Failed Start
Battery failure is rarely sudden. It follows a predictable curve that continuous monitoring can catch at almost any stage — while a quarterly inspection typically only catches it at the last one. Understanding this curve is what separates a proactive replacement program from a reactive one, and it is the same curve every lead-acid and VRLA starting battery follows regardless of manufacturer or facility type.
01
Internal Resistance Begins Climbing
Plate sulfation starts increasing internal resistance while resting voltage still looks completely normal on a manual check. This is the earliest and most reliable point to schedule a replacement, and it is a stage that a monthly inspection almost always misses entirely.
02
Voltage Sags Under Cranking Load
The battery still starts the generator, but cranking time lengthens and the voltage dip under load deepens — a pattern only visible if start events are logged and trended over time rather than treated as an isolated pass or fail result.
03
Cell Imbalance Accelerates
One or more cells fall further behind the rest of the string, pulling down effective bank capacity faster than the average voltage reading suggests, and pushing the weakest cell closer to complete failure with every additional charge cycle.
04
Failed or Marginal Start
The battery either fails to crank the engine or barely succeeds — often during the exact moment mains power has already been lost, when there is no scheduled maintenance window left and no second chance to get it right.
Who This Matters Most For
Facilities Where a Failed DG Start Is Not an Option
Battery health monitoring delivers the fastest payback in facilities where a delayed or failed generator start has consequences well beyond the cost of a replacement battery. Across every one of these environments, the underlying math is the same: a battery costs a few hundred dollars to replace on a planned schedule, and an unplanned outage caused by a failed start almost always costs many times more once downtime, safety exposure, and recovery time are factored in.
Critical Runtime
Data Centers and Colocation Sites
UPS runtime is measured in minutes, making the DG start window one of the most critical single points of failure in the entire power chain, and a single failed start can escalate directly into a reportable customer-facing outage.
Life Safety
Hospitals and Healthcare Facilities
Life-support and surgical equipment depend on backup power engaging within seconds, making battery readiness a direct patient-safety issue, not just an operations metric, and a factor that regulators and accreditation bodies expect to see documented.
Remote Sites
Telecom Towers and Remote Infrastructure
Sites with infrequent technician visits benefit most from remote battery visibility, since a failed start often is not discovered until the next scheduled site visit, by which point service has already been down for hours or days.
Continuous Operations
Manufacturing and Process Plants
A failed DG start during a power interruption can trigger a full production line shutdown, spoiled batches, and hours of restart time well beyond the outage itself, turning a short utility blip into a multi-shift production loss.
The OxMaint Advantage
How OxMaint Turns Raw Battery Sensor Data Into a Work Order — Automatically
Collecting battery data is only useful if it reaches the right technician before failure, not after. OxMaint connects to battery monitoring sensors and DG controllers and converts continuous readings into readiness scores, alerts, and scheduled work — without a manual data entry step anywhere in the process. The same platform that tracks generator PM tasks, fuel levels, and load bank tests now carries battery health alongside everything else, instead of leaving it as a separate spreadsheet nobody reliably updates.
01
Sensor Data Streams In Continuously
Cell voltage, temperature, impedance, and charger output are captured from connected battery monitoring hardware and logged against each specific battery asset, every hour of every day, without a technician ever needing to walk the site to collect a reading.
02
Every Cranking Event Is Logged
Each generator start — scheduled test or real outage — is recorded with cranking duration and load voltage, building a trend line that shows exactly how a battery bank is aging over time and how it compares to every other bank in the portfolio.
03
Threshold Alerts Fire Before Failure
When impedance, temperature, or voltage sag crosses a configurable threshold, OxMaint pushes an alert to the responsible technician instead of waiting for the next scheduled inspection round, so the team learns about a weakening battery in near real time.
04
Work Orders Are Created Automatically
A flagged battery generates a work order with the asset's full sensor history attached, so the technician arrives with context instead of starting the diagnosis from zero, and every replacement decision is backed by a documented data trail.
Detection Signal Strength
Which Monitored Signals Give the Earliest Warning of Battery Failure
Not every reading carries the same predictive weight. The chart below ranks the signals covered in this guide by how much warning time each one typically gives a maintenance team before a battery actually leaves a generator unable to crank, based on how each variable behaves across the degradation timeline described above.
Internal Impedance Trend
Earliest warning
Cranking Voltage Under Load
Weeks ahead
Temperature Deviation
Weeks ahead
Resting Voltage Alone
Little to no warning
Impact in Numbers
What Facilities Report After Moving to Continuous Battery Monitoring
These are the outcomes facility and reliability teams consistently describe once battery data stops living on a clipboard and starts streaming into a single dashboard alongside the rest of their generator maintenance program.
Weeks
Earlier Warning
Impedance trending flags a failing battery weeks before a scheduled load test would have caught it, giving procurement and maintenance teams a planned replacement window instead of a scramble.
Fewer
Failed Start Events
Sites replace batteries on a data-driven schedule instead of a fixed calendar, cutting failed starts during real outages and reducing the number of emergency after-hours callouts a team has to handle.
Less
Manual Inspection Time
Technicians stop walking sites to check voltages that are already streaming into the dashboard automatically, freeing up hours per week for higher-value maintenance work across the rest of the site.
Full
Battery History Per Asset
Every reading, alert, and replacement is attached to the battery asset record, ready for audits, warranty claims, and any post-incident review a facility might need to produce.
Common Questions
DG Battery Health Monitoring — Questions Facility Teams Ask Before Rolling It Out
Do I need new sensors, or can OxMaint use my existing battery monitors?
+
OxMaint connects to most existing battery monitoring hardware and DG controllers over standard protocols, pulling voltage, temperature, and impedance readings directly into the platform without requiring a full sensor replacement in most cases.
Book a demo to confirm compatibility with your current sensor setup.
How early can continuous monitoring actually predict a battery failure?
+
Internal impedance trending typically shows a rising pattern weeks before a battery would fail a load test, giving maintenance teams a scheduled replacement window instead of an emergency callout in the middle of an actual outage.
Can this replace scheduled load bank testing entirely?
+
Continuous monitoring reduces how often a full load bank test is needed, but most facilities keep an annual test as a final verification step while relying on daily monitoring for everything in between, which cuts both risk and total testing labor over a year.
Does this work across multiple sites and generator manufacturers?
+
Yes — OxMaint is built to track battery assets across every site and generator brand in a portfolio from a single dashboard, so a regional or national facilities team is not switching between separate tools or spreadsheets for each individual site.
How quickly can a facility get battery monitoring running in OxMaint?
+
Most facilities are logging live battery data within days of connecting existing sensors, with alerts and readiness scoring active shortly after the first full data cycle completes.
Start a free trial to connect your first site and see readings on the dashboard the same day.
OxMaint · Battery Health · DG Readiness
A Failed Start Is the Most Expensive Way to Find Out a Battery Was Weak
OxMaint turns continuous cell voltage, temperature, and impedance data into readiness scores and automatic work orders — so a failing DG battery gets replaced on a schedule, not discovered the moment mains power fails and the generator has to start.