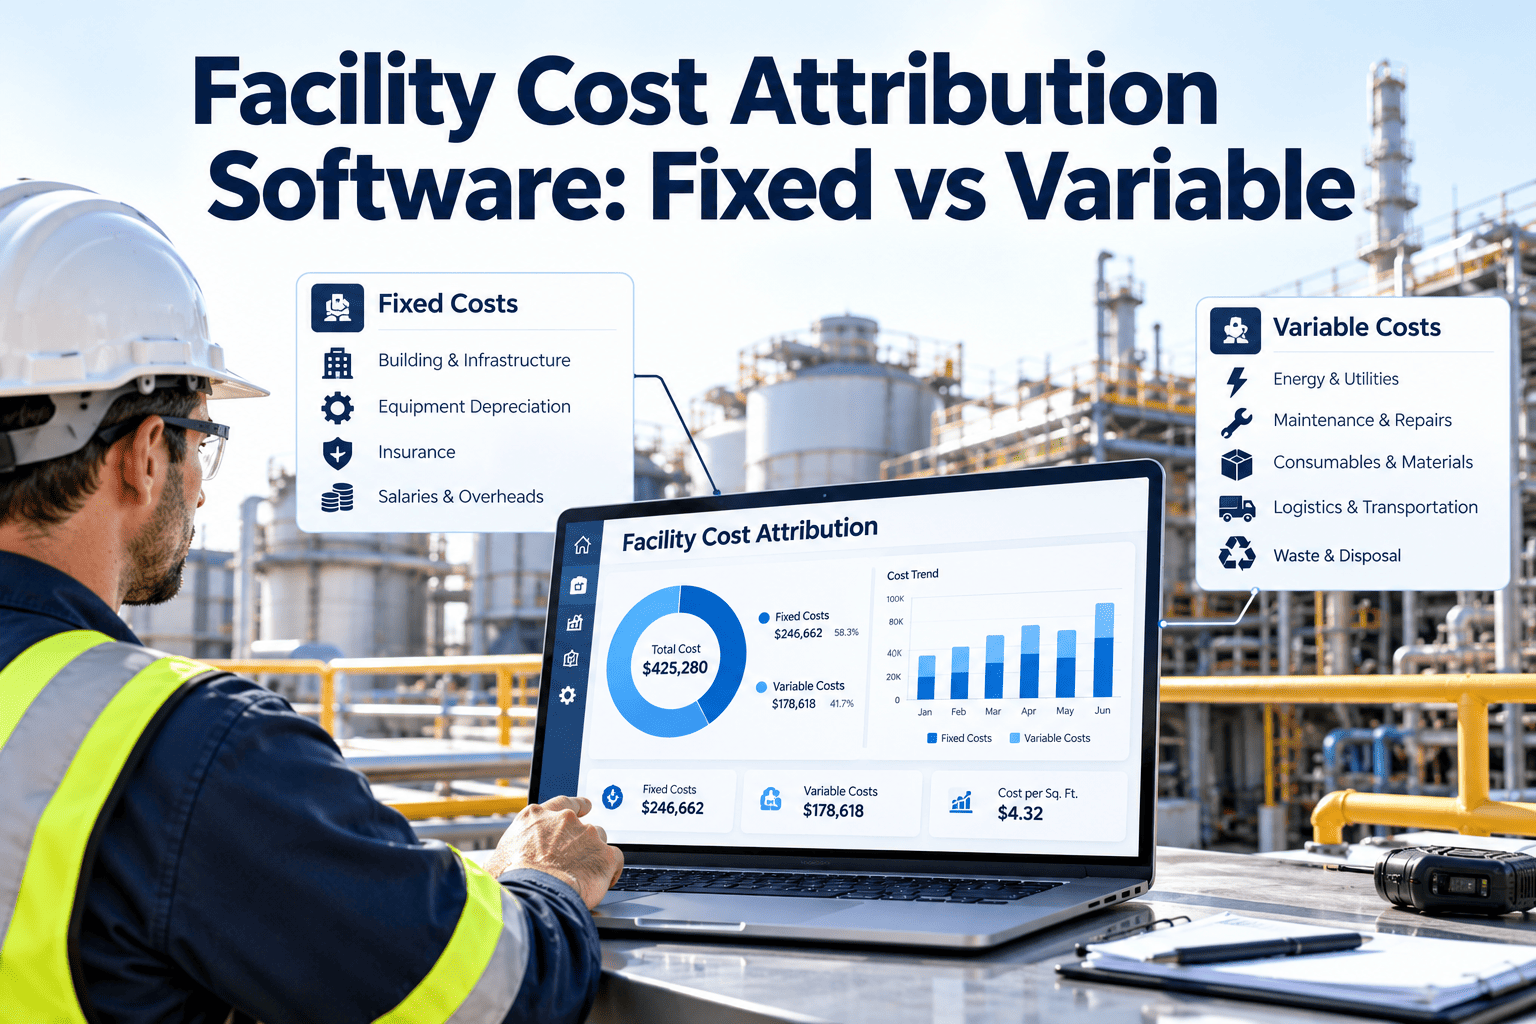
Facility cost attribution software answers a question that budgets alone cannot: where does facility money actually go, and why? Utility bills, contractor invoices, technician hours and spare parts arrive from different systems and rarely land on the asset or space that caused them. A CMMS that tags every cost as fixed or variable, direct or allocated, controllable or not turns budget debates into evidence. Teams can begin by opening an Oxmaint account and posting costs against real assets.
Know which facility costs you can change, and which you can only explain
Classify maintenance and operating spend as fixed or variable, direct or allocated, and report it by asset, building and tenant.
Three ways to classify every facility cost
Every cost has three independent properties. Recording all three, instead of one budget category, is what makes later analysis possible.
Fixed
Stays the same whatever the activity level, such as lease, insurance or a flat service contract.
Variable
Rises and falls with use or events, such as energy, repair parts and overtime.
Direct
Can be tied to one asset, space or work order without argument.
Allocated
Shared by several assets or tenants and split with an agreed rule.
Controllable
Facility teams can change it through scheduling, procurement or maintenance strategy.
Non-controllable
Set outside the team, such as property tax, tariffs or lease terms.
How common facility costs usually classify
The same cost can look different depending on how a site contracts for it. Use this table as a starting point and adjust it to your own agreements.
| Cost item | Behavior | Traceability | Controllable? | Where it comes from |
|---|---|---|---|---|
| Annual HVAC service contract | Fixed | Direct | Yes, at renewal | Contract record |
| Technician hours on a repair | Variable | Direct | Yes | Work order labor |
| Spare parts issued from stores | Variable | Direct | Yes | Inventory transaction |
| Electricity for a shared plant room | Variable | Allocated | Partly | Meter readings |
| Building insurance | Fixed | Allocated | Rarely | Finance ledger |
| Property tax | Fixed | Allocated | No | Finance ledger |
| Emergency call-out premium | Variable | Direct | Yes, by planning better | Contractor invoice |
| Cleaning of common areas | Fixed or variable | Allocated | Yes | Service contract |
Choosing an allocation method you can defend
Allocated costs are where most disputes start. The method you choose should reflect what actually drives the cost, and it should be documented before the first invoice goes out.
| Method | Basis | Works best for | Watch out for |
|---|---|---|---|
| Floor area | Square meters occupied | Rent, insurance, general cleaning | Ignores how intensively space is used |
| Metered usage | Sub-meter readings | Electricity, water, cooling | Needs working, calibrated meters |
| Work order hours | Labor logged per space | Maintenance chargebacks | Depends on honest time entry |
| Asset count | Number of assets served | Shared inspection programs | Treats small and large assets alike |
| Headcount | People per department | Office services | Moves as staffing changes |
| Equal split | Same share for everyone | Small fixed fees | Feels unfair when sizes differ |
Mixing methods is normal. Many sites split fixed pools by area and variable pools by measured usage.
From invoice to attributed cost in five steps
Attribution works only when it is part of daily work. In a connected CMMS the steps below happen as technicians close jobs, not as a month-end scramble.
- 1RegisterAssets, spaces and cost centers are created with a clear hierarchy.
- 2TagEach cost line carries behavior, traceability and control tags.
- 3PostLabor, parts and contractor costs land on work orders automatically.
- 4AllocateShared pools are split using the agreed rule each period.
- 5ReportDashboards show cost by asset, building, tenant and class.
Five reasons facility cost stays unattributed
Most teams already collect the raw numbers. The trouble is that those numbers arrive without the context that links them to an asset, a job or a user.
Anatomy of one repair: the layers behind a work order
A single repair carries several cost layers, and each layer behaves differently. Seeing them separately shows which part of a repair is the real problem.
Why reactive work looks expensive
Emergency work adds premium rates, rushed freight and overtime on top of normal labor and parts. Attribution makes that premium visible so planned maintenance can be justified in numbers.
Building a budget from fixed baselines and variable drivers
Fixed and variable thinking also improves forecasting. Fixed costs set a baseline, while variable costs depend on how much work and use you expect.
| Budget element | Class | How to forecast it |
|---|---|---|
| Service contracts | Fixed | Use signed contract values and renewal dates |
| Planned maintenance labor | Variable | Hours per task x scheduled tasks x labor rate |
| Reactive repairs | Variable | Recent failure rate by asset class, adjusted for age |
| Spare parts | Variable | Usage history and planned replacements |
| Utilities | Variable | Metered consumption x expected tariff |
Use history, not guesses
Because work orders carry asset, labor and parts cost, the CMMS can supply rates and failure frequencies for the formula instead of relying on last year total plus a percentage.
What is pushing facility teams toward structured cost data
Expectations on facility reporting are rising. These shifts reward teams whose cost data is already structured.
Meter data joins work data
Sub-meters and building systems feed consumption into the same reporting as maintenance cost.
Finance and facilities share one view
Teams reconcile cost centers and asset costs from a common record instead of two spreadsheets.
Spend by outcome
Leaders ask what a program achieved, not only what it cost, which needs cost tied to assets and work type.
Sustainability reporting
Energy and maintenance records increasingly support emissions and efficiency reporting.
A four-week review rhythm that keeps costs honest
Attribution stays accurate only when someone checks it regularly. A light monthly rhythm is enough for most sites.
- Week 1Check that closed work orders have labor, parts and cost tags.
- Week 2Reconcile contractor invoices against jobs.
- Week 3Review allocation pools and meter readings.
- Week 4Publish variance by cost class and agree actions.
Stop splitting costs by guesswork
Set up assets, cost tags and work order costing in Oxmaint, then see spend by building and class.
Splitting a shared plant: fixed by area, variable by usage
The example below uses hypothetical figures to show the arithmetic. A shared chiller plant costs 120,000 per year across three tenants.
| Tenant | Area share | Usage share | Fixed part (48,000) | Variable part (72,000) | Total |
|---|---|---|---|---|---|
| Tenant A | 50% | 40% | 24,000 | 28,800 | 52,800 |
| Tenant B | 30% | 35% | 14,400 | 25,200 | 39,600 |
| Tenant C | 20% | 25% | 9,600 | 18,000 | 27,600 |
| Plant total | 100% | 100% | 48,000 | 72,000 | 120,000 |
What the split reveals
Tenant A pays more fixed cost because it occupies more space, yet uses proportionally less cooling than its area suggests. A single area-based split would have overcharged Tenant C for nothing and undercharged heavy users.
Controllable and non-controllable spend: act versus explain
Act on controllable cost
- Reactive versus planned maintenance mix
- Contractor rates and call-out frequency
- Energy use through scheduling and setpoints
- Spare parts stock levels
- Repeat repairs on the same asset
Explain non-controllable cost
- Property tax and statutory charges
- Utility tariffs set by suppliers
- Lease and rent terms
- Insurance premiums driven by market
- Inflation on contracts already signed
Separating the two keeps performance reviews fair. Managers should be judged on what they can influence, while finance still sees the full picture.
Cost ratios worth tracking every month
A few ratios, calculated the same way every month, are more useful than dozens of ad hoc charts.
What changes once cost has a structure
Before attribution
- One lump budget line for maintenance
- Overruns explained after the fact
- Tenants dispute shared charges
- Replacement cases rest on age
- Contractor spend hard to trace
After attribution
- Cost visible by asset and class
- Variances flagged while they happen
- Charges backed by usage and work orders
- Replacement cases use actual spend
- Every contractor invoice tied to a job
Checklist: is your data ready for cost attribution?
Poor data, not poor software, is the usual reason attribution fails. Check each point before the first report goes to finance or a tenant.
- Cost centers match the finance ledger
- Every asset belongs to a building or space
- Labor rates are loaded into the system
- Parts carry a unit cost when issued
- Contractor invoices reference a work order
- Meters are mapped to spaces or tenants
- Allocation rules are written and approved
- Tags for behavior, traceability and control are mandatory
Where Oxmaint fits
Oxmaint records labor, parts and vendor costs against work orders and assets, and rolls them up through your asset hierarchy. Dashboards and reports then show spend by site, asset group or period.
Five questions structured cost data can finally answer
Once costs carry tags, the same data answers questions that used to take a week of spreadsheet work. These are the questions worth putting on a monthly agenda.
How Oxmaint supports cost attribution
Oxmaint is a maintenance management platform, so its role is to capture the cost of maintenance work cleanly and make it reportable. It sits alongside your finance system rather than replacing it.
| Oxmaint capability | Attribution use |
|---|---|
| Asset management | Builds the hierarchy that costs roll up through |
| Work orders | Records labor, parts and vendor cost per job |
| Preventive maintenance | Separates planned spend from reactive spend |
| Inventory | Posts parts cost to the asset when issued |
| Inspections | Supports condition evidence behind spend decisions |
| Dashboards and reports | Shows cost by asset, site, class and period |
Supporting tenant and department chargebacks
Many facility teams recharge maintenance or shared services to occupants. Clear attribution makes those charges easier to explain.
Lease terms and local regulations decide what may be recharged, so confirm allowable costs with finance or legal advisers.
Facility cost attribution software FAQs
What is facility cost attribution?
It is assigning each facility cost to the asset, space or user that caused it, with tags for behavior, traceability and control.
How do fixed and variable costs differ?
Fixed costs stay constant with activity, such as insurance. Variable costs move with use, such as energy or repair parts.
Can a CMMS allocate shared costs?
Yes, when costs and meters are mapped to spaces. You can book a demo to see allocation rules in action.
Which allocation method is best?
Use the one that matches the cost driver, often area for fixed pools and metered usage for variable ones.
Where should we start?
Pick one building and one shared system, then expand. Create a free account to try it.
Give every facility dollar an owner
Classify, allocate and report maintenance cost with a system your finance and facility teams both trust.