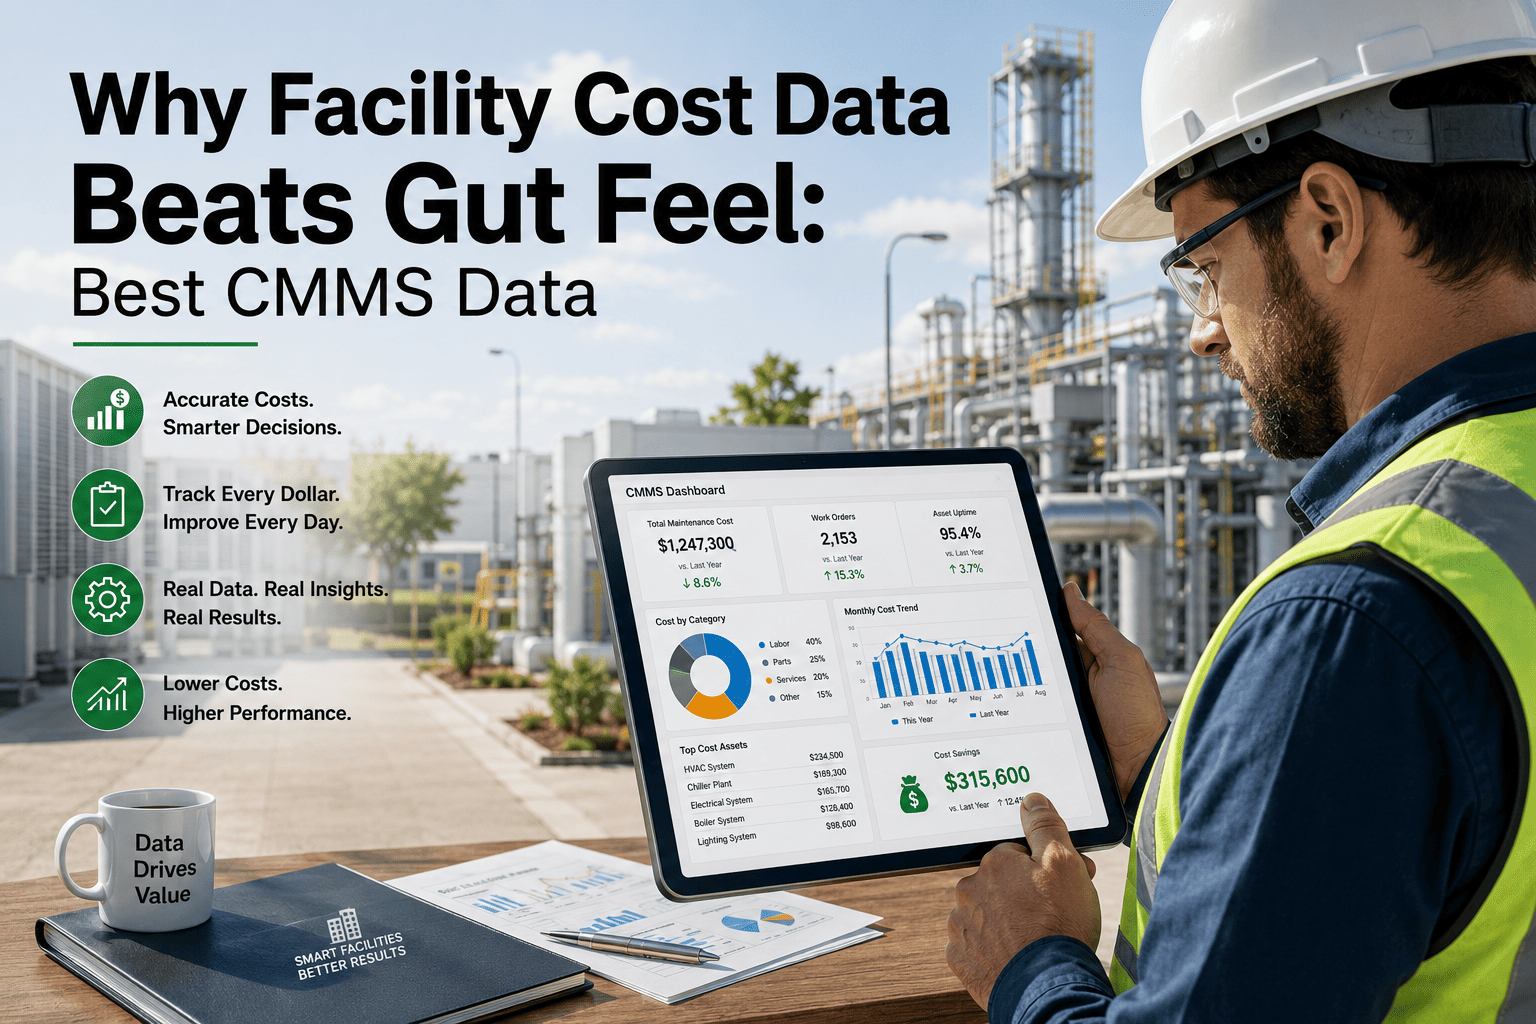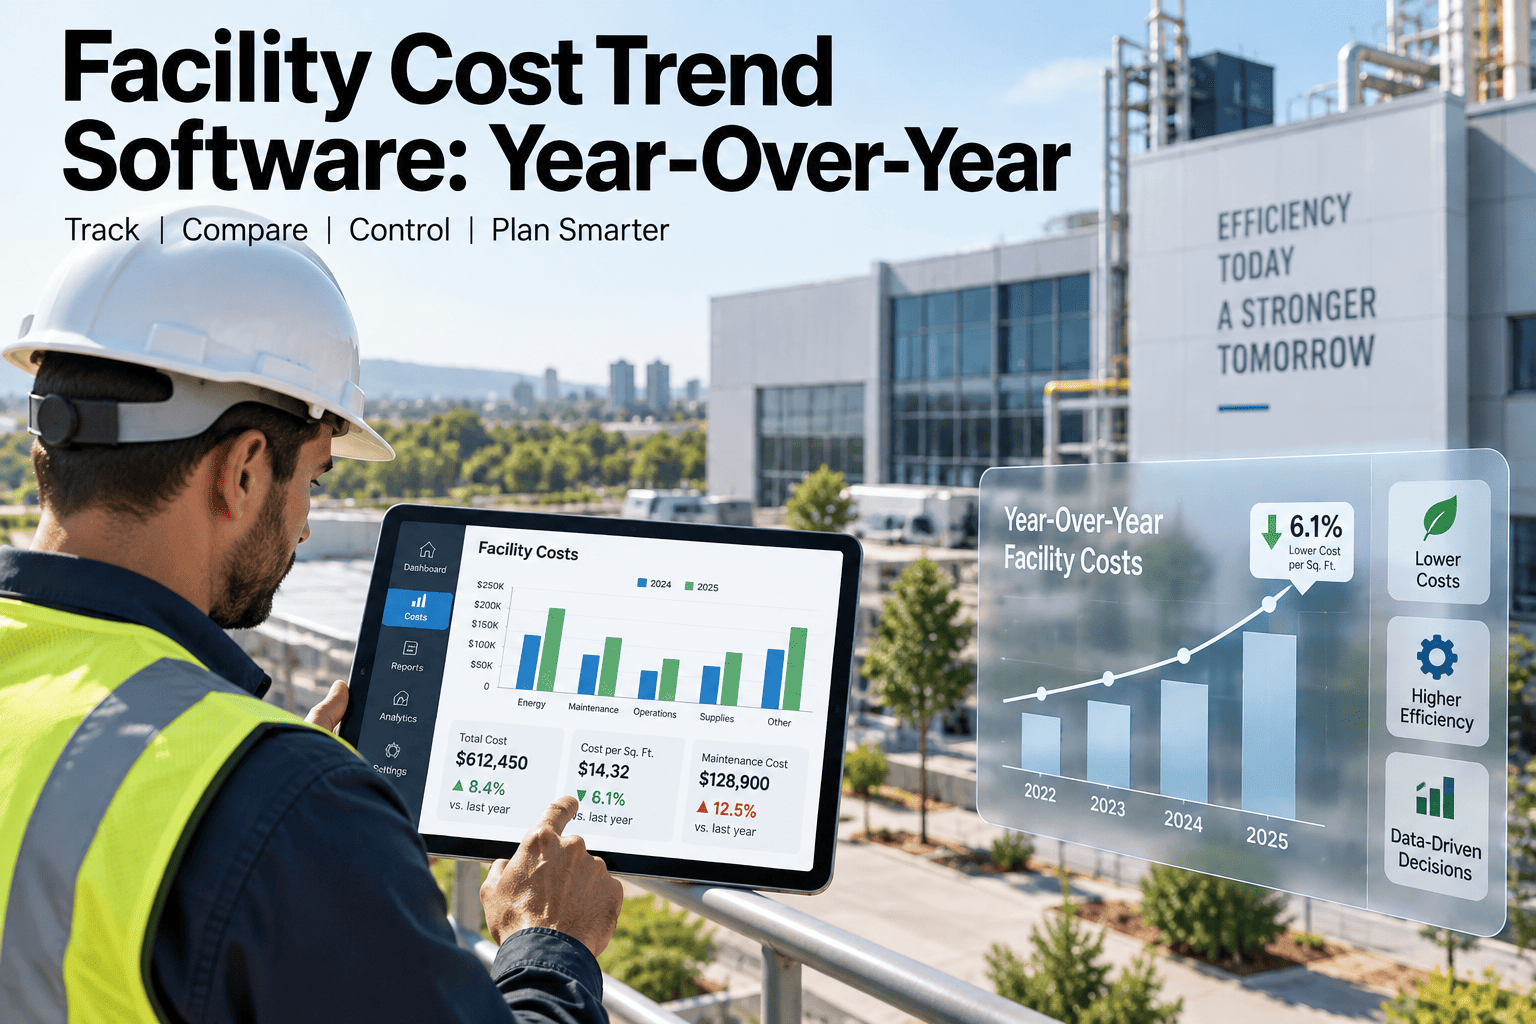
Most facility budgets are approved on a single number — this year's total spend compared to last year's — with almost nothing said about why the number moved. A facility cost trend platform changes that conversation by turning scattered invoices, work orders, and utility bills into a rolling multi-year line finance can actually interrogate. This guide covers what a real year-over-year cost trend build looks like inside a CMMS, from the data model to the dashboard a director signs off on.
If someone asked why maintenance spend rose 14% this year, could you answer in one slide?
Year-over-year cost trend software pulls labor, parts, contractor, and downtime cost into one normalized line per asset class or site — so budget variance has a cause, not just a number.
Why "spend went up" is usually the whole explanation
Cost trend data doesn't disappear — it just never gets connected. These are the five places most facility teams lose the thread between one fiscal year and the next.
- Gap 1Parts cost lives in the ERP, labor hours live in timesheets, and work-order counts live in the CMMS — three systems that never reconcile against the same asset ID.
- Gap 2Contractor invoices are coded to a cost center, not an asset or asset class, so a chiller replacement and a parking lot repaving both land in "facilities — other."
- Gap 3Site-to-site comparisons get thrown off by different building sizes, ages, and climates, so raw dollar totals mislead more than they inform.
- Gap 4One-time capital projects — a roof replacement, an elevator modernization — inflate a single year's trend line and get read as "maintenance is getting more expensive."
- Gap 5By the time someone assembles a trend chart for a budget meeting, it's built once, in a spreadsheet, and it's already stale by the next quarter.
The five cost signals worth tracking year over year
Not every dollar belongs on the same line. Separating these five signals is what makes a trend chart useful instead of just busy.
Planned vs. Reactive Spend
The ratio between scheduled preventive work and emergency repair cost, trended by quarter. A rising reactive share is the earliest warning sign of a maintenance program losing ground.
Cost Per Asset Class
HVAC, electrical, life safety, and building envelope tracked separately, so one aging chiller population doesn't get buried inside a facility-wide average.
Normalized Cost Per Square Foot
Spend divided by managed area, segmented by building type so an industrial plant is never compared against a corporate office on the same line.
Downtime Cost
Hours of unplanned outage multiplied by an agreed cost-per-hour figure, trended alongside repair spend so the full cost of failure is visible, not just the invoice.
Capital vs. Operating Spend
One-time replacement projects flagged and separated from recurring operating maintenance, so a single roof job doesn't distort the underlying trend line.
Labor Cost Per Work Order
Average technician hours and cost per completed work order, trended to surface whether efficiency is improving or simply headcount is absorbing more volume.
Building a five-year cost trend model inside a CMMS
A trend model is only as good as the fields feeding it. This is the sequence that gets a facility team from scattered cost data to a defensible multi-year chart.
Standardize the asset and cost-center hierarchy
Every asset gets a class, a site, and a criticality tag before a single dollar is trended — without this, nothing downstream reconciles.
Route labor, parts, and contractor cost through the work order
Every cost type gets tied back to a work order and an asset ID inside the CMMS, so nothing lands in an unattributed "miscellaneous" bucket.
Flag capital projects separately from operating maintenance
A dedicated project type keeps one-time replacements out of the recurring trend line while still preserving them for capital planning views.
Backfill at least two prior years of history
Historical work orders and invoices are imported and tagged retroactively so the trend line has a baseline instead of starting flat on day one.
Publish a live dashboard, not a static export
The trend chart pulls from live work-order data on a schedule, so the number in next quarter's budget meeting is current, not six months old.
Stop rebuilding the trend chart every quarter by hand
Connect work orders, parts, and contractor cost to a rolling multi-year view that updates itself — built for the meeting where finance asks "why."
What changes when trend tracking moves off a spreadsheet
The mechanics of a trend chart don't change. What changes is how much manual reassembly it takes to produce one, and how current it is when someone actually asks for it.
| Dimension | Spreadsheet-based tracking | CMMS-driven trend tracking |
|---|---|---|
| Data sourcing | Manually pulled from invoices, timesheets, and ERP exports each quarter | Pulled automatically from work orders as they're closed |
| Asset-level detail | Usually rolled up to site or department level only | Tracked down to individual asset and asset class |
| Capital vs. operating split | Manually separated, often inconsistently | Tagged at the work-order level, split automatically |
| Freshness at budget time | As current as the last manual rebuild | Live, refreshed on a schedule |
| Multi-site comparison | Requires manual normalization for square footage and building type | Normalized fields built into the dashboard filters |
What to check before presenting trend data to finance
A trend chart that survives scrutiny in a budget meeting has usually been checked against this list first.
Facility cost trend tracking — common questions
How many years of history do I need before a cost trend chart is useful?
Three years shows direction; five years is generally what capital and budget committees want before treating a trend as reliable rather than a short-term blip.
What's the difference between cost trend tracking and a maintenance budget report?
A budget report shows one year against plan. A cost trend tracks the same normalized metrics across multiple years to reveal whether spend is structurally rising, falling, or shifting between planned and reactive work.
Should capital replacement projects be included in the trend line?
Not in the recurring operating trend — they belong in a separate capital view. Mixing them in makes a single large project look like a permanent cost increase.
Can I trend cost data if I don't have historical work orders in a CMMS yet?
Yes — most teams backfill two to three years of prior invoices and work history during setup, tagged to asset and site, so the trend has a baseline instead of starting from zero. Book a Demo to see the import process.
How often should the trend dashboard refresh?
Monthly is typical for internal review, with a formal quarterly readout for finance and an annual roll-up for capital planning and budget defense.
Turn scattered invoices into a five-year line finance will trust
Connect your work orders, parts, and contractor cost, and see your normalized cost trend the first time you open the dashboard.
Free 14-day trial · No credit card