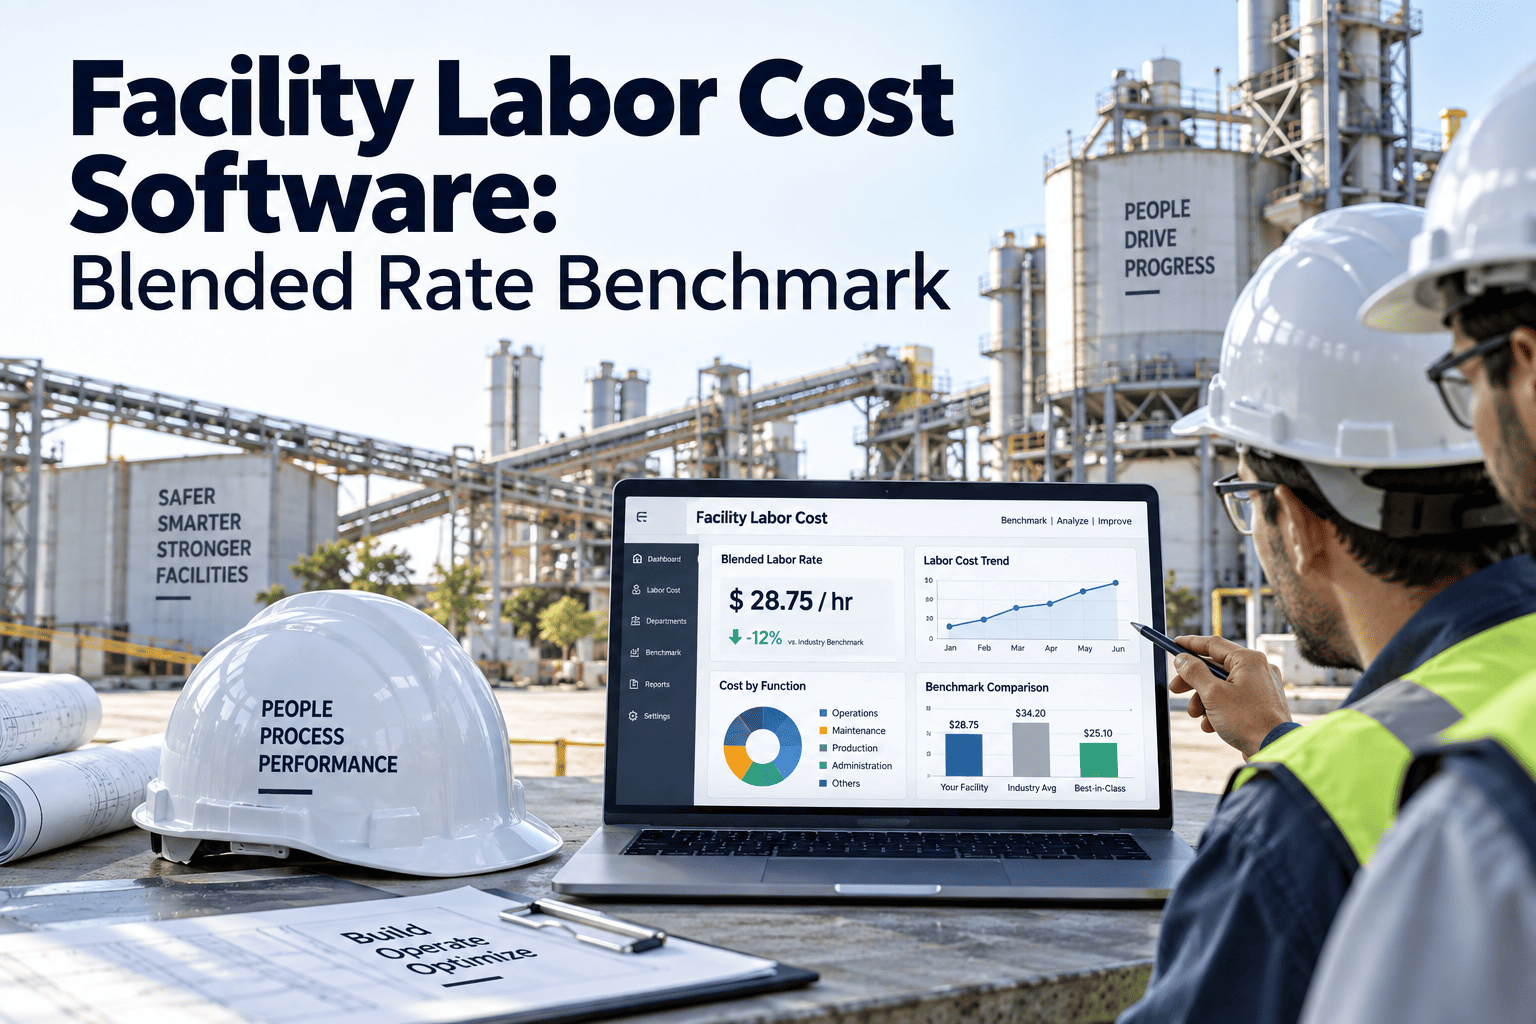
Every facility director eventually asks the same question: are we paying too much for in-house technicians, or would outsourcing actually cost more once every hidden expense is counted? A blended labor rate — the true cost of one productive maintenance hour once wages, benefits, training, travel and overhead are combined — is the number that answers it, yet most teams still guess instead of calculate. Facility labor cost software in 2026 pulls that math directly from live work order data instead of a stale spreadsheet, giving reliability leaders a defensible number for every outsource-versus-insource call. This guide benchmarks how facility teams are tracking blended labor rates this year, breaks down what actually sits inside that number, and shows what a properly calculated rate can save a mid-size portfolio annually. See how the math looks on your own labor mix — start a free trial or keep reading for the full benchmark.
Do you actually know what an hour of maintenance labor costs you?
Most facility budgets track wages. Almost none track the blended rate — wages plus benefits, training, travel, overhead and contractor spend combined — which is the one number that decides whether a repair belongs in-house or with a vendor. Get that number wrong and a portfolio either overpays for a call-out that should have gone to staff, or quietly bleeds hours into a task that would have been cheaper to outsource. OxMaint builds the true blended number automatically from your live work order data, no spreadsheet required.
The four numbers hiding inside every "hourly labor cost"
A blended labor rate is not the figure on a technician's pay stub. It is every dollar a facility spends to put one productive hour of maintenance work on the floor, averaged across the internal team and any contractors called in to cover overflow, emergencies or specialty trades. Most budget disputes between operations and finance trace back to one of these four line items being left out of the conversation entirely.
Base wage & payroll burden
Hourly pay plus payroll tax, workers' compensation and benefits typically adds 28–42% on top of the quoted wage before a single wrench is turned. Facilities that budget off the base wage alone are almost always underestimating true labor spend by close to a third.
Overhead & admin allocation
Supervision, dispatch time, training hours, PPE and facility overhead spread across billable hours usually add another 10–18% to the true cost per hour. Larger sites with layered supervision structures tend to sit at the higher end of that range.
Contractor & vendor blended cost
Emergency and specialty outsourced work commonly runs $120–$150 an hour against an internal fully loaded rate closer to $45 — a gap that has to be weighted into the portfolio average rather than compared line by line.
True wrench-time factor
Travel, waiting on parts and paperwork routinely reduce productive time to 55–70% of a paid hour, which quietly inflates the real cost of every completed work order well beyond what a simple hourly rate suggests.
How facility teams are tracking labor cost this year
The spread between how facility teams currently track labor cost is wide — and it directly determines how confidently they can answer an outsource-versus-insource question in a budget meeting. Teams still on spreadsheets or a bare-bones CMMS usually cannot answer the question at all without a week of manual pulls. The table below compares the four approaches most portfolios are running in 2026.
| Approach | Labor Cost Visibility | Update Frequency | Outsource-vs-Insource Support |
|---|---|---|---|
| Spreadsheet tracking | Manual, wage-only | Monthly or quarterly | Weak — no burden or overhead layer |
| Legacy CMMS (work order only) | Hours logged, cost not loaded | Per work order | Partial — needs export and rework |
| Enterprise EAM suite | Detailed but siloed in finance | Weekly, IT-dependent | Strong, but slow to query |
| OxMaint AI-powered CMMS | Fully loaded, live per asset | Real time | Built-in decision dashboard |
Run this formula by trade, by site and by month, and the blended rate stops being an annual guess and starts behaving like a real operating metric you can track alongside downtime and PM compliance.
What counts as a "normal" blended rate by facility type
Blended labor rates vary sharply by industry because the mix of skilled trades, compliance requirements and contractor availability is different in every environment. A hospital's critical-systems team and a retail portfolio's landscaping crew simply do not sit on the same cost curve. Use this as a starting benchmark before running your own numbers, then adjust for local labor market conditions.
| Facility Type | Typical Internal Blended Rate | Typical Contractor Blended Rate | Outsource Threshold |
|---|---|---|---|
| Manufacturing plant | $38–$52/hr | $95–$140/hr | Specialty repairs & overflow only |
| Healthcare campus | $44–$60/hr | $110–$160/hr | Critical-system specialists |
| Commercial real estate | $32–$46/hr | $85–$130/hr | Landscaping, cleaning, pest control |
| Education / campus | $30–$42/hr | $80–$120/hr | After-hours & seasonal peaks |
| Distribution & logistics | $36–$50/hr | $90–$135/hr | Conveyor & racking specialists |
Five steps to build a blended rate you can defend
You do not need a finance team to start. A directionally accurate blended rate can be built from the work order and invoice data most facility teams already have sitting in their CMMS and accounts payable system, usually inside a single afternoon of pulling reports.
Pull last year's hours
Export total internal labor hours and total outsourced hours by trade for the last twelve months, split by planned versus reactive work where possible.
Load the true internal rate
Add payroll tax, benefits and workers' compensation to base wage for each trade, then divide by actual productive hours rather than paid hours.
Pull contractor invoices
Gather every outsourced invoice for the same period and calculate the effective hourly rate paid per trade, including any emergency call-out premiums.
Weight and blend
Apply the formula above by trade and by site to produce one blended figure you can compare against the industry benchmarks on this page.
Three mistakes that quietly skew the blended rate
Even facility teams that attempt a blended rate calculation often get it wrong in one of three predictable ways, and the result is a number that looks precise on paper but quietly leads finance and operations toward the wrong outsourcing decision.
Using paid hours instead of productive hours
Counting every clocked hour as productive ignores travel, waiting on parts and paperwork, which understates the real cost of internal labor by a wide margin.
Comparing a single job instead of the trade average
One cheap contractor invoice does not represent the full trade. Averaging across every dispatch for that trade over a full quarter gives a far more honest comparison.
Leaving out emergency call-out premiums
After-hours and emergency contractor rates run well above standard dispatch pricing, and skipping them makes outsourcing look cheaper than it actually is during a crisis.
See your own blended rate calculated live, on your data
Book a 30-minute walkthrough and we will load a sample of your work order history into OxMaint and show your real blended labor rate — internal, contractor and combined — on screen, broken down by site and by trade so you can see exactly where the number comes from.
Insource or outsource? Let the blended rate decide
Most facility leaders treat outsourcing as an all-or-nothing choice. The operationally sound answer is almost always a calibrated mix, decided function by function against the blended rate rather than gut feel or whoever answered the phone first during the last emergency.
| Decision Factor | Favors In-House | Favors Outsource |
|---|---|---|
| Work type | Regulatory, life-safety, production-critical systems | Landscaping, cleaning, pest control, generic trades |
| Frequency | Recurring, predictable weekly volume | Occasional, seasonal or emergency spikes |
| Response time need | Immediate, same-shift response required | Scheduled window is acceptable |
| Skill availability | Trade is already on staff and utilized | Specialist skill is rarely needed in-house |
| Portfolio size | Single site or tight cluster of sites | Wide-spread multi-site or multi-city portfolio |
None of these factors should be scored in isolation. A facility that hits three "favors outsource" signals on a given trade but still shows a lower blended rate in-house should keep the work internal — the rate is the tiebreaker whenever the qualitative signals disagree, and revisiting the score once a year keeps the decision honest as staffing and vendor pricing shift.
How OxMaint turns work order data into a live blended rate
OxMaint is an AI-powered CMMS built to calculate labor cost automatically from the work your technicians and contractors are already logging — no separate spreadsheet, no month-end reconciliation, and no waiting on finance to hand back last quarter's numbers.
Automatic wage & burden loading
Technicians clock in and out against a specific work order, and OxMaint applies the fully loaded internal rate — wage, tax and benefits — automatically to every asset ledger entry.
Vendor cost capture
Every contractor invoice and dispatch is logged against the same asset, so internal and outsourced cost sit in one ledger instead of two disconnected systems.
Live blended rate dashboard
A portfolio director can see the blended rate by site, by trade or by asset type updated in real time, instead of waiting for a quarterly finance report.
Outsource threshold alerts
When a recurring repair's blended cost crosses the contractor rate for that trade, OxMaint flags it so the decision to insource or outsource is made on data, not habit.
Four signs your labor cost picture is out of date
A blended rate that was accurate two years ago rarely holds up today, especially with wage inflation and contractor pricing both moving faster than most budget cycles can keep pace with. Watch for these signals that your current tracking method is no longer giving finance and operations the same story.
Contractor spend keeps rising unexplained
Outsourced invoices climb every quarter but nobody can point to which trade or site is driving it without pulling a manual report first.
In-house overtime keeps growing
Reactive call-outs push overtime hours up, quietly raising the true internal rate far beyond what the base pay scale suggests.
Budget reviews rely on last year's numbers
If the labor cost figure in every budget meeting is a year-old estimate, decisions are being made on data that no longer reflects current wage and vendor pricing.
Outsourcing decisions differ site to site
Without a shared benchmark, one site manager outsources a job that another site handles in-house at a lower true cost for the identical task.
Facility labor cost software — frequently asked questions
What is a blended labor rate in facility maintenance?
It is the average true cost of one maintenance hour once wages, benefits, overhead and any contractor spend are combined across the whole team, rather than the single wage figure most budgets are built on. Start a free trial to see it calculated on your own work order history.
Why does wage-only tracking give a misleading labor cost?
Wages alone typically understate true cost by 28–42% once payroll burden, training and overhead are added, which skews every outsource comparison in favor of staying in-house even when a vendor would genuinely be cheaper for that specific job.
How does labor cost software support outsource decisions?
It weights internal and contractor hours into one blended figure, then flags trades where the recurring cost has quietly crossed the outsourcing threshold. Book a demo to see a live example.
Can OxMaint track both in-house and contractor labor together?
Yes. Internal technician time and outsourced vendor invoices post to the same asset ledger, giving one combined blended rate instead of two separate, hard-to-compare numbers spread across payroll and accounts payable.
How long does it take to see a reliable blended rate?
Most facilities see a directionally reliable rate within the first 30 days of logging work orders, with a fully seasoned benchmark forming after one full budget quarter of consistent internal and contractor data.
Stop guessing your labor cost. Start measuring it.
Join the facility teams using OxMaint to turn work order data into a live, defensible blended labor rate for every insource-versus-outsource decision — no spreadsheet, no quarterly wait, no guesswork at budget time.
Free 14-day trial · No credit card