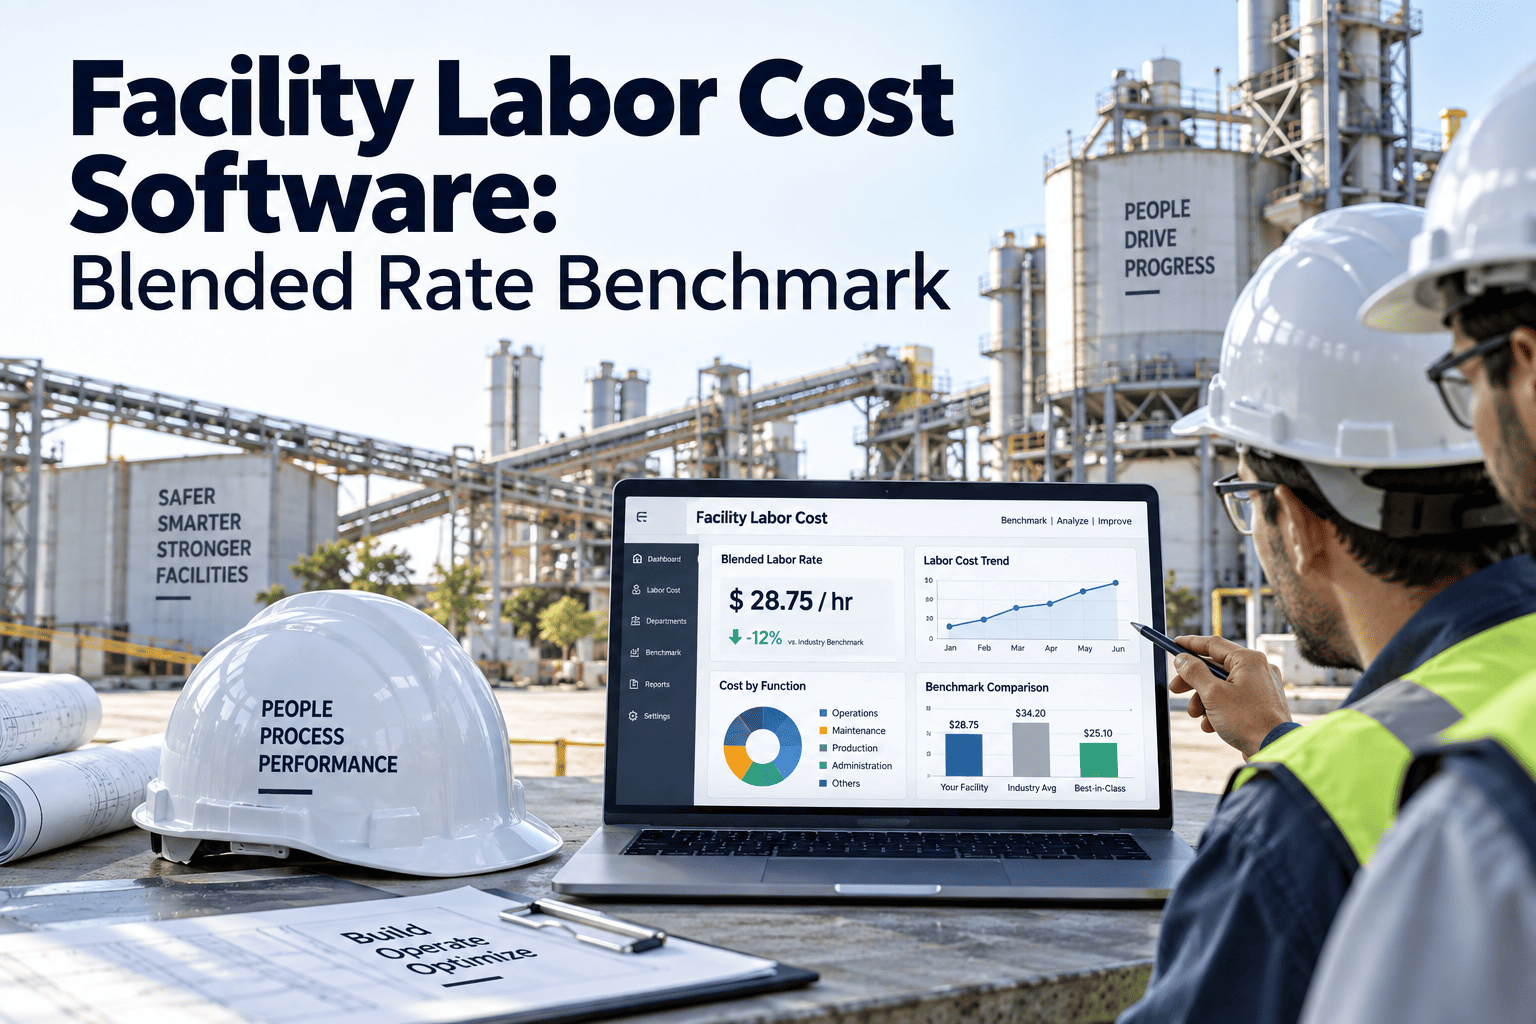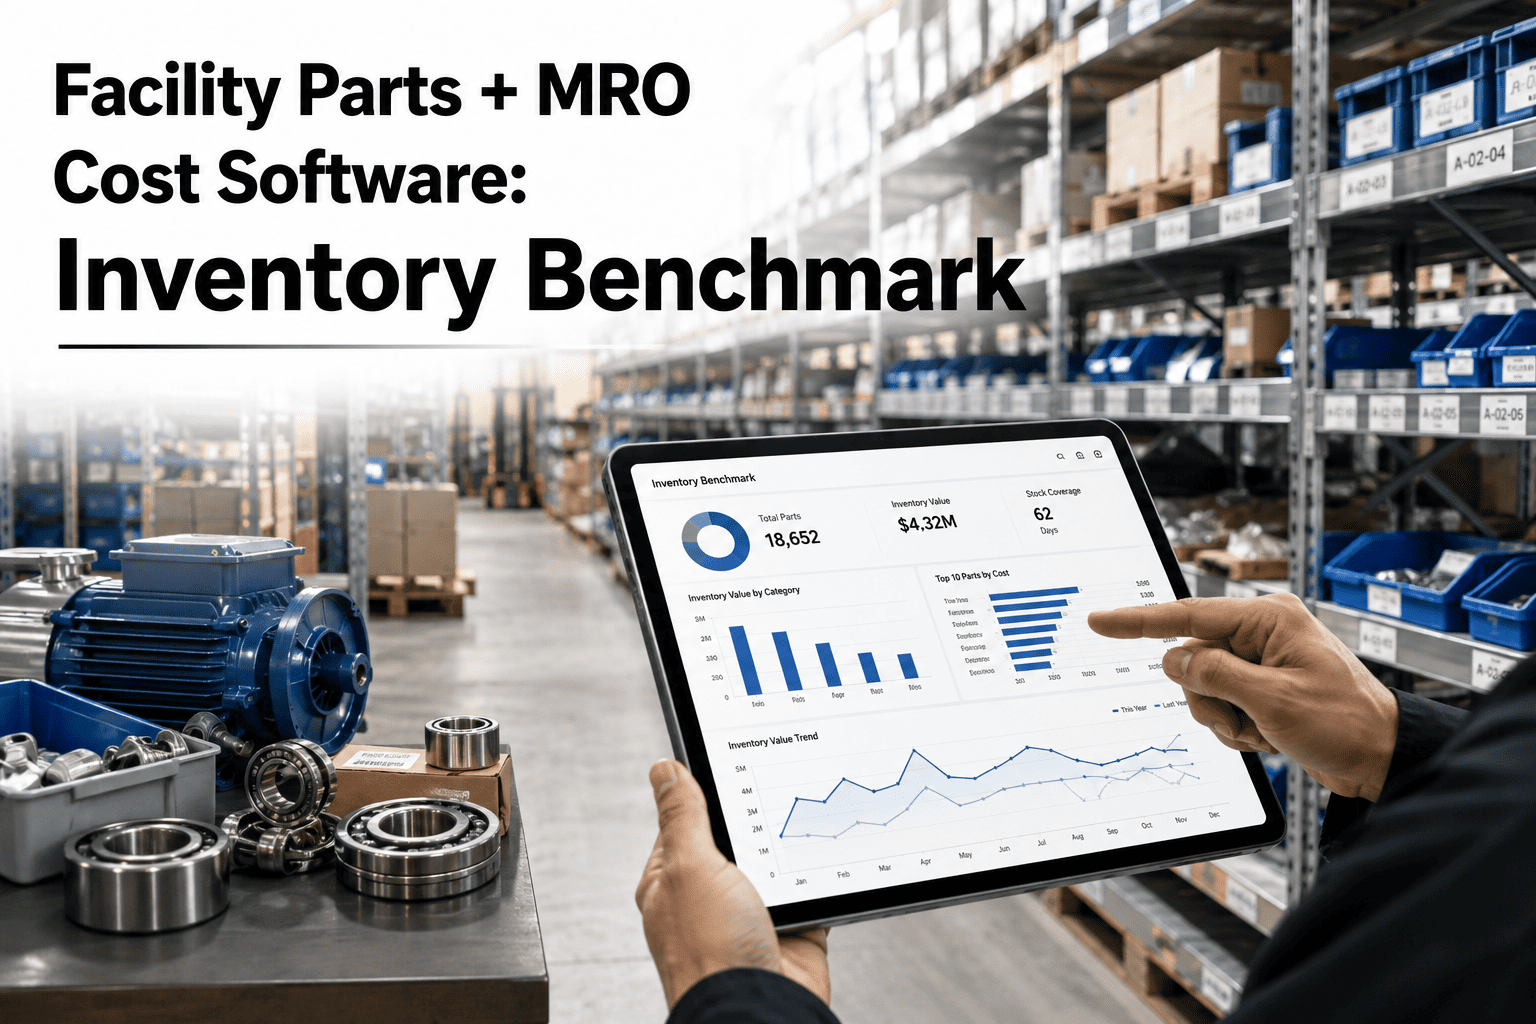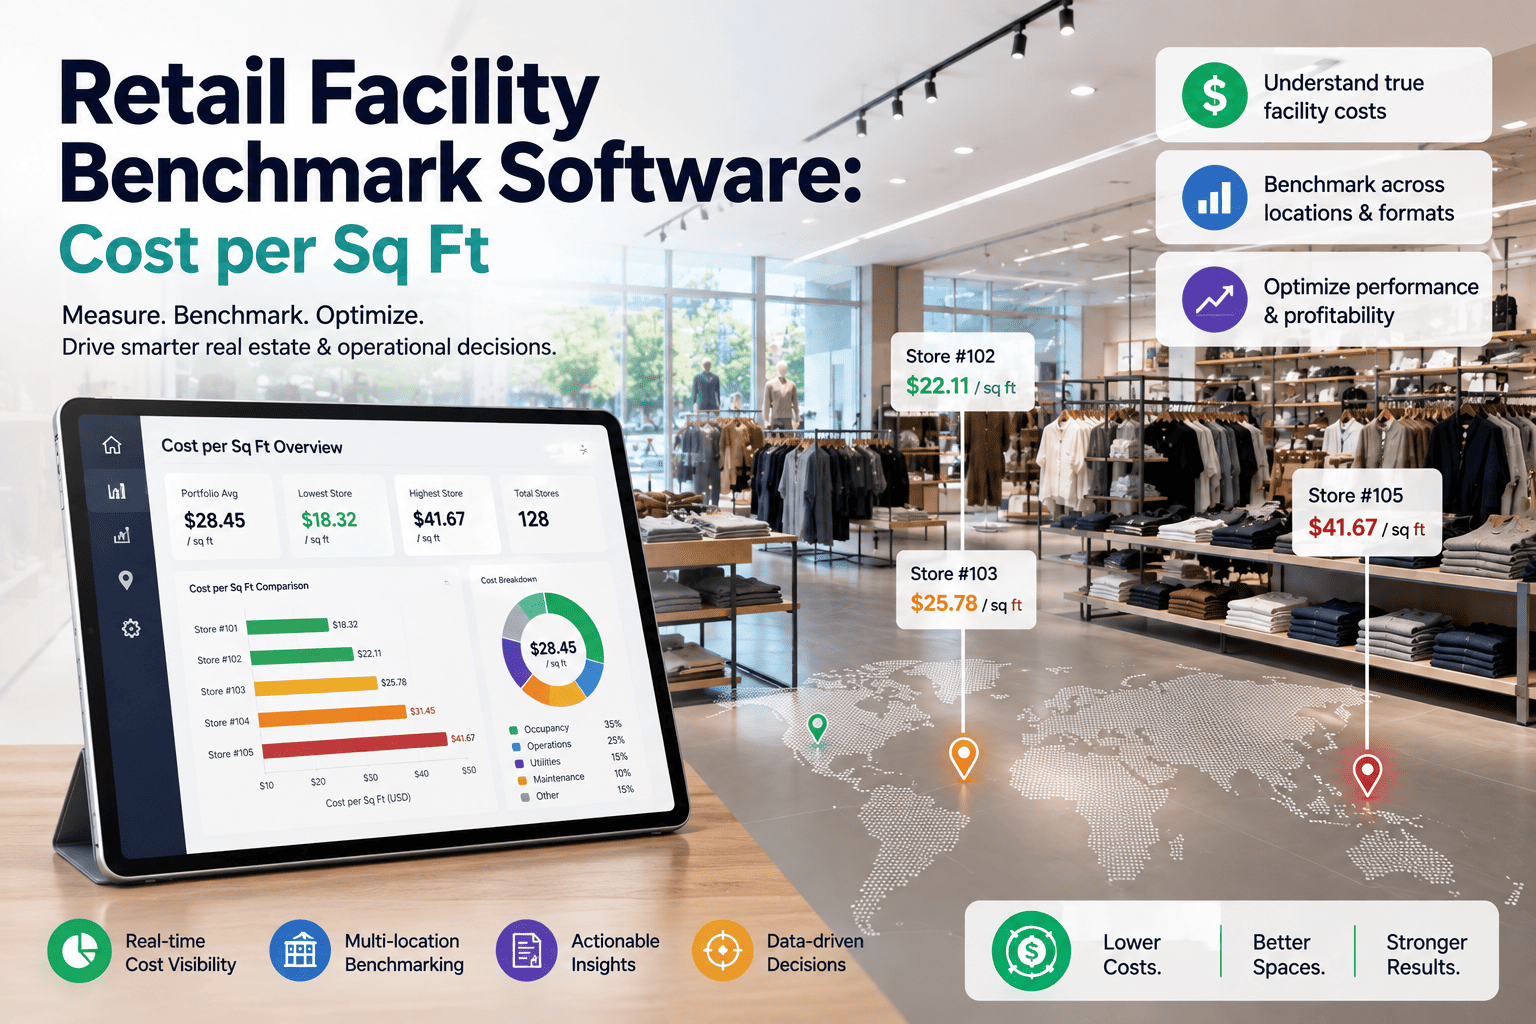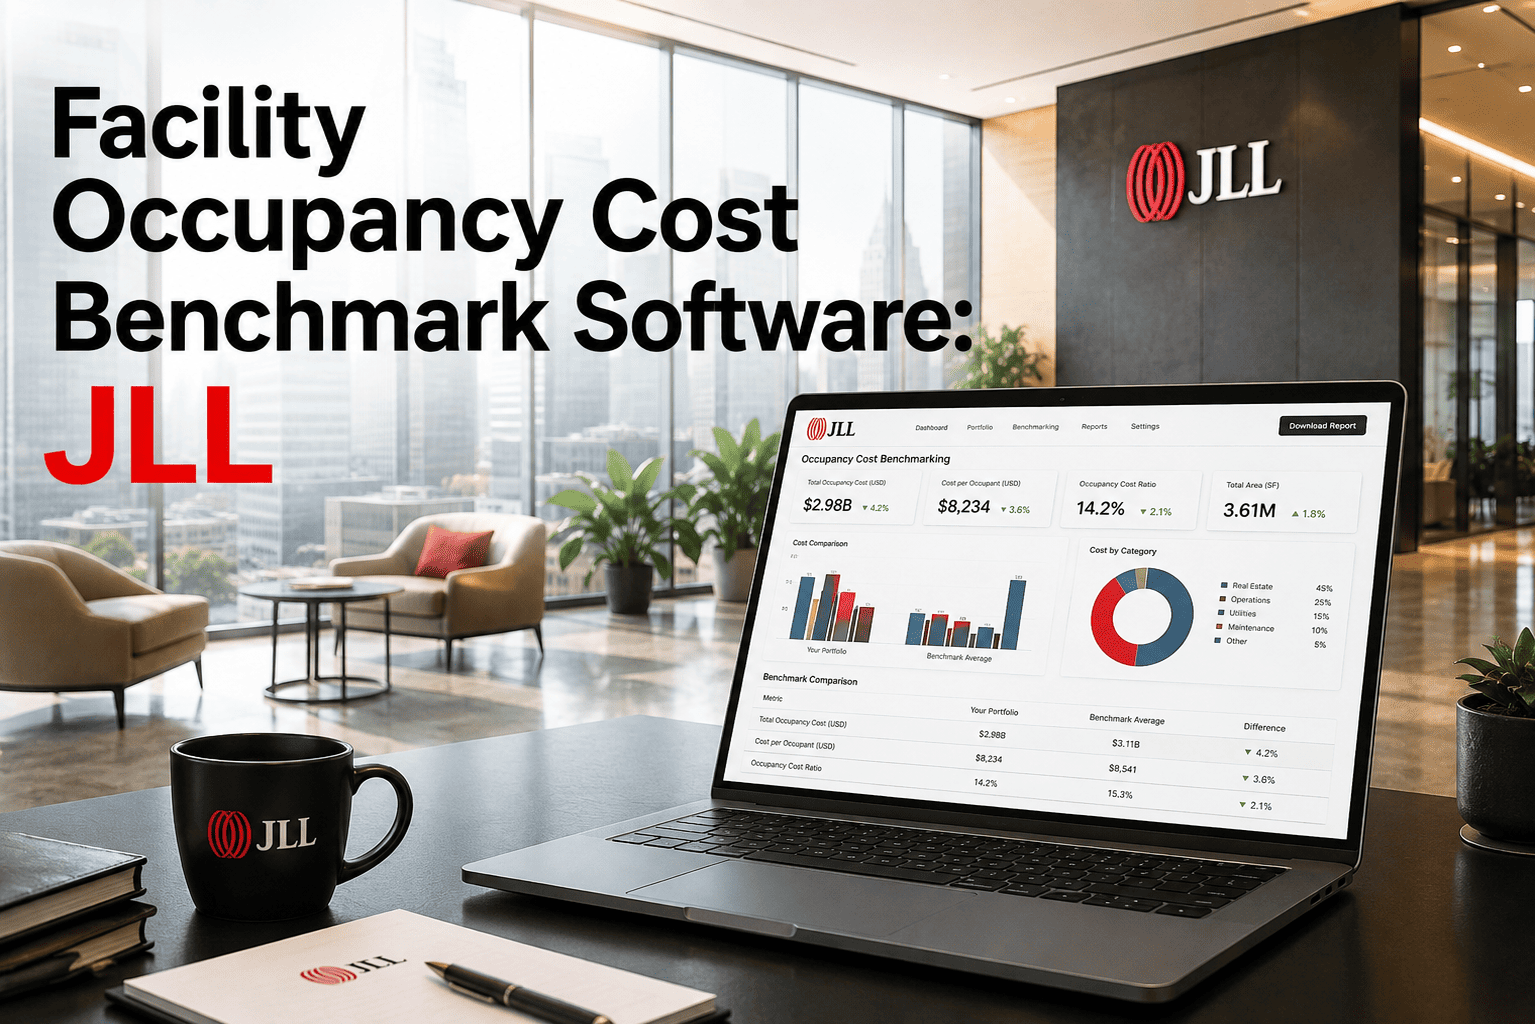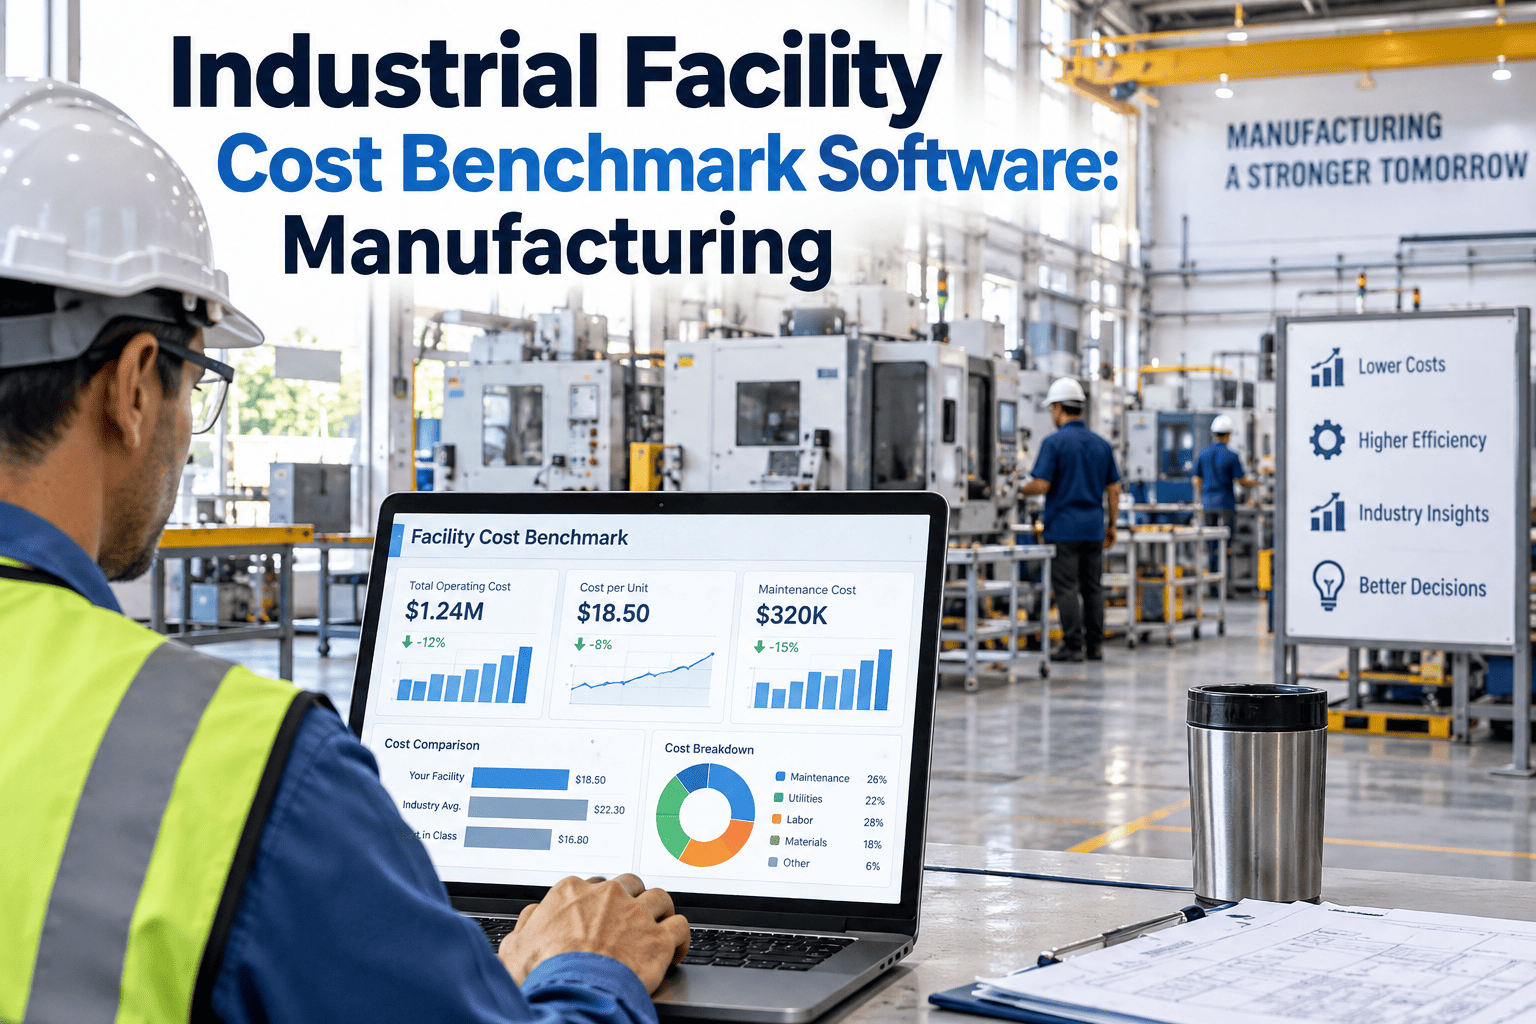
Every plant manager eventually faces the same question from finance: what does it really cost to run this facility, square foot by square foot? For most manufacturing sites, that answer is scattered across spreadsheets, contractor invoices, and stale benchmarks nobody fully trusts. Cost per square foot sounds simple, yet it hides labor allocation, energy waste, unplanned downtime, and compliance spend that rarely gets tracked the same way twice. In 2026, manufacturing operations are turning to purpose-built CMMS platforms to standardize how facility cost gets measured and reduced. Start benchmarking your facility for free with Oxmaint and see exactly where your numbers stand.
Where Facility Budgets Actually Leak
Most manufacturing sites already know their total maintenance spend, but few can explain how that number breaks down. Reactive repairs, idle labor hours, energy overconsumption on aging equipment, and last-minute contractor call-outs quietly inflate cost per square foot far beyond what a clean preventive program would require. Benchmarking software exists to pull these threads apart so facility leaders can see, in real numbers, where the budget is actually going. The chart below reflects the share of manufacturing sites reporting each leak as a significant, unresolved contributor to their facility budget overruns.
These figures are typical of manufacturing sites still relying on manual tracking or disconnected spreadsheets to manage facility spend. Once a benchmarking platform standardizes the categories and pulls data automatically from work orders, the variance shrinks fast because teams finally see the pattern instead of guessing at it every quarter. The underlying problem is rarely a lack of effort from maintenance teams; it is a lack of a consistent structure that turns scattered invoices and technician notes into a number finance can actually plan around. Without that structure, two plants running nearly identical operations can report wildly different cost per square foot simply because one tracks contractor spend more carefully than the other.
Six Categories Every Benchmark Should Track
Not every cost bucket deserves equal attention, but a serious industrial facility cost benchmark has to cover all of the categories below consistently, site after site, or the comparison falls apart. Here is the baseline structure that manufacturing finance and operations teams should expect from any benchmarking software before trusting its output. Skipping even one of these categories tends to distort the total, usually in a direction that makes the facility look more efficient than it actually is.
| Category | What It Measures | Typical Range | Why It Matters |
|---|---|---|---|
| Preventive vs reactive spend | Ratio of planned work to emergency repairs | 60 to 80 percent planned | Reactive work costs three to five times more per hour |
| Energy intensity | Kilowatt hours consumed per square foot annually | Varies by process type | Flags aging equipment and control drift early |
| Labor cost per asset | Technician hours logged against each equipment record | Depends on asset criticality tier | Exposes overstaffed or understaffed asset classes |
| Contractor spend ratio | Outside labor cost against total maintenance budget | 15 to 25 percent typical | Highlights when in-house skills gaps are getting expensive |
| Unplanned downtime cost | Lost production value during unscheduled stoppages | Site specific, tracked in dollars per hour | Directly connects maintenance quality to revenue |
| Compliance and audit cost | Time and resources spent preparing for inspections | Rises sharply without digital records | Reduces regulatory risk and audit prep time |
Why Square Footage Alone Isn't Enough
A raw cost per square foot number tells you almost nothing on its own. A high-intensity process plant will always run a higher figure than a light assembly facility, and comparing the two directly leads to bad decisions. What actually matters is tracking the trend for a single site over time, and comparing sites within the same process category against each other, using the same benchmark categories described above.
This is why generic facility benchmarks published by industry associations tend to disappoint operations teams. They average across too many process types to be actionable at the plant level. A benchmarking platform built specifically for manufacturing maintenance data solves this by letting teams filter comparisons by process type, asset criticality, and site size before drawing any conclusions. The result is a benchmark that reflects the realities of your operation rather than a broad industry average that nobody on your team can act on.
- Comparing unlike facilities. A foundry and a light assembly line will never share the same baseline, so blending them into one benchmark hides more than it reveals.
- Ignoring seasonal energy swings. Facilities in colder climates naturally spend more on heating in winter months, and a fair benchmark has to account for that variance.
- Excluding contractor invoices from the total. Outside labor is often the single fastest-growing cost category, and leaving it out understates the real number significantly.
- Benchmarking once a year. An annual snapshot cannot catch a slow cost creep the way a continuously updated dashboard can, which means problems get expensive before anyone notices.
How the Leading Platforms Stack Up
Facility teams generally choose between four approaches when it comes to benchmarking cost. Below is an honest ranking of how each one performs against the categories manufacturing operations actually care about, based on how completely each approach captures the six benchmark categories described above.
What Oxmaint Adds to the Benchmark
Benchmarking is only useful if the underlying data is trustworthy and current. Oxmaint was built around that principle, pulling cost data directly from the maintenance workflow instead of asking teams to reconcile numbers after the fact.
Before and After Benchmarking with Oxmaint
Facility cost gets reviewed once a quarter using numbers that are already out of date. Reactive repairs quietly outpace planned maintenance, energy waste goes unnoticed until the utility bill arrives, and contractor spend only gets flagged after it has already exceeded plan. Cross-site comparisons take a spreadsheet analyst days to assemble, and by the time the report is ready, the numbers have moved again. Budget requests end up backed by anecdote instead of data, which makes them far harder to defend in front of finance.
Cost per square foot updates continuously as work orders close, broken into the six categories that actually explain the number. Facility leaders see reactive spend rising before it becomes a budget problem, energy intensity trends before the bill spikes, and a single dashboard that lets every site be measured against the same standard, all year round. Every number in a budget request can be traced back to the exact work order that produced it.
The Numbers That Justify the Switch
Manufacturing sites that move to automated benchmarking consistently report measurable improvement within the first two quarters. These are the averages Oxmaint customers report after adopting the platform, drawn from work orders closed across dozens of manufacturing facilities of varying size and process type.
Four Steps to Your First Benchmark Report
That same team went on to use the benchmark to justify a predictive maintenance investment for their highest-cost asset class, a decision that would have taken months of manual analysis to support under their old spreadsheet-based process.
Who Actually Uses This Benchmark
Facility directors use the benchmark to defend capital and headcount requests with real numbers instead of estimates pulled together the night before a budget meeting. Reliability engineers use it to prioritize which asset classes deserve the next round of predictive maintenance investment, since the cost data makes the highest-leverage assets obvious. Finance teams use it to sanity-check maintenance budgets against actual spend trends instead of relying on last year's number with a flat percentage increase applied. Multi-site operations leaders use it to settle the perennial argument over which plant is actually running leanest, replacing opinion with a shared, auditable dataset every site agrees to.