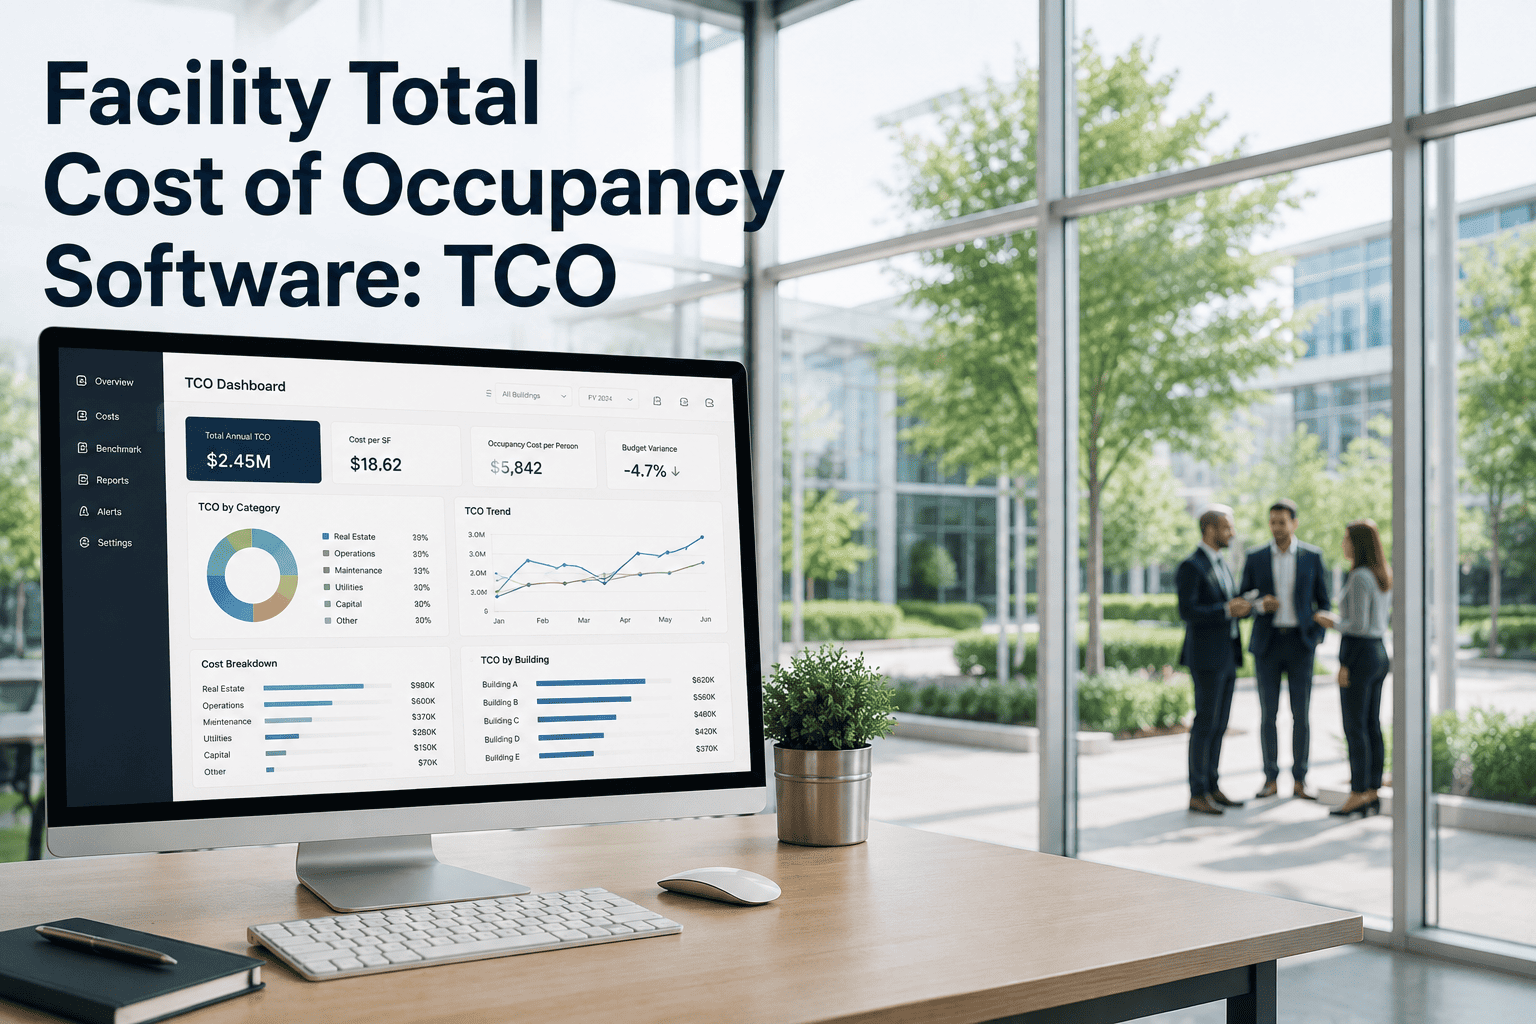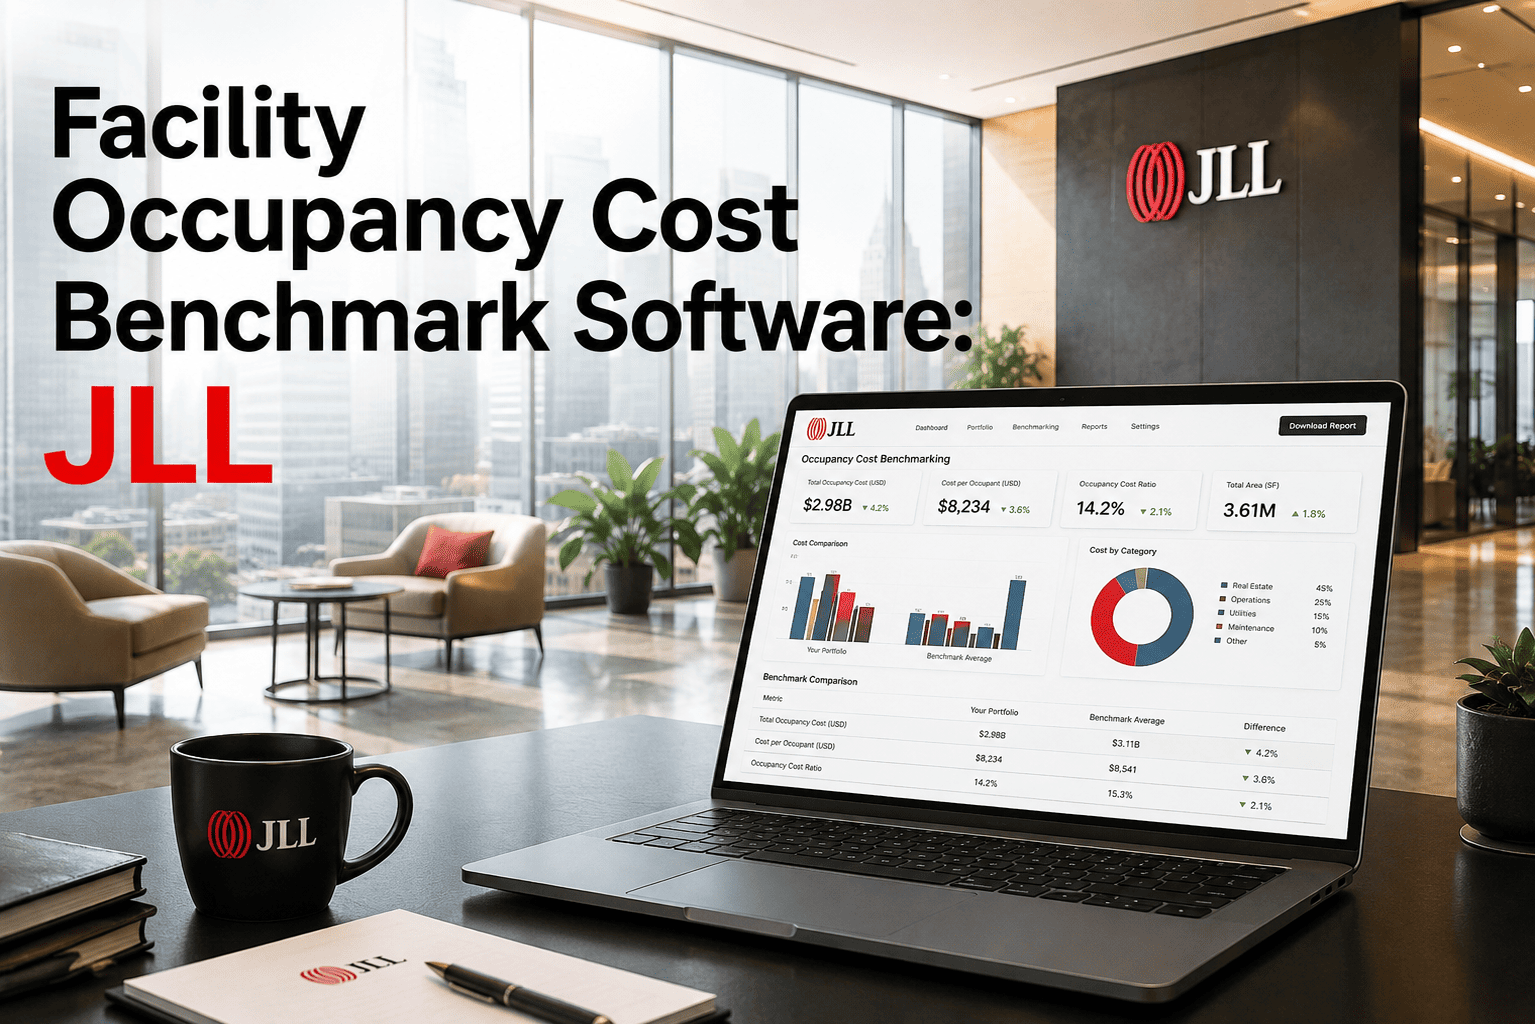
Facility occupancy cost benchmark software helps CRE and FM teams measure what they spend per square foot, per seat, and per site against standards from JLL, CBRE, and Cushman & Wakefield — and the fastest way to close the gap is a modern CMMS that turns maintenance data into cost intelligence. Occupancy cost is typically a company's second-largest expense after payroll, often running 10–20% of revenue, yet most teams still track it in disconnected spreadsheets. This guide breaks down the 2026 benchmarks, the formulas analysts use, and how the best occupancy cost CMMS platforms cut cost per square foot by double digits. If you want to see your own numbers benchmarked live, Start Free Trial and connect your first assets in minutes.
What Does Your Facility Really Cost Per Square Foot?
JLL's global benchmarks put average occupancy cost between $45 and $120 per sq ft annually — yet teams using a data-driven CMMS routinely land 15–25% below their peer median. Here is the exact playbook.
What Is an Occupancy Cost Benchmark — and Why JLL, CBRE and Cushman & Wakefield Numbers Matter
An occupancy cost benchmark is the total cost of occupying a facility — rent or ownership, utilities, maintenance, cleaning, security, and taxes — normalized per square foot, per seat, or per employee, then compared against industry peers. JLL, CBRE, and Cushman & Wakefield publish these figures annually, and boards expect their FM teams to explain any variance of more than 5% from the median.
Cost per Square Foot
The core CRE metric. Total annual occupancy spend ÷ rentable square footage. Office benchmarks run $45–$120/sq ft; industrial $6–$14/sq ft; data centers far higher due to energy intensity.
Cost per Seat / Employee
Occupancy spend ÷ headcount. With hybrid work, CBRE reports seat utilization near 40–60% — meaning many firms pay for space nobody uses. Benchmarks expose the waste.
Maintenance Cost per Sq Ft
The controllable slice. IFMA data puts maintenance at $1.50–$3.50/sq ft annually. Reactive teams spend up to 3x more than preventive teams on the same asset base.
How to Calculate Occupancy Cost: The Formula Analysts Use
Before you can benchmark against JLL or CBRE figures, you need a defensible internal number. The standard occupancy cost formula takes under an hour to compute — if your maintenance and utility data lives in one system instead of twelve spreadsheets.
(Rent + Utilities + Maintenance + Cleaning + Security + Taxes) ÷ Rentable Square Feet
Worked Example: A 250,000 Sq Ft Corporate Campus
A facilities director at a 250K sq ft campus totals $21.25M in annual occupancy spend — $85/sq ft, right at the peer median. Maintenance accounts for $2.9M ($11.60/sq ft) because 68% of work orders are reactive. After moving to preventive scheduling in a CMMS, reactive work drops to 30%, maintenance spend falls to $2.1M, and total occupancy cost lands at $81.80/sq ft — a $800K annual saving that moves the campus into the top quartile of its benchmark class.
Facility Occupancy Cost Benchmarks by Asset Class (2026)
Use these consolidated ranges — drawn from JLL, CBRE, and Cushman & Wakefield research — to locate your portfolio. The right-hand column shows where CMMS-driven teams typically land after 12 months of preventive maintenance data.
| Asset Class | Benchmark Range / Sq Ft / Yr | Maintenance Share | With CMMS Optimization |
|---|---|---|---|
| Corporate Office | $45 – $120 | 8–12% | 10–18% below median |
| Industrial / Manufacturing | $6 – $14 | 15–25% | 12–20% below median |
| Healthcare | $20 – $45 | 12–18% | 8–15% below median |
| Retail | $15 – $40 | 6–10% | 10–16% below median |
| Data Center | $120 – $300+ | 10–15% | 12–22% below median |
5 Cost Drivers That Push Facilities Above Benchmark
Cushman & Wakefield estimates that 30% of occupancy spend is avoidable. These five drivers account for most of the gap between median and top-quartile performers — and every one of them is measurable inside a CMMS.
Reactive Maintenance Premium
Emergency repairs cost 3–5x planned work. Teams above 50% reactive work orders almost always sit above the occupancy cost median.
Energy Drift from Degraded Assets
Fouled coils, worn belts, and drifting sensors add 10–30% to HVAC energy use — invisible until you trend asset performance against utility bills.
Underutilized Space
At 45% average seat utilization, every empty 10,000 sq ft of office costs $450K–$1.2M per year. Benchmarks force the consolidation conversation.
Vendor & Contract Sprawl
Without centralized work-order costing, outsourced maintenance invoices creep 5–8% annually with no scope justification.
Compliance Failures & Fines
Missed fire, elevator, or life-safety inspections trigger fines and insurance premium hikes — pure occupancy cost with zero value.
How OxMaint Turns Occupancy Cost Benchmarks Into Savings
OxMaint is the AI-powered CMMS + EAM platform that gives facility teams the asset-level cost data JLL-style benchmarks demand — from mobile work orders on the plant floor to portfolio-wide analytics in the boardroom.
Preventive Maintenance Scheduling
Automate PM calendars across every site and cut unplanned downtime 30–50% — directly shrinking the maintenance share of occupancy cost per sq ft.
Asset Tracking with QR Tags
Tag every asset from rooftop units to remote sites. Scan to see full cost history, so you know exactly which equipment drives your cost per square foot.
Maintenance Analytics & Benchmarks
Dashboards roll labor, parts, and vendor spend into cost-per-sq-ft views by site, so you can compare against JLL and CBRE medians in one click.
Compliance Reports in Minutes
Digital inspections and audit-ready logs aligned to ISO 55000 keep you ahead of every audit — eliminating fines that quietly inflate occupancy cost.
See Your Occupancy Cost Per Sq Ft — Live on Your Assets
Book a 30-minute demo and we will map your portfolio against 2026 JLL and CBRE benchmarks using your real maintenance data.
Occupancy Cost Benchmark FAQs
What is a good occupancy cost per square foot?
A good occupancy cost depends on asset class: corporate offices benchmark at $45–$120/sq ft annually, industrial at $6–$14, and retail at $15–$40, per JLL and CBRE research. Landing at or below your peer median — while maintaining uptime — is the standard definition of "good."
How do you calculate occupancy cost?
Add rent or ownership costs, utilities, maintenance, cleaning, security, and taxes, then divide by rentable square feet. The hard part is accurate maintenance data — a CMMS like OxMaint captures labor, parts, and vendor costs per asset automatically, so the formula takes minutes instead of weeks.
What is included in total occupancy cost?
Total occupancy cost includes base rent or debt service, operating expenses, utilities, planned and reactive maintenance, janitorial, security, property taxes, and insurance. Many benchmarks also normalize per seat or per employee to expose underutilized space.
How can a CMMS reduce facility occupancy cost?
A CMMS attacks the most controllable slice — maintenance and energy. Preventive scheduling cuts reactive repair premiums of 3–5x, asset tracking stops energy drift, and analytics reveal which sites run above benchmark. Teams typically reduce total occupancy cost 10–20% within 12–18 months. Book a Demo to see the benchmark dashboards.
What is the best occupancy cost benchmark software for 2026?
The best occupancy cost platforms combine work-order costing, asset tracking, and portfolio analytics in one system. OxMaint leads for FM and reliability teams because it works everywhere — data centers, plant floors, rooftops, and remote sites — with mobile apps, offline mode, QR tags, and IoT integrations feeding real-time cost-per-sq-ft benchmarks.
Stop Guessing. Start Benchmarking Below the Median.
Join the facility teams using OxMaint to cut occupancy cost 15–25% with preventive maintenance, asset intelligence, and audit-ready reporting.
Free 14-day trial · No credit card · Live in under an hour