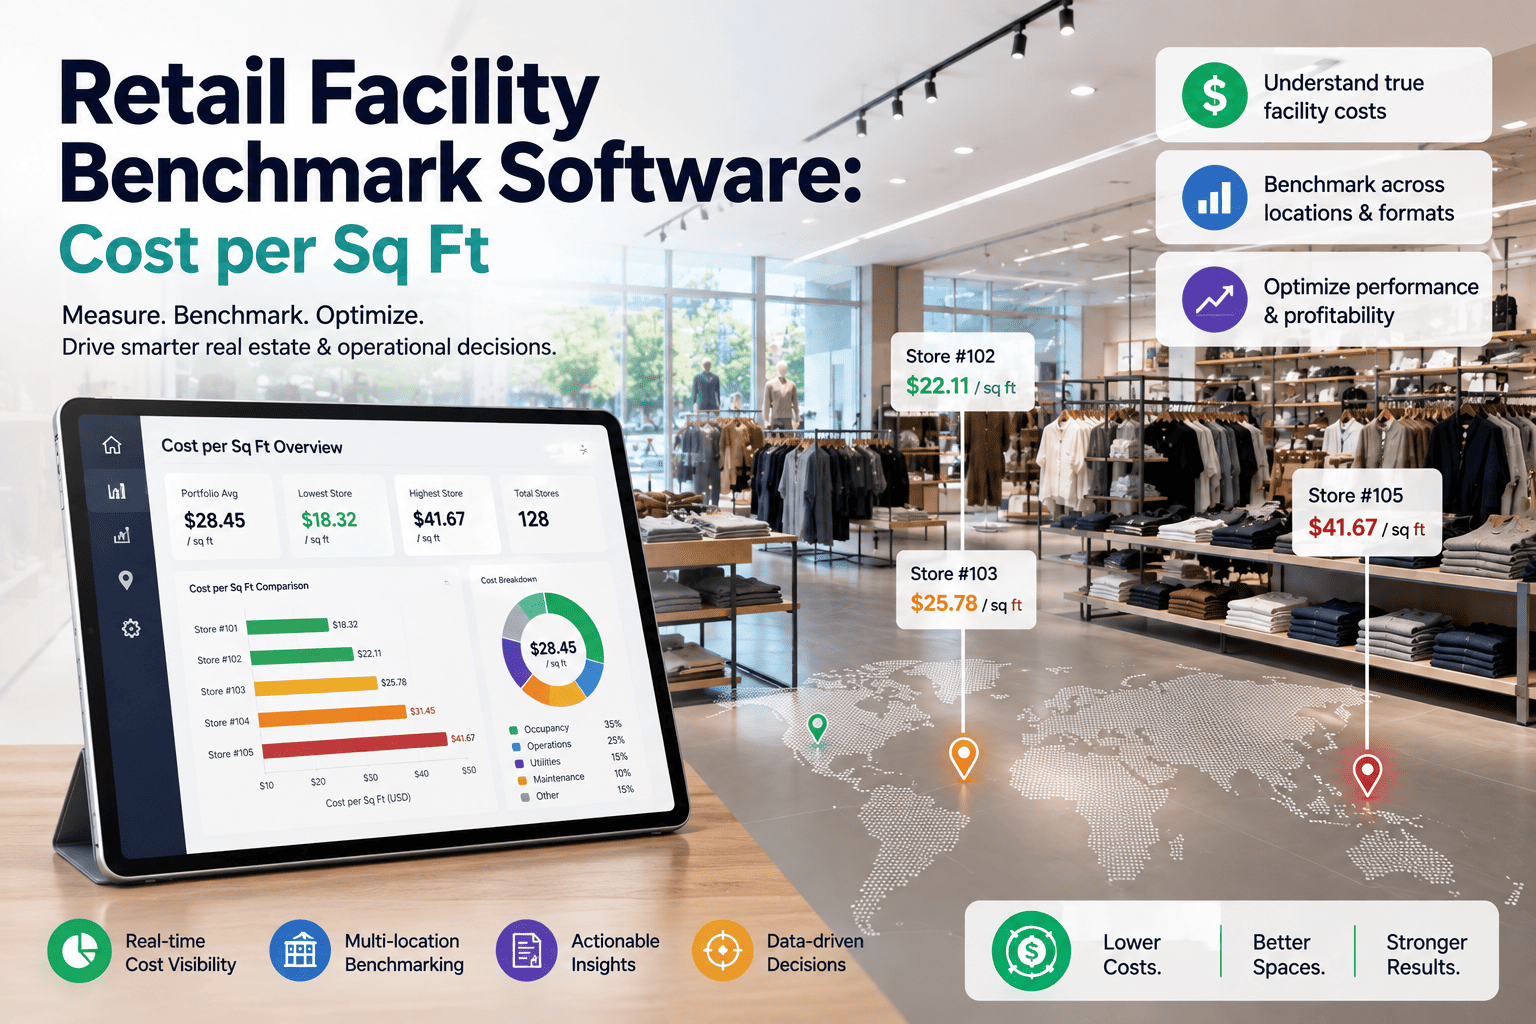
Retail facility benchmark software helps portfolio managers measure maintenance cost per square foot (CPSF) across malls, big-box stores, and quick-service restaurants — and the best retail CMMS platforms in 2026 automate that benchmarking with real-time asset data, work order tracking, and predictive analytics. If you're managing 10 stores or 1,000, knowing whether your $3.50/sq ft HVAC spend is competitive or bloated requires a retail facility benchmark platform that captures every work order, parts cost, and labor hour at the asset level. OxMaint is a purpose-built retail CMMS that turns maintenance data into actionable CPSF benchmarks, helping facility teams cut costs 20–35%, extend asset life, and pass every audit. Whether you're benchmarking a single flagship location or a national portfolio, Start Free Trial to see how leading retail operators track, compare, and optimize facility spend in real time.
What's Your Real Maintenance Cost per Square Foot?
Top retail CMMS platforms track every dollar by asset, location, and sq ft — so you can benchmark against industry standards, identify outliers, and prove ROI to leadership. OxMaint delivers the retail facility benchmark data you need to cut CPSF by 20–35%.
What Is Retail Facility Benchmark Software — and Why Cost per Sq Ft Matters
Retail facility benchmark software measures maintenance cost per square foot (CPSF) — total annual maintenance spend divided by gross leasable area — so you can compare performance across stores, formats, and industry peers. A regional mall averaging $4.20/sq ft while competitors run $2.80/sq ft signals inefficiency; a QSR chain spending $6.50/sq ft on reactive repairs vs. $3.80/sq ft with preventive maintenance proves the ROI of the best retail CMMS platforms.
Identify Outliers Fast
Spot which stores burn 40% more per sq ft on HVAC, plumbing, or electrical — and why. Drill into work order history, asset age, and vendor costs by location.
Prove PM Payback
Facilities with 80%+ preventive maintenance compliance run $1.50–$2.50/sq ft cheaper than reactive sites. Track PM completion rates and CPSF side-by-side.
Justify Capital Plans
Show leadership which 15-year-old RTUs cost $8K/yr in repairs vs. $3K/yr for new units — and build the business case for replacement with real CPSF data.
Retail Facility Cost per Sq Ft Benchmarks by Format
CPSF varies widely by retail format, climate, and asset age — but top retail benchmark platforms let you compare apples-to-apples. Here are 2026 industry ranges for annual maintenance cost per square foot:
| Retail Format | CPSF Range | Top Cost Drivers | Best Practice CPSF |
|---|---|---|---|
| Regional Malls | $2.50–$4.50 | HVAC (40%), common area, escalators | $2.80–$3.20 |
| Big-Box Stores | $1.80–$3.50 | Roofing, HVAC, dock equipment | $2.00–$2.50 |
| QSR / Fast Food | $4.00–$7.00 | Kitchen equipment, refrigeration, plumbing | $4.50–$5.50 |
| Strip Centers | $2.00–$4.00 | Parking lots, roofing, exterior lighting | $2.50–$3.00 |
| Standalone Retail | $2.20–$4.20 | HVAC, electrical, signage | $2.60–$3.20 |
Facilities in the "best practice" range share three traits: 75%+ preventive maintenance compliance, real-time asset tracking, and a retail CMMS facility platform that benchmarks CPSF by location, system, and vendor. Sites above range typically run reactive maintenance, lack asset histories, and can't isolate cost drivers.
How the Best Retail CMMS Platform Delivers Real-Time CPSF Benchmarks
OxMaint is the top retail benchmark platform for facility teams that need to track, compare, and optimize cost per square foot across portfolios. Here's how our retail facility software turns maintenance data into actionable CPSF insights:
Asset-Level Cost Tracking
Log every work order, parts cost, and labor hour at the asset level — HVAC units, refrigeration racks, lighting circuits. OxMaint calculates CPSF by system, so you see that Store #42 spends $1.80/sq ft on HVAC vs. the portfolio average of $0.95/sq ft.
Multi-Site Benchmark Dashboards
Compare CPSF across regions, formats, and vintages in real time. Filter by sq ft, climate zone, or asset age to see why your Florida stores run $3.40/sq ft while Texas runs $2.60/sq ft — and whether it's humidity, vendor rates, or deferred maintenance.
Preventive Maintenance Automation
Facilities with 80%+ PM compliance cut CPSF by $1.50–$2.50/sq ft. OxMaint auto-schedules PMs, tracks completion rates, and flags overdue tasks — so you shift from reactive firefighting to planned maintenance that extends asset life and lowers cost per sq ft.
Vendor & Parts Cost Analysis
Track vendor rates, parts spend, and warranty recovery by location. See that Vendor A charges $185/hr in Chicago vs. $125/hr in Atlanta, or that Store #18 burned $12K on compressor parts that were under warranty — and recover those costs.
See Your Real CPSF in 15 Minutes
Book a 30-minute demo and we'll show you how OxMaint benchmarks cost per square foot across your portfolio — live, with your data.
How a 45-Store Retail Chain Cut CPSF by 28% in 9 Months
A regional big-box retailer with 45 stores (2.1M sq ft total) was spending $4.10/sq ft annually on maintenance — $8.6M/yr — with no visibility into which locations, systems, or vendors drove costs. After implementing OxMaint's retail facility benchmark software, they:
Centralized Work Orders & Asset Data
Migrated 3,200 assets from spreadsheets into OxMaint. Tagged every work order with asset ID, location, and sq ft. First insight: 8 stores (18% of portfolio) accounted for 35% of total spend — all running reactive maintenance on 12+ year-old HVAC.
Launched Preventive Maintenance Program
Auto-scheduled 1,800 PMs/quarter for HVAC, roofing, and dock equipment. PM compliance jumped from 42% to 81%. Reactive work orders dropped 38%. CPSF in pilot stores fell from $4.35 to $3.60/sq ft.
Renegotiated Vendor Contracts
Used OxMaint's vendor cost reports to consolidate from 23 HVAC vendors to 6 regional partners. Negotiated 12% rate reduction with volume commitments. Recovered $18K in warranty claims previously missed. Portfolio CPSF dropped to $2.95/sq ft — a 28% reduction, saving $2.4M annually.
"We went from guessing which stores were expensive to knowing exactly why — and fixing it. OxMaint paid for itself in the first quarter just from vendor renegotiations. The CPSF benchmarks let us prove ROI to the CFO and get budget approved for capital replacements we'd been requesting for years."
What to Look for in the Best Retail CMMS 2026
Not all retail facility software delivers true CPSF benchmarking. The top retail CMMS facility platforms in 2026 share these capabilities:
Multi-Site Asset Hierarchy
Organize assets by portfolio → region → store → system → component. Track sq ft at every level so CPSF calculations are automatic, not manual.
Mobile Work Order Capture
Techs log labor hours, parts used, and photos from the field via mobile app. No paper, no spreadsheets — every dollar tracked to the asset and sq ft.
Custom Benchmark Dashboards
Build CPSF reports by format, region, or system. Export to Excel or share live dashboards with leadership. Filter by date range, vendor, or asset age.
Preventive Maintenance Automation
Auto-generate PMs based on calendar, runtime, or condition. Track completion rates and overdue tasks. Prove that 80% PM compliance = lower CPSF.
Vendor & Warranty Tracking
Log vendor rates, response times, and quality scores. Flag warranty-eligible repairs automatically. Recover 5–10% of annual spend in missed claims.
IoT & Predictive Alerts
Integrate sensors for HVAC, refrigeration, and critical assets. Get alerts before failures — shift from reactive to predictive and cut emergency spend 40%+.
Retail Facility Benchmark Software: Your Questions Answered
What is a good maintenance cost per square foot for retail?
Best-practice retail CPSF ranges from $2.00–$3.20/sq ft annually, depending on format. Big-box stores average $2.00–$2.50, regional malls $2.80–$3.20, and QSRs $4.50–$5.50 due to kitchen equipment. Facilities above these ranges typically run reactive maintenance and lack asset-level cost tracking. Start Free Trial to benchmark your portfolio.
How do I calculate retail facility cost per square foot?
CPSF = Total Annual Maintenance Spend ÷ Gross Leasable Area (sq ft). Include all work order costs (labor, parts, vendor invoices), preventive maintenance, repairs, and capital replacements under $5K. OxMaint calculates CPSF automatically by tracking every dollar at the asset level and dividing by your portfolio's sq ft.
What's the difference between reactive and preventive maintenance CPSF?
Reactive maintenance (fixing assets after they fail) costs $1.50–$2.50/sq ft more annually than preventive maintenance. A 100K sq ft store running reactive spends $350K/yr vs. $250K/yr with 80% PM compliance — a $100K difference. Preventive maintenance extends asset life 20–40% and cuts emergency callout fees by 50%+.
Can retail CMMS software benchmark across multiple locations?
Yes — the best retail CMMS 2026 platforms (like OxMaint) benchmark CPSF across unlimited locations in real time. Filter by region, format, climate, or asset age to identify outliers. See why Store #12 spends $4.20/sq ft while Store #8 runs $2.60/sq ft, then drill into work orders, vendors, and asset histories to fix the gap. Book a Demo to see multi-site benchmarking live.
How long does it take to see ROI from retail facility benchmark software?
Most retail portfolios see measurable CPSF reduction within 3–6 months. Quick wins (vendor renegotiation, warranty recovery, PM automation) deliver 10–15% savings in 90 days. Full ROI (20–35% CPSF reduction) typically takes 6–12 months as preventive maintenance scales and reactive spend drops. OxMaint customers average 28% CPSF reduction in the first year.
Ready to Benchmark Your Retail Portfolio?
Join 500+ retail facility teams using OxMaint to track CPSF, cut costs 20–35%, and prove maintenance ROI. Start your free trial or book a 30-minute demo — we'll show you your real cost per square foot in the first call.
Free 14-day trial · No credit card required · Set up in 15 minutes