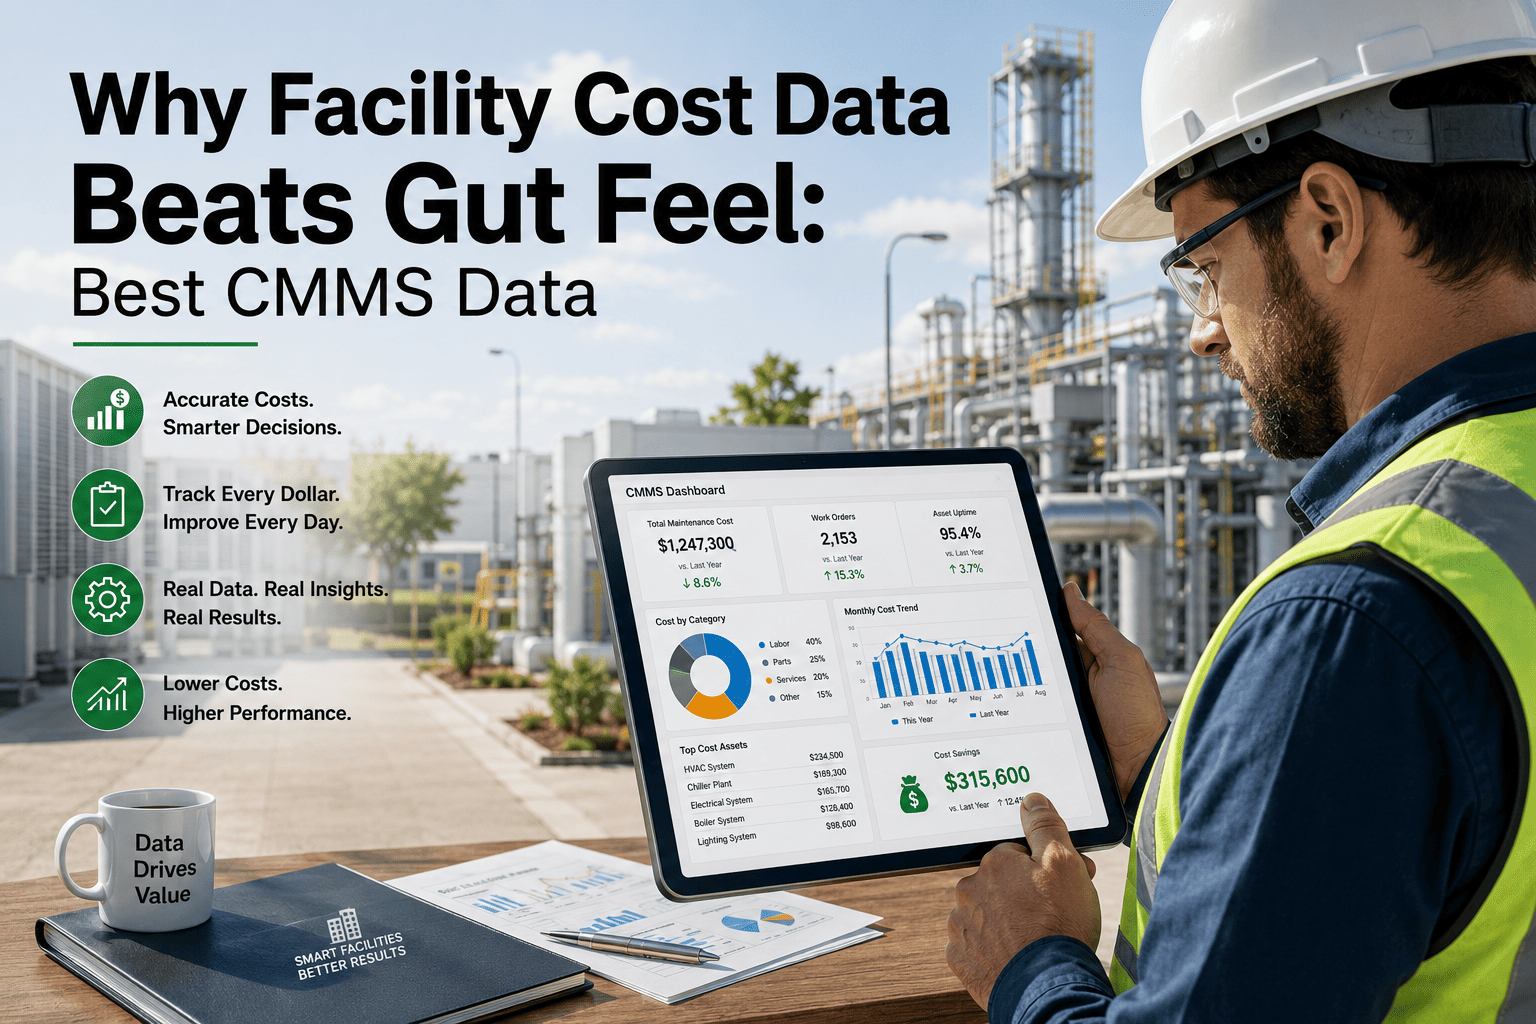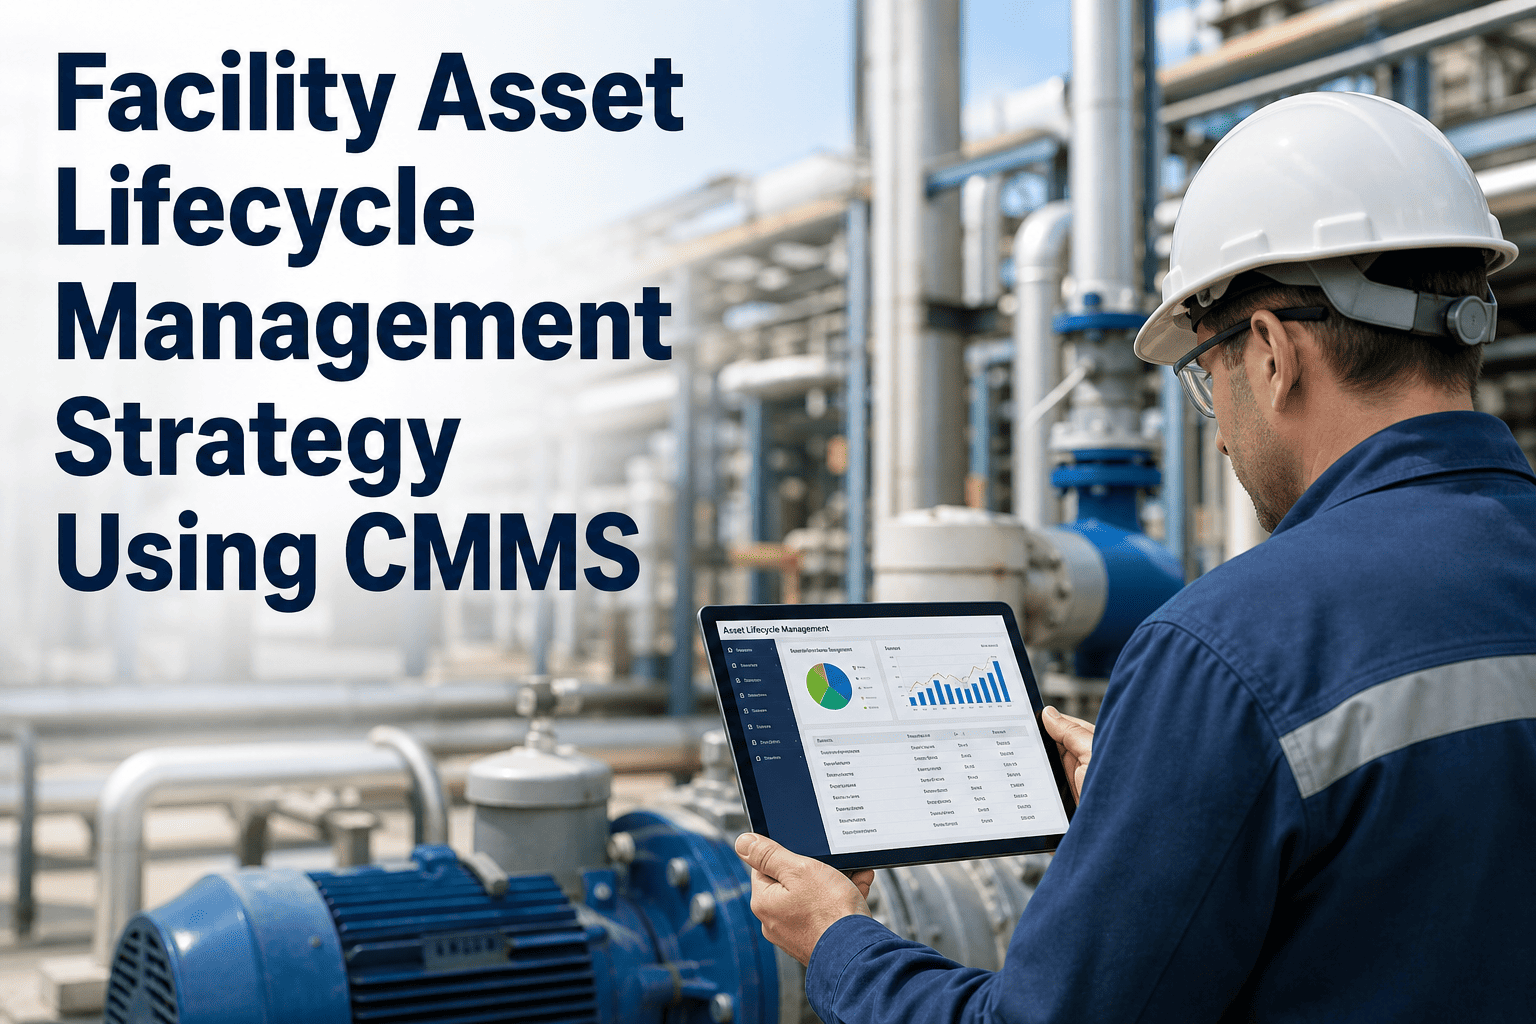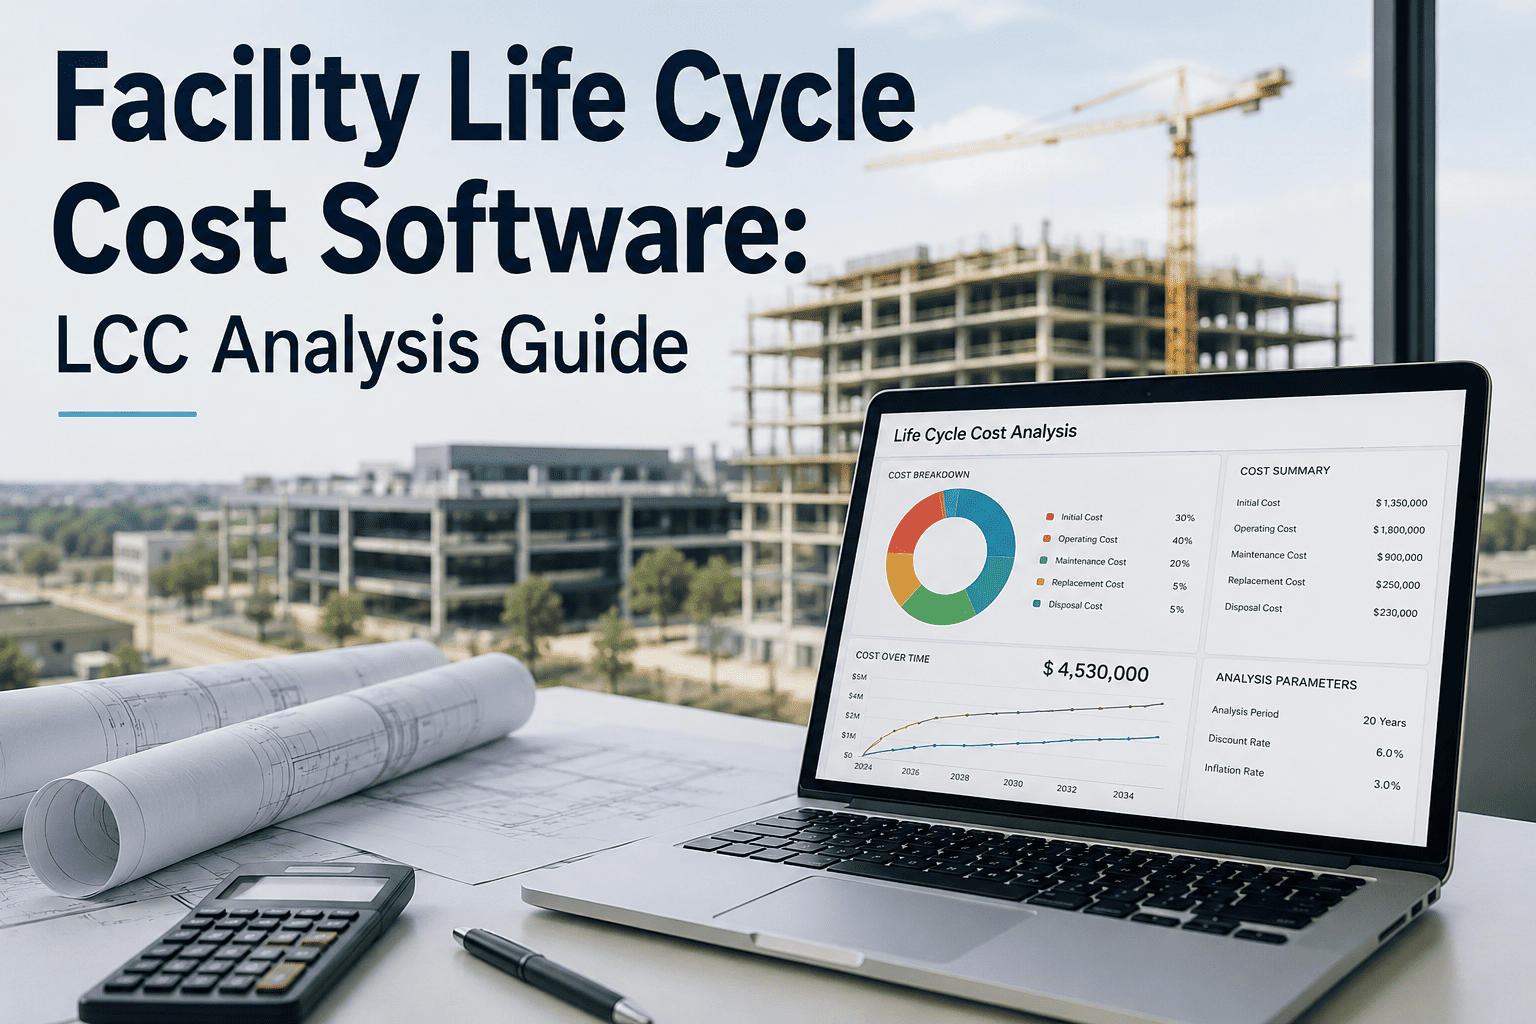
Every facility asset carries two price tags — the number on the purchase invoice, and the far larger number almost nobody tracks: total life cycle cost. A rooftop unit purchased for twenty-eight thousand dollars can carry a true lifetime cost well past a hundred thousand once energy, labor, parts, and downtime are added in, and most repair-versus-replace calls still get made on instinct because that second number lives nowhere. Facility teams running structured LCC analysis catch failing assets before they turn into budget disasters, and they can defend every capital request with numbers instead of a gut feeling. Life cycle cost software pulls that analysis straight from maintenance history so it updates itself instead of demanding a fresh spreadsheet every budget cycle. See how OxMaint's CMMS runs LCC analysis directly from your asset and work order data at app.oxmaint.ai.
Why Purchase Price Is the Wrong Number to Budget On
Most facility teams track two numbers well: the price on the purchase order and the annual maintenance contract. Almost nobody tracks the number that actually matters — total cost of ownership from acquisition to disposal. That gap is where poor capital decisions get born. A cheaper pump can look like the obvious buy on day one and still cost far more than the expensive option once twenty years of energy draw, unplanned repairs, and downtime are added to the ledger. Life cycle cost software closes that gap by pulling actual cost data out of the CMMS instead of asking a facility manager to reconstruct it from memory during budget season. The result is a repair-or-replace conversation grounded in the asset's own history rather than in whichever number happens to be easiest to find at the moment the question comes up.
The Five Cost Categories Every LCC Model Needs
A useful LCC analysis is only as good as the categories feeding it. Skip a category and the model quietly favors whichever option hides its costs best — usually the cheaper asset with the worse operating profile. OxMaint's asset cost tracking captures all five categories automatically from work orders, purchase records, and meter readings instead of relying on annual manual entry, so the numbers stay current without a separate data-collection effort each time a decision comes up.
Repair vs Replace — Reading the Threshold Correctly
The repair-versus-replace decision is really a comparison of two forward-looking life cycle costs, not a comparison of one repair bill against one purchase price. When the projected cost of continuing to operate and maintain an aging asset exceeds the projected life cycle cost of a new one over the same remaining period, replacement is the economically justified choice — even if the repair bill in front of you looks small. The eighty percent rule is a useful rough guide: once an asset has consumed roughly eighty percent of its expected service life and a major repair is due, replacement usually wins the comparison, though the table below breaks the decision into the individual signals worth checking before committing either way.
Running LCC Analysis in Five Steps
The math behind life cycle costing is not complicated — the hard part is assembling accurate inputs. A CMMS with cost tracking built into every work order removes that barrier by generating the inputs as a byproduct of normal maintenance activity, rather than a separate data-collection project every time someone asks for a repair-or-replace answer.
Where LCC Analysis Changes the Answer
Life cycle cost analysis matters most on the systems where purchase price is the smallest share of total cost. Rooftop HVAC, motors and pumps, roofing systems, and elevators are the categories facility teams most consistently under-budget for, because the biggest costs — energy and unplanned downtime — accrue quietly over years rather than showing up on one invoice at the point of purchase.
These thresholds are guides, not absolutes — a mission-critical asset with no acceptable downtime window may justify replacement well before the eighty percent mark, while a low-criticality unit with cheap, available parts can often run past it. The value of tracking all five signals together is that no single number makes the decision alone. A facility manager who sees rising failure frequency alongside falling energy efficiency has a far stronger case than one relying on age alone, and that combined signal is exactly what an LCC-aware CMMS surfaces automatically as work orders accumulate against the asset.
What to Look for in Facility LCC Software
Not every CMMS or point solution actually runs life cycle costing — many stop at work order history and leave the cost modeling to a spreadsheet. The platforms worth evaluating connect cost data automatically and present it in a form finance and facilities can both act on.
Facility LCC software is worth the switch when it removes a recurring manual task — pulling energy bills, cross-referencing work order spreadsheets, and reconstructing purchase history from old email threads every time a capital request comes up. The platforms that earn a permanent place in the budget process are the ones where the LCC number is already sitting on the asset record the moment someone asks the question, rather than something a team has to rebuild from scratch every time.
Six LCC Mistakes That Quietly Skew the Numbers
A life cycle cost model is only as trustworthy as its weakest assumption. Most facility teams that abandon LCC analysis after one attempt did not fail on the math — they fed the model incomplete or inconsistent inputs and lost confidence in the output. Watching for these six mistakes keeps the comparison honest enough to defend in front of a budget committee.
Turning LCC Output Into a Capital Plan Finance Will Approve
The output of an LCC analysis is only useful if it survives the trip from the facilities department to the finance committee. Budget approvers rarely push back on the math itself — they push back on where the numbers came from. A repair-versus-replace recommendation backed by three years of logged work orders, actual energy readings, and a documented failure trend is far harder to challenge than a recommendation built on a facilities manager's best estimate. This is the real value life cycle cost software adds beyond the calculation itself: a defensible audit trail behind every capital request.
Framing matters too. A request that says "this unit needs replacing" competes for budget against every other line item on instinct alone. A request that says "this unit's five-year forward maintenance and energy cost exceeds a new unit's five-year total cost by forty thousand dollars" competes on evidence, and evidence wins more budget cycles than urgency does. Facility teams that standardize LCC reporting across every major capital request tend to see faster approval cycles simply because the finance side spends less time asking clarifying questions.
Portfolio-level LCC data compounds in value over time. A single asset's life cycle cost tells you whether to repair or replace that one unit. A portfolio of LCC data across every rooftop unit, pump, and elevator tells you which asset classes are systematically underperforming their expected life — often pointing to a manufacturer, an installation vintage, or an operating condition that deserves attention beyond the individual repair decision in front of you. Over several budget cycles, that portfolio view becomes the basis for a genuine capital plan rather than a reactive list of whatever broke most recently, letting facility leadership sequence replacements by actual cost impact instead of by which failure was loudest.