Base rent is the number every lease negotiation revolves around, and it is also the number that hides the real cost of a facility. Industry data consistently shows base rent makes up only roughly two-thirds of what a space actually costs once operating expenses, utilities, maintenance, and fees are added — meaning most facility budgets are built on a figure that understates reality by 30 to 50 percent. Total Cost of Occupancy is the metric that corrects for this, rolling every recurring cost of running a space into one number a board can actually act on. This guide breaks down exactly what belongs in a TCO calculation, current market benchmarks, and how facility teams are using software like OxMaint to keep that number accurate all year instead of rebuilding it once a year in a spreadsheet.
Total Cost of Occupancy Software: The One Number Your CFO Actually Wants
What actually belongs in a TCO calculation, current per-square-foot benchmarks, and how CMMS software keeps rent, utilities, maintenance, and services rolled into a single live metric.
What Total Cost of Occupancy Actually Includes
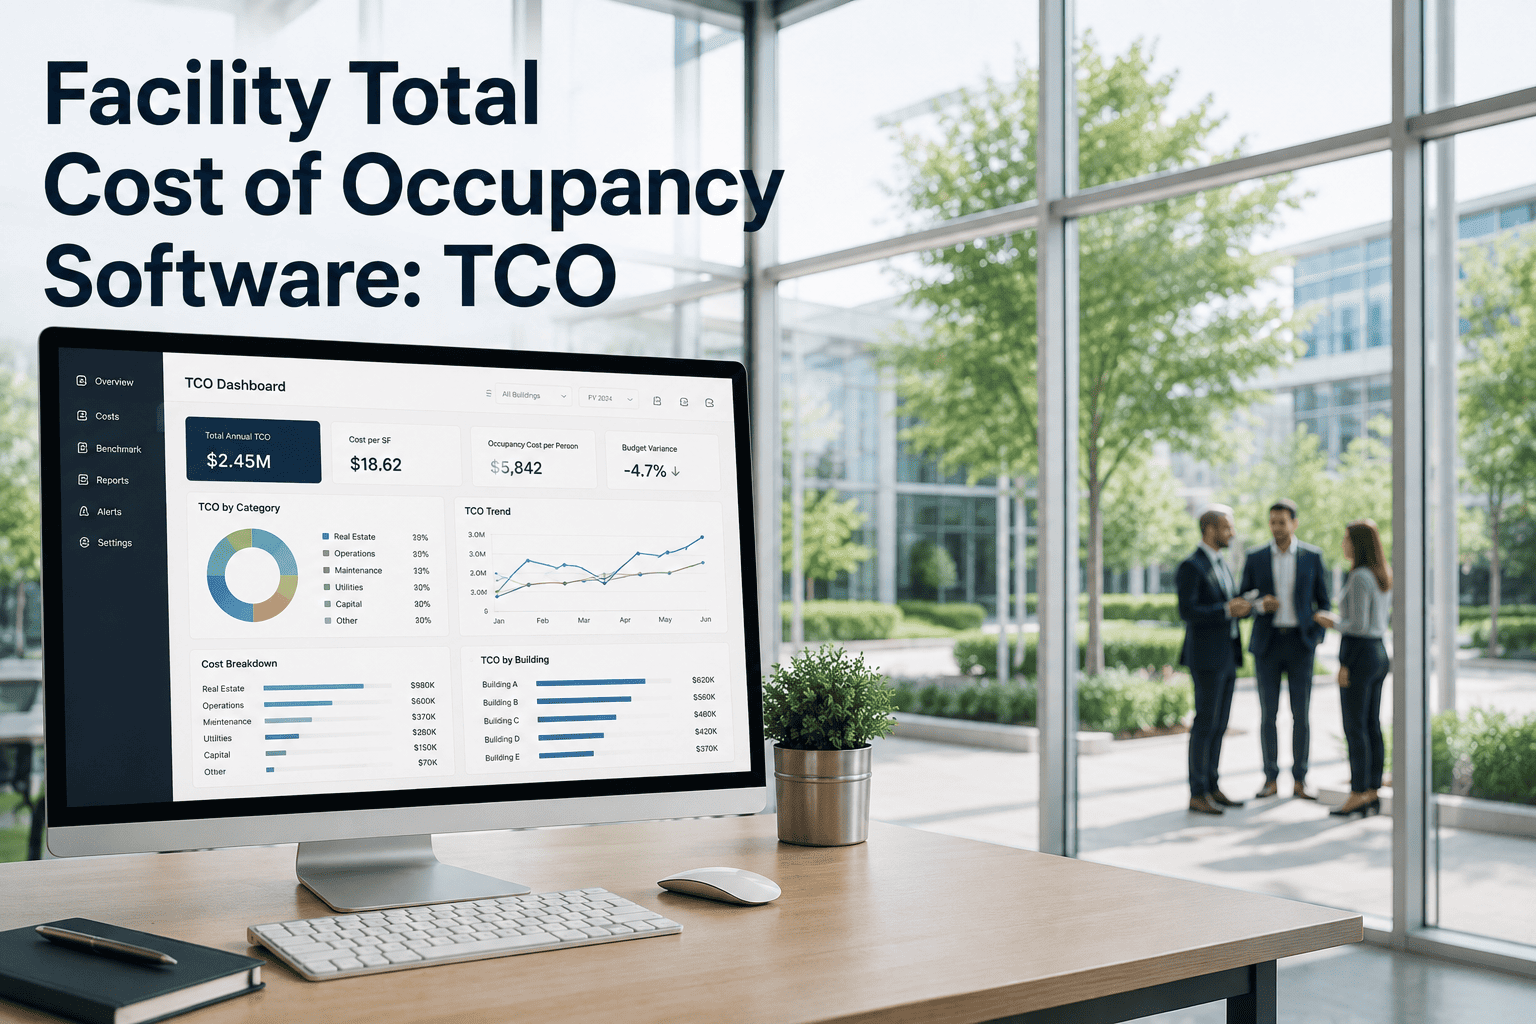
TCO is the sum of every recurring cost tied to occupying a space — not just the number printed in the lease. A widely used example illustrates the gap clearly: a $40 per square foot base rent can carry another $21 per square foot in operating expenses, utilities, maintenance, and fees once every line item is added, pushing the real cost to $61 per square foot with base rent covering only about 65% of the total.
Illustrative breakdown based on a commonly cited $61/SF total occupancy cost example — your actual mix will vary by lease type and market.
Stop Rebuilding Your TCO Number Every Budget Cycle
OxMaint tracks maintenance spend, asset condition, and service costs against every facility in your portfolio — the operating half of TCO that changes month to month.
The Hidden Cost Lines Most Facility Budgets Miss
The gap between quoted rent and real occupancy cost almost always comes from the same handful of line items — costs that exist in every lease but rarely appear in the headline number a broker quotes.
Maintenance Spend Benchmarks by Building Class
Maintenance is one of the few TCO components a facility team directly controls — and one of the easiest to benchmark against industry data to know whether current spend is competitive or a sign of reactive overspend.
| Building Class | Direct Maintenance Spend | Fully Loaded (with Utilities & Mgmt) |
|---|---|---|
| Class A | Higher end of range | Premium finishes and BMS drive top-end cost |
| Class B | Mid-range, solid systems | Without Class A automation or redundancy |
| All classes, direct spend only | Typically $2–$4 per SF | Excludes utilities, management, and janitorial |
| Fully loaded operating cost | — | $10–$25 per SF once fully loaded |
Rent-Only View vs a Real TCO View
Comparing two properties on rent alone is comparing two incomplete pictures. A true TCO view changes decisions — the cheaper rent is not always the cheaper occupancy.
See Maintenance Spend Rolled Into One Portfolio View
OxMaint gives facility directors a live dashboard of maintenance cost, asset condition, and completed work across every site — the data your TCO model actually needs.
Frequently Asked Questions
Give Your Leadership Team a TCO Number They Can Actually Trust
Rent is only part of the story. OxMaint tracks the maintenance, asset condition, and operating cost data that turns a rough estimate into a real, defensible total cost of occupancy — live in days, not a spreadsheet rebuilt every quarter.