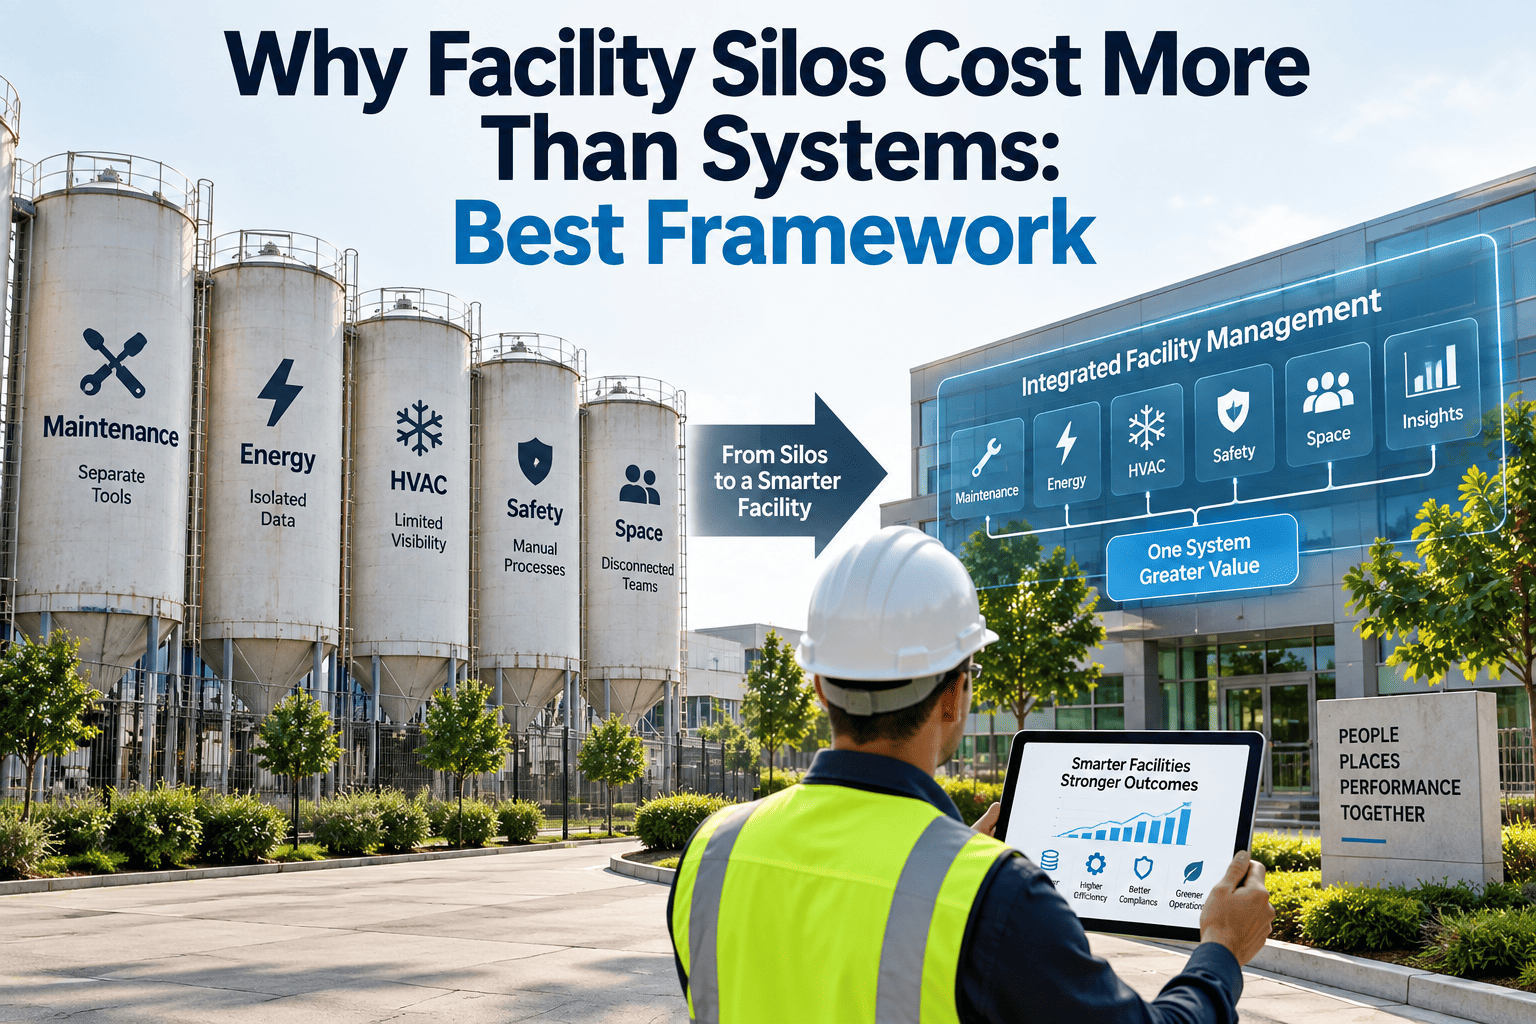
A mid-size hospital runs its chillers on a building system, logs repairs on a spreadsheet, and tracks compliance in a shared drive — three tools that never talk to each other. A failing chiller shows up as a comfort complaint weeks before anyone connects it to rising energy bills or a missed maintenance cycle. This is a silo, and it is rarely the software itself that costs a facility money — it is the gap between the systems, where a useful signal never reaches the team that could have acted on it. Oxmaint's connected maintenance platform was built to close that gap for facility teams everywhere.
The Five Silos Draining Facility Budgets Every Month
Facility teams rarely have one big software problem. They have five smaller, recurring gaps that compound quietly across a year, each one invisible on a monthly budget line but obvious once you add up the total. Each silo below looks harmless on its own — a spreadsheet here, a separate login there — but together they are why facilities spend far more keeping the lights on than the maintenance budget should require. A connected CMMS closes each of these gaps from a single record of truth that every team can rely on.
Work Orders in Spreadsheets
Technicians log repairs on paper or shared sheets that supervisors reconcile manually. Asset history is scattered, and repeat failures go unnoticed until the third or fourth breakdown.
BMS Data Nobody Reads
Building management systems generate thousands of alarms a month, but without a link to the maintenance team, most alerts are acknowledged and forgotten rather than turned into a scheduled fix.
Audit Trails in Email
Inspection certificates, safety checks, and regulatory documents live in inboxes and folders. When an auditor asks for proof, teams spend days assembling records instead of minutes.
ERP Cost Codes That Don't Match
Maintenance spend is coded differently in the CMMS and the ERP, so finance and facilities argue over numbers instead of agreeing on where the budget is actually going.
IoT Sensors With No Owner
Vibration and temperature sensors stream data to a vendor dashboard that the maintenance team never opens, so early warning signs sit unused until the asset fails anyway.
See What Your Facility Looks Like With Every System in One Place
Oxmaint connects your CMMS, BMS, IoT sensors, and compliance records into a single operating view, so nothing valuable gets lost between logins again.
From Disconnected Systems to One Command Center
Breaking down a silo is not about replacing every tool a facility already owns. It is about building one connective layer that pulls the right data out of each system and puts it in front of the person who needs to act on it, at the moment it matters most. Facility teams that try to solve this by adding yet another dashboard usually end up with a seventh login and the same blind spots. Below is the five-stage path most facility teams follow when they move from disconnected tools to a single operating picture that every stakeholder can trust.
Inventory Every System in Use
List every tool touching facility operations — CMMS, BMS, ERP, IoT platforms, spreadsheets, and inspection apps — and note which team owns each one and what data it holds.
Link Data Sources to One Platform
Route BMS alarms, IoT sensor feeds, and ERP cost codes into a connected CMMS so every signal lands in one place instead of a separate, disconnected dashboard.
Align Asset Names and Cost Codes
Give every asset one consistent identifier across maintenance, finance, and compliance records, so a chiller in the CMMS is the same chiller in the ERP and the audit log.
Turn Signals Into Work Orders
Set rules so a BMS alarm or sensor threshold automatically opens a work order with the right priority, instead of waiting for someone to notice and manually create one.
Give Every Stakeholder One View
Facility managers, finance teams, and auditors each get a live view built from the same underlying data, ending the back-and-forth over whose numbers are correct.
Five Signs Your Facility Already Has a Silo Problem
Most facility teams do not notice a silo forming until the cost shows up somewhere unexpected — a spike in reactive repairs, a failed audit, or a budget review nobody can explain. Watch for these five warning signs, because each one usually means a signal from one system is not reaching the team that needed it.
Technicians hear about a failure from a tenant, not a sensor
If a comfort complaint is the first signal your team receives, the equipment data that could have warned you earlier is sitting unused somewhere else.
Finance and facilities report different maintenance totals
Mismatched numbers almost always trace back to cost codes that were never aligned between the CMMS and the ERP.
Audit prep takes days instead of minutes
If your team is searching inboxes and shared drives for inspection certificates, your compliance records are not connected to your asset data.
The same asset has different names in different systems
A chiller listed as "AHU-4" in one tool and "Chiller North" in another means nobody can trust a cross-system report.
Sensor dashboards exist that nobody on the maintenance team opens
Paying for IoT monitoring without routing its alerts into a work order is one of the most common and expensive silos in facility operations.
What an Integrated Facility Actually Looks Like Day to Day
The difference between a siloed facility and a connected one is not visible in a single dashboard screenshot — it shows up in how quickly a signal turns into an action, and how little manual work sits between the two. The panel below reflects the kind of daily activity a facility team sees once their systems are linked through one platform, with every alert, sensor trend, and compliance record already routed to the right person before anyone has to go looking for it.
Built for Every Facility-Heavy Industry
Silos do not look the same in every industry, but the pattern behind them is identical: a maintenance system, a building system, a compliance record, and a finance ledger that never talk to each other. Oxmaint's maintenance management software is built to sit underneath any facility-heavy operation and give every team the same connected picture, whatever the building looks like or how many sites it needs to cover. The industries below face different regulations and different equipment, but they lose budget to the exact same disconnected pattern every month.
Hospitals and Clinics
Critical equipment uptime, infection-control compliance, and biomedical asset tracking are linked to one maintenance record, so a failed sterilizer or chiller never becomes a patient-safety event.
Plants and Warehouses
Production line sensors, spare parts inventory, and preventive maintenance schedules connect directly, cutting the unplanned downtime that stops a shift before it starts.
Office and Retail Portfolios
Property managers see building system alarms, vendor work orders, and tenant requests from every site in one dashboard instead of chasing separate property management logins.
Campuses and School Districts
Facilities staff track classroom HVAC, safety inspections, and capital planning across dozens of buildings without losing history when a technician or vendor changes.
Hotels and Resorts
Guest-facing equipment issues, housekeeping requests, and preventive maintenance run through one system, so a broken air conditioner reaches a technician before it reaches a guest review.
Silo → Hidden Cost → Fix
Every silo has a traceable cost and a specific fix, and most facility leaders are surprised how quickly the numbers add up once each gap is priced out on its own. The table below maps the five silo types facility teams encounter most often to the budget impact they quietly create and the integration step that resolves each one for good.
| Silo Type | Where the Cost Hides | Annual Impact | Fix |
|---|---|---|---|
| Spreadsheet work orders | Repeat failures go unnoticed until asset replacement | $30–60K per site | Centralised CMMS history |
| Unread BMS alarms | Comfort and energy issues escalate before action | $15–25K per site | Auto work order routing |
| Email-based compliance | Audit preparation time and missed renewal dates | $10–18K per site | Digital audit trail |
| Mismatched ERP codes | Budget disputes and delayed capital approvals | $8–14K per site | Shared cost code mapping |
| Orphaned IoT data | Early failure signals never reach a technician | $20–35K per site | Sensor-to-work-order rules |
Where the Recovered Budget Actually Goes
Once the five silos above are closed, the savings do not show up as one dramatic line item — they show up as fewer emergency callouts, faster audits, and a maintenance budget that finally matches what finance expects to see. The scenario below reflects a typical six-site portfolio after a full integration project.
Facility teams rarely lose money because they picked the wrong software. They lose money in the space between systems, where a signal from a sensor or a building management system never reaches the person who could act on it in time. The moment we connected work orders, compliance records, and cost codes to one shared view, reactive calls dropped and budget conversations stopped being arguments over whose numbers were right. That single change paid for the entire project within a year. What surprised our team most was how much of the recovered budget came from compliance, not maintenance — once audit records lived next to asset history, preparation time nearly disappeared, and our regulators noticed the difference immediately.
Frequently Asked Questions
Stop Paying for the Gaps Between Your Facility Systems
Oxmaint brings maintenance, compliance, IoT, and cost data into one connected platform built for facility teams across healthcare, manufacturing, real estate, education, and hospitality alike.