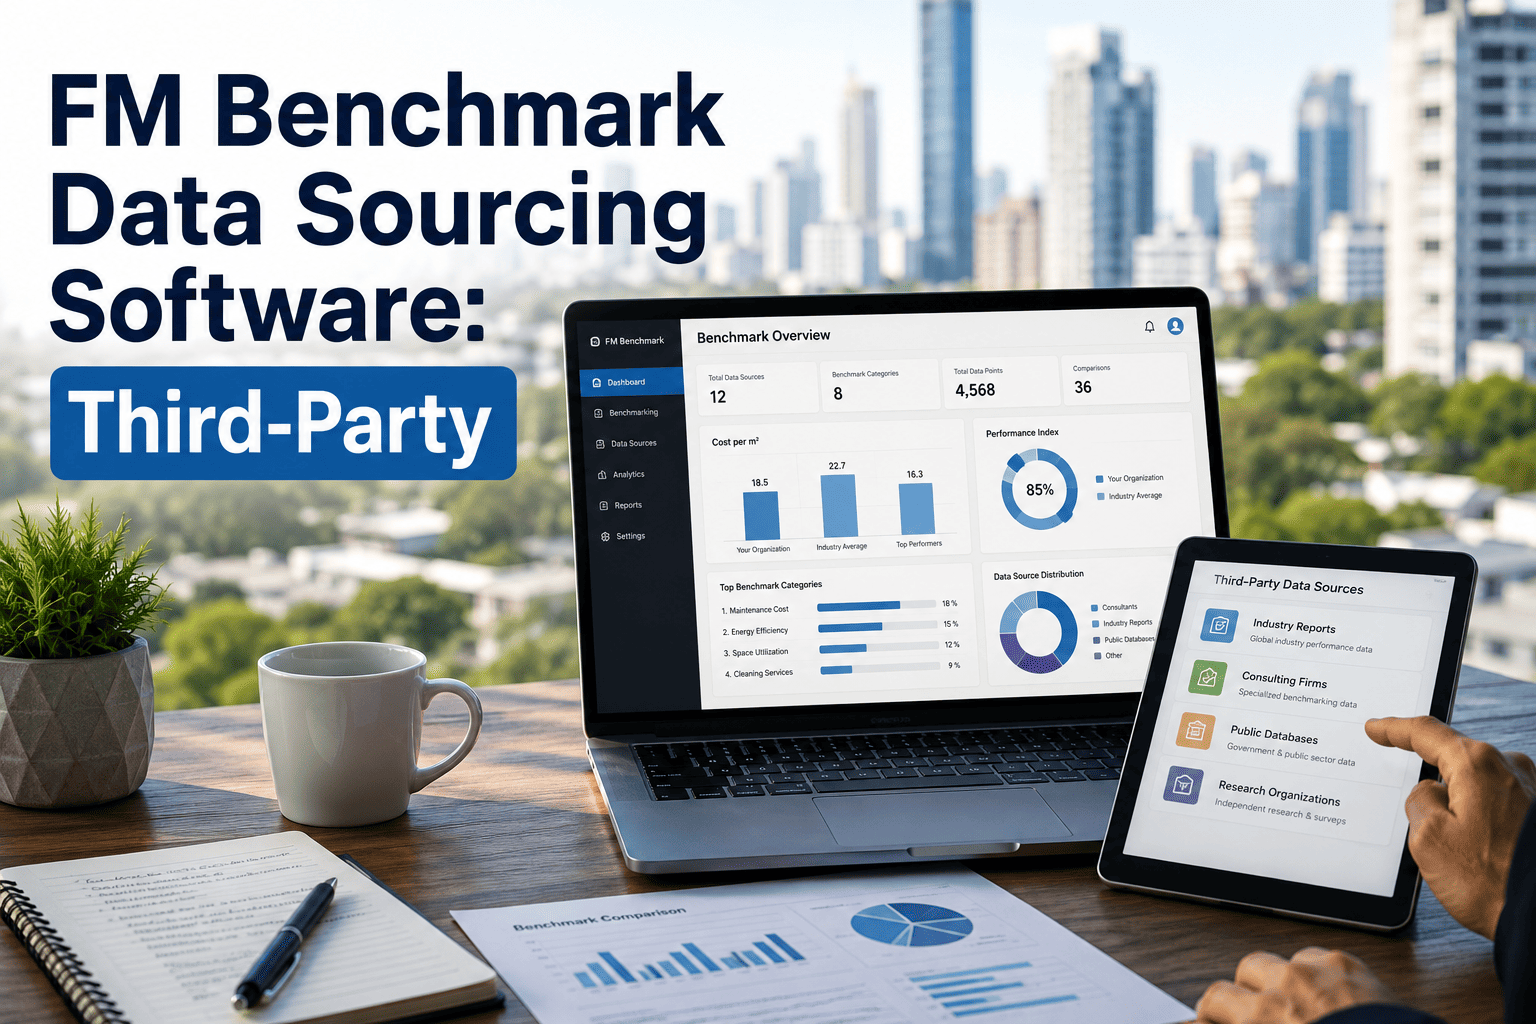
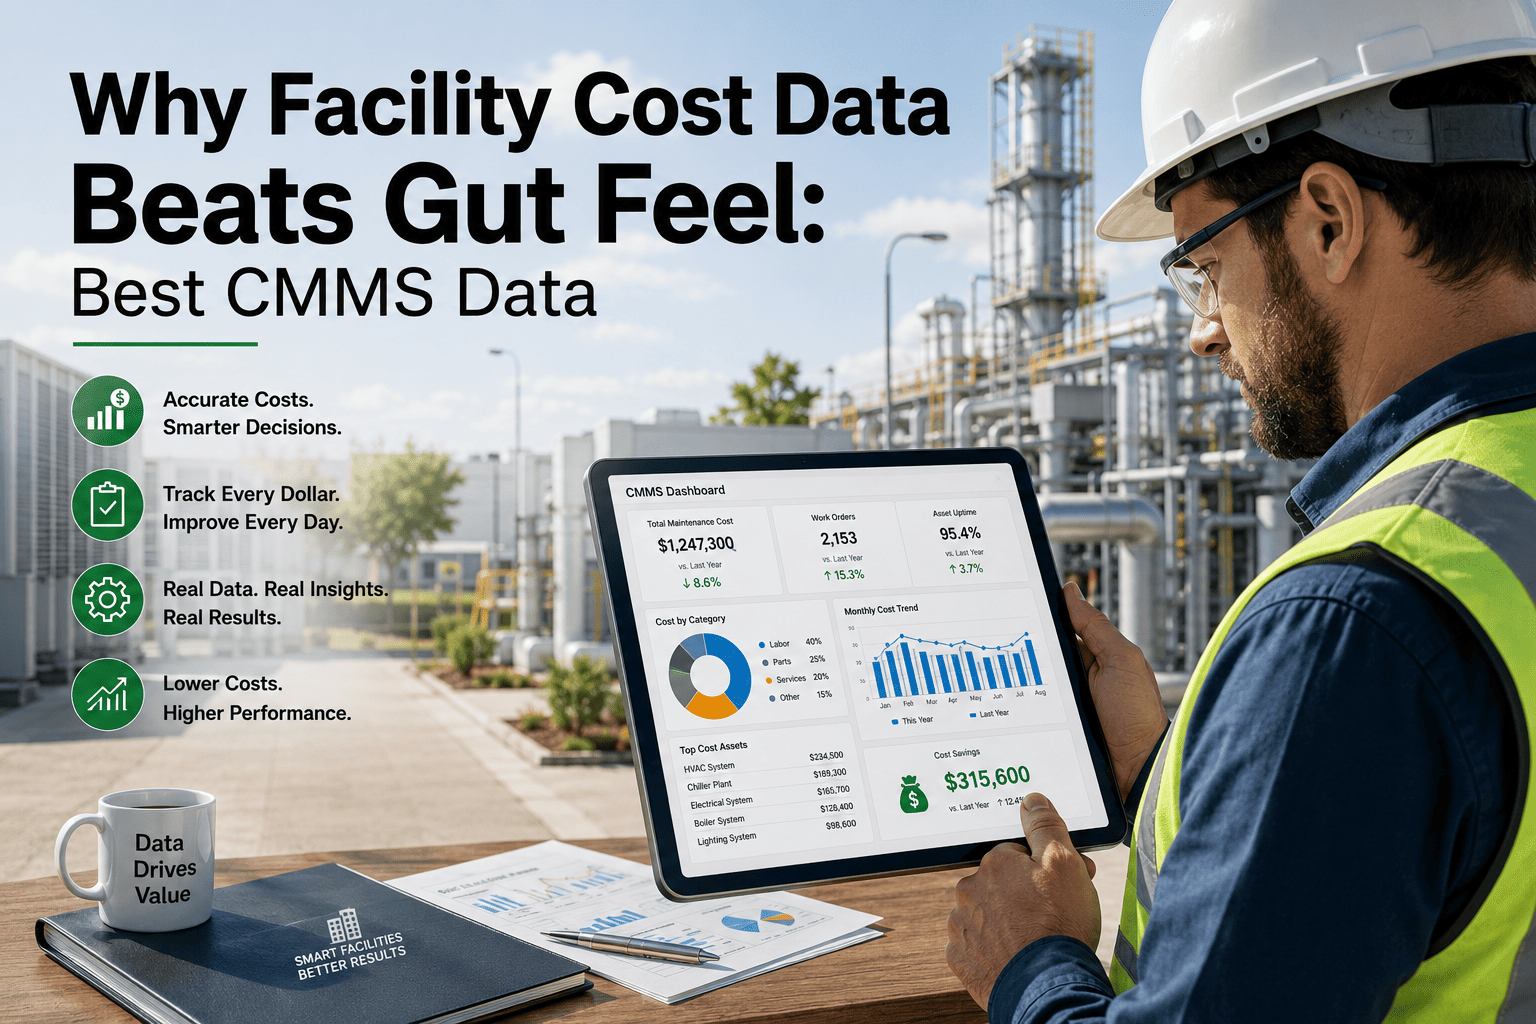
Every facility manager eventually asks the same question during a budget review: is our maintenance spend high, low, or normal for a building like ours? Answering that requires benchmark data — cost per square foot, PM compliance rates, energy intensity, staffing ratios — pulled from outside your own four walls. Most teams source this from a patchwork of association reports, cost-estimating databases, and trade publications that never talk to each other, and never talk to the CMMS where the comparison actually needs to happen. The result is a benchmarking exercise that takes weeks, produces numbers nobody fully trusts, and goes stale the moment it is finished. Book a demo to see how OxMaint brings third-party benchmark data directly into your facility dashboards.
Guide · Facility Benchmarking · Third-Party Data
FM Benchmark Data Sourcing Software: Third-Party Integrations Explained
A practical look at where facility benchmark data actually comes from, how the major third-party sources compare, and how modern CMMS platforms pull that data straight into a working dashboard instead of a stale PDF.
Four Sources This Guide Covers
IFMA
Operations and maintenance benchmarking survey data by facility type
BOMA
Office and commercial building operating expense reports
RS Means
Unit cost data for repair, replacement, and capital work
Plant Engineering
Industrial maintenance practice and reliability survey data
Why Sourcing Benchmark Data Manually Is Slower Than It Should Be
Benchmark data is not hard to find. It is hard to keep current, hard to normalize against your own portfolio, and hard to get in front of the people making budget decisions before the numbers are out of date. Three problems show up in almost every facility team that benchmarks manually.
Problem One
Sources Are Scattered
Association reports live in one login, cost databases in another, and trade publication surveys arrive as annual PDFs that get saved to a shared drive and forgotten. Nobody owns pulling these together on a schedule.
Problem Two
Data Goes Stale Fast
Unit costs and operating benchmarks shift with labor rates, material pricing, and market conditions. A comparison built from a report published eighteen months ago understates or overstates the gap you are actually working with.
Problem Three
Context Gets Lost
A national average cost per square foot means little without adjusting for building type, climate zone, and asset age. Manual benchmarking rarely has time to apply that adjustment, so the comparison misleads more than it informs.
Third-Party Benchmark Data Sources Compared
Each of the major sources covers different ground. Knowing what each one is actually good for keeps you from pulling the wrong number into the wrong comparison.
| Source |
Primary Coverage |
Update Cycle |
Best Use In A CMMS Dashboard |
| IFMA |
Operations and maintenance staffing, budget, and outsourcing benchmarks segmented by facility type and region |
Survey-based, typically refreshed every one to two years |
Staffing ratio and total maintenance spend comparisons against similar building types |
| BOMA |
Detailed operating expense breakdowns for office, industrial, and mixed-use commercial buildings |
Annual experience exchange report |
Operating cost per square foot comparisons for lease negotiations and owner reporting |
| RS Means |
Granular unit costs for labor, materials, and equipment across repair, replacement, and construction line items |
Updated regularly with regional cost modifiers |
Work order cost validation and capital project budget estimating |
| Plant Engineering |
Industrial reliability and maintenance practice survey data, including PM versus reactive maintenance ratios |
Annual maintenance survey publication |
Reliability program maturity benchmarking against industrial peers |
Regional And Building-Type Adjustments You Cannot Skip
A national average benchmark is a starting point, not an answer. Before a comparison goes into a budget presentation, it needs to be adjusted for the variables that actually explain most of the gap between your numbers and the published figure.
Adjustment One
Regional Labor And Material Rates
Labor costs in a major metro can run well above a national average, and material pricing swings by region too. RS Means regional modifiers exist specifically to correct for this before a cost comparison is treated as final.
Adjustment Two
Building Type And Age
A forty year old building with original mechanical systems will not benchmark the same as a five year old build, even in the same city. IFMA and BOMA segment their data by building age band for exactly this reason, and skipping that segmentation produces a misleading comparison.
Adjustment Three
Occupancy And Usage Pattern
A twenty-four hour operation and a standard office schedule will never land on the same maintenance cost curve. Adjusting for hours of operation and occupancy density before comparing against a benchmark keeps the conversation grounded in something your leadership can act on.
FACILITY BENCHMARKING · OXMAINT
Stop Rebuilding The Same Benchmark Report Every Quarter
OxMaint pulls third-party benchmark references into the same dashboard your team already uses for work orders and asset data, so the comparison is live instead of a one-time export.
How Benchmark Data Flows Into A Working Dashboard
Pulling in a benchmark source is only useful if it lands somewhere your team actually looks. The flow below is how that connection typically gets built.
1
Connect The Reference Source
Benchmark figures from association reports and cost databases are loaded into the CMMS as reference tables, tagged by facility type, region, and reporting year so they can be matched to the right portfolio segment.
2
Normalize Against Your Portfolio
Your own work order costs, PM compliance rates, and asset data are mapped to the same categories as the benchmark source, so a like-for-like comparison is possible instead of a rough national average.
3
Surface The Comparison On The Dashboard
Your actual cost per square foot, PM compliance, and staffing ratio sit next to the benchmark figure on the same screen, updated automatically as new work orders close and new benchmark data is loaded.
4
Flag Meaningful Gaps
When a metric drifts materially outside the benchmark range, the dashboard flags it for review rather than waiting for the next quarterly report to surface the variance after the budget cycle has already closed.
What Facility Teams Actually Do With The Comparison
Benchmark data earns its place in a dashboard when it changes a decision. Here is where facility teams put it to work once the comparison is live and current rather than sitting in an annual PDF.
A
Defending A Budget Line
When leadership questions why maintenance spend rose year over year, a live comparison against an IFMA or BOMA benchmark gives the facility director a defensible answer grounded in industry data rather than an internal justification alone.
B
Negotiating With Vendors
RS Means unit costs give a facility team a reference point when a vendor quote comes in well above the expected range, turning a negotiation from a guess into a conversation backed by published cost data.
C
Triggering A Capital Planning Review
When a building's cost per square foot climbs well past its benchmark peer group and stays there for multiple reporting periods, that pattern is often the trigger for a deeper capital condition review rather than another year of reactive repairs.
D
Justifying Staffing Levels
IFMA staffing ratio benchmarks give facility directors a reference for whether a maintenance team is understaffed relative to comparable portfolios, which is a far stronger argument in a headcount request than internal workload estimates alone.
Common Mistakes When Benchmarking Against Third-Party Data
Most benchmarking efforts do not fail because the source data is wrong. They fail because of how the comparison gets built and presented.
Mistakes To Avoid
Comparing raw national averages without adjusting for region, building age, or occupancy pattern
Using a benchmark report that is more than two reporting cycles old as if it reflects current conditions
Mixing benchmark sources without noting that each one defines cost categories slightly differently
Presenting a single point-in-time comparison instead of a trend line against the benchmark over several periods
Treating a favorable comparison as a reason to stop tracking rather than a baseline to maintain
Choosing A Data Sourcing Platform: Evaluation Checklist
Not every CMMS handles third-party benchmark data the same way. Use this checklist when evaluating a platform for this specific capability.
Platform Evaluation Checklist
Can the platform import benchmark reference tables and tag them by facility type and region
Does the dashboard show your actual metrics alongside the benchmark figure, not in a separate export
Can benchmark reference data be refreshed without a full system reconfiguration each time
Does the platform normalize your data into the same categories the benchmark source uses
Are variance alerts available so gaps surface automatically instead of waiting on a manual report
Building A Repeatable Benchmarking Cadence
A benchmark comparison built once, for one presentation, rarely survives past that meeting. Facility teams that get lasting value out of third-party data set up a cadence and stick to it, rather than treating benchmarking as a one-time data pull.
Step One
Set A Fixed Review Interval
Quarterly is common for cost and PM compliance metrics, while staffing and reliability benchmarks that update less frequently can be reviewed on an annual cycle tied to the budget calendar.
Step Two
Assign Ownership
Someone needs to own loading new benchmark data as it is published and confirming the normalization mapping still holds, otherwise the comparison quietly drifts out of date without anyone noticing until a review meeting exposes the gap.
Step Three
Track The Trend, Not Just The Snapshot
A single comparison tells you where you stand today. A trend line against the same benchmark over several periods tells you whether the gap is closing, holding steady, or widening, which is the version of the data that actually drives a decision.
Expert Review
Facility teams rarely lack access to benchmark data. What they lack is a place to put it where it stays useful. A report downloaded once a year and filed away answers a question in the moment it is read and nothing after that. The teams that actually use benchmarking to change behavior are the ones who see their own numbers sitting next to the reference figure every time they look at a dashboard, not once a year during budget season. That single shift, from a report to a live comparison, is what turns benchmarking from a compliance exercise into an operating habit. The strongest programmes I have reviewed treat benchmark data the same way they treat a work order backlog report: something checked on a normal cadence, discussed in a normal meeting, and acted on before a small drift becomes a budget surprise. That only happens when the comparison lives inside the system the team already opens every day, not in a folder reserved for audit season.
Maria Delgado, CFM
Certified Facility Manager · 14 years facility operations and benchmarking programme management across commercial and industrial portfolios
Frequently Asked Questions
What is the difference between IFMA and BOMA benchmark data?
IFMA benchmarks focus on facility operations broadly, including staffing and maintenance spend across many facility types. BOMA data is narrower and centers on detailed operating expenses for commercial office and mixed-use buildings, making it more precise for lease and ownership reporting.
How often should benchmark data be refreshed in a CMMS dashboard?
Most association benchmark sources publish annually or every two years, so a dashboard refresh on that same cycle keeps the comparison current.
Start free to see how reference tables are updated without reconfiguring your dashboard.
Can RS Means data be used for anything besides capital project estimating?
Yes. Unit cost data from RS Means is also useful for validating whether a completed work order's labor and materials cost fell within a reasonable range, which helps flag pricing outliers from vendors before they become a pattern.
Is Plant Engineering benchmark data relevant outside heavy industry?
It is most directly relevant to industrial and manufacturing facilities, but the underlying PM versus reactive maintenance ratios it tracks are a useful reference for any facility team working to shift from reactive to planned maintenance.
Does OxMaint pull benchmark data automatically from these sources?
OxMaint loads benchmark reference tables from published association and industry data into your dashboard alongside your own metrics.
Book a demo to see the current source integrations in a live walkthrough.
FACILITY BENCHMARKING · OXMAINT
Turn Benchmark Data Into A Habit, Not An Annual Report
OxMaint brings IFMA, BOMA, RS Means, and industry survey benchmarks into the same dashboard your team already uses, so every budget conversation starts with a live comparison instead of a spreadsheet from last year.