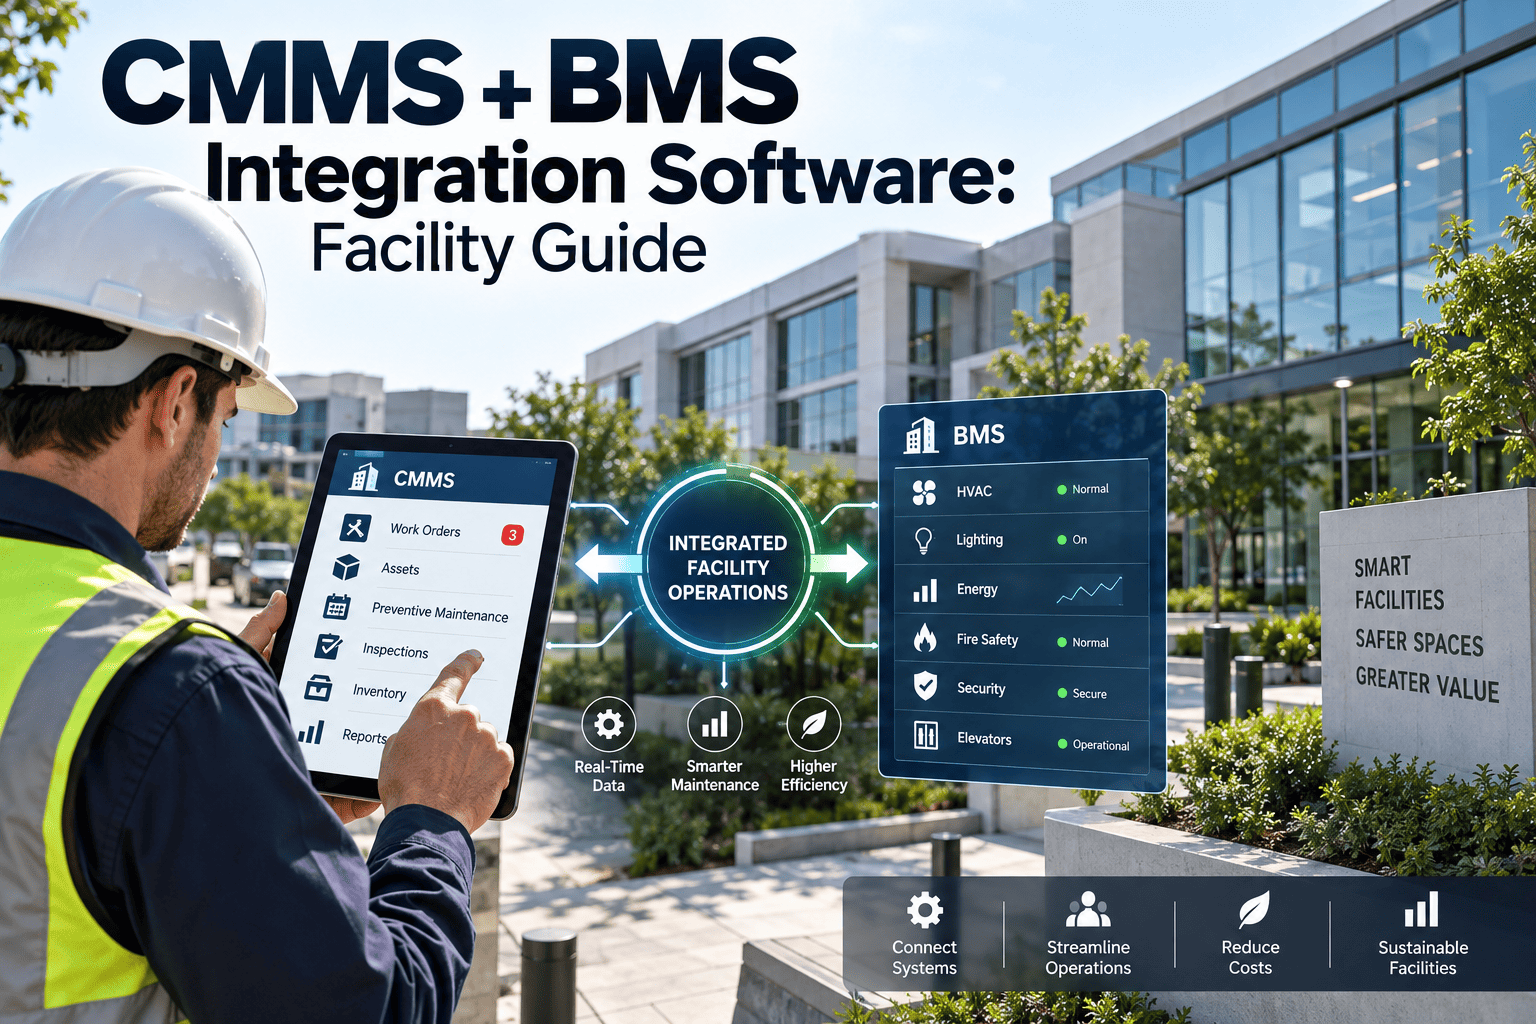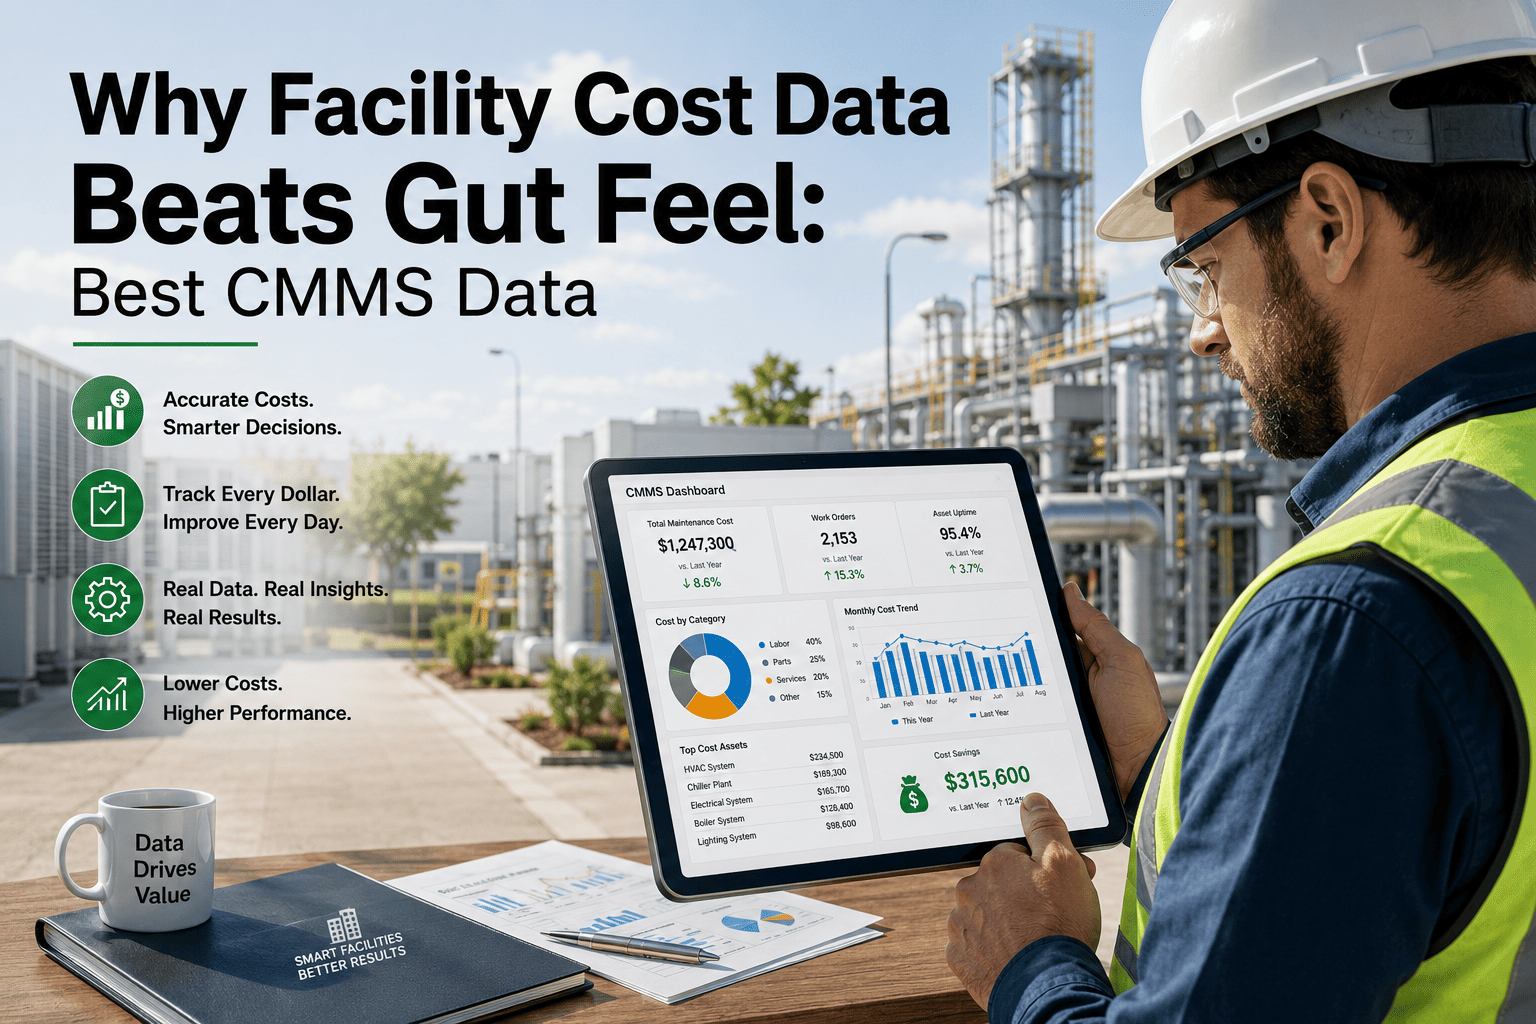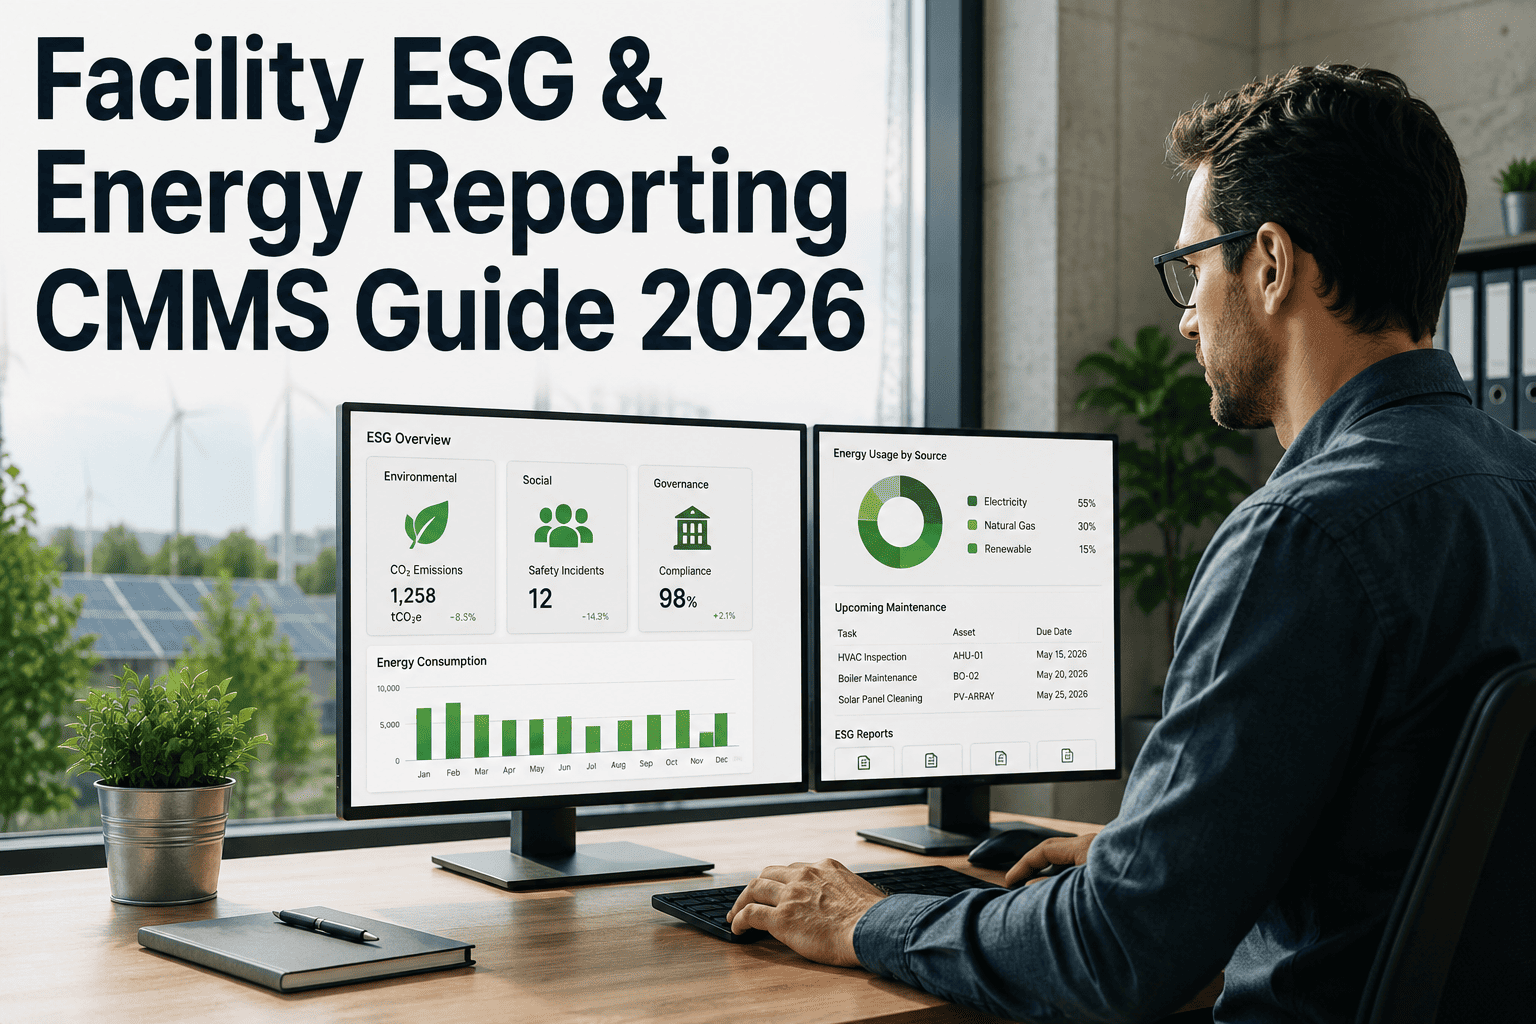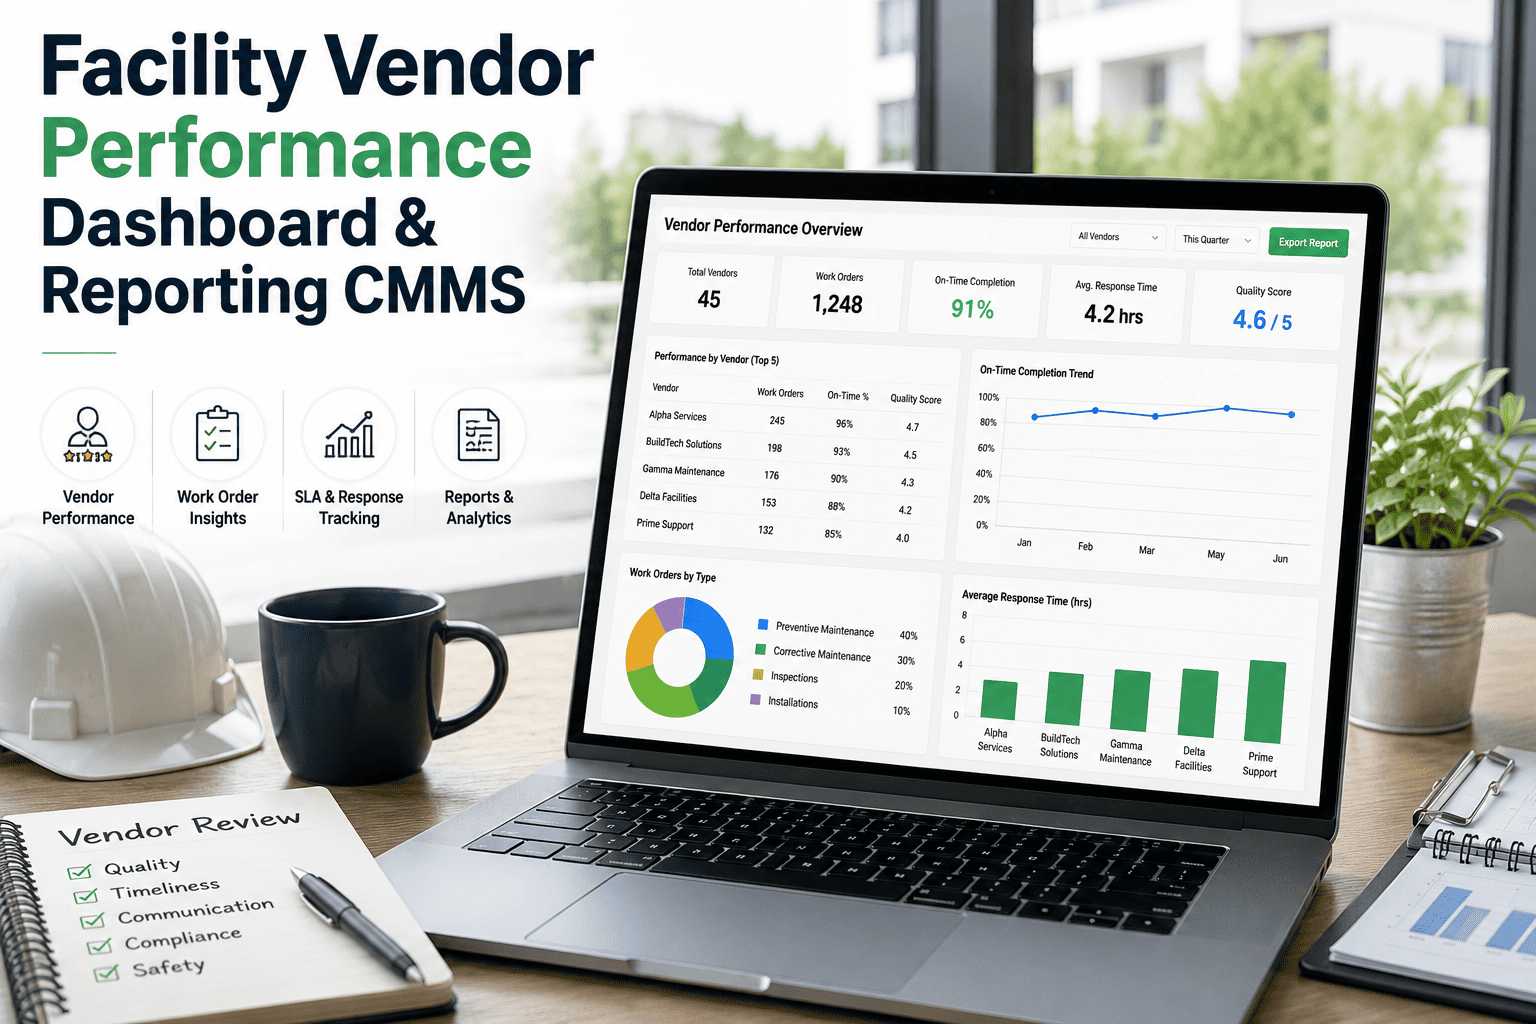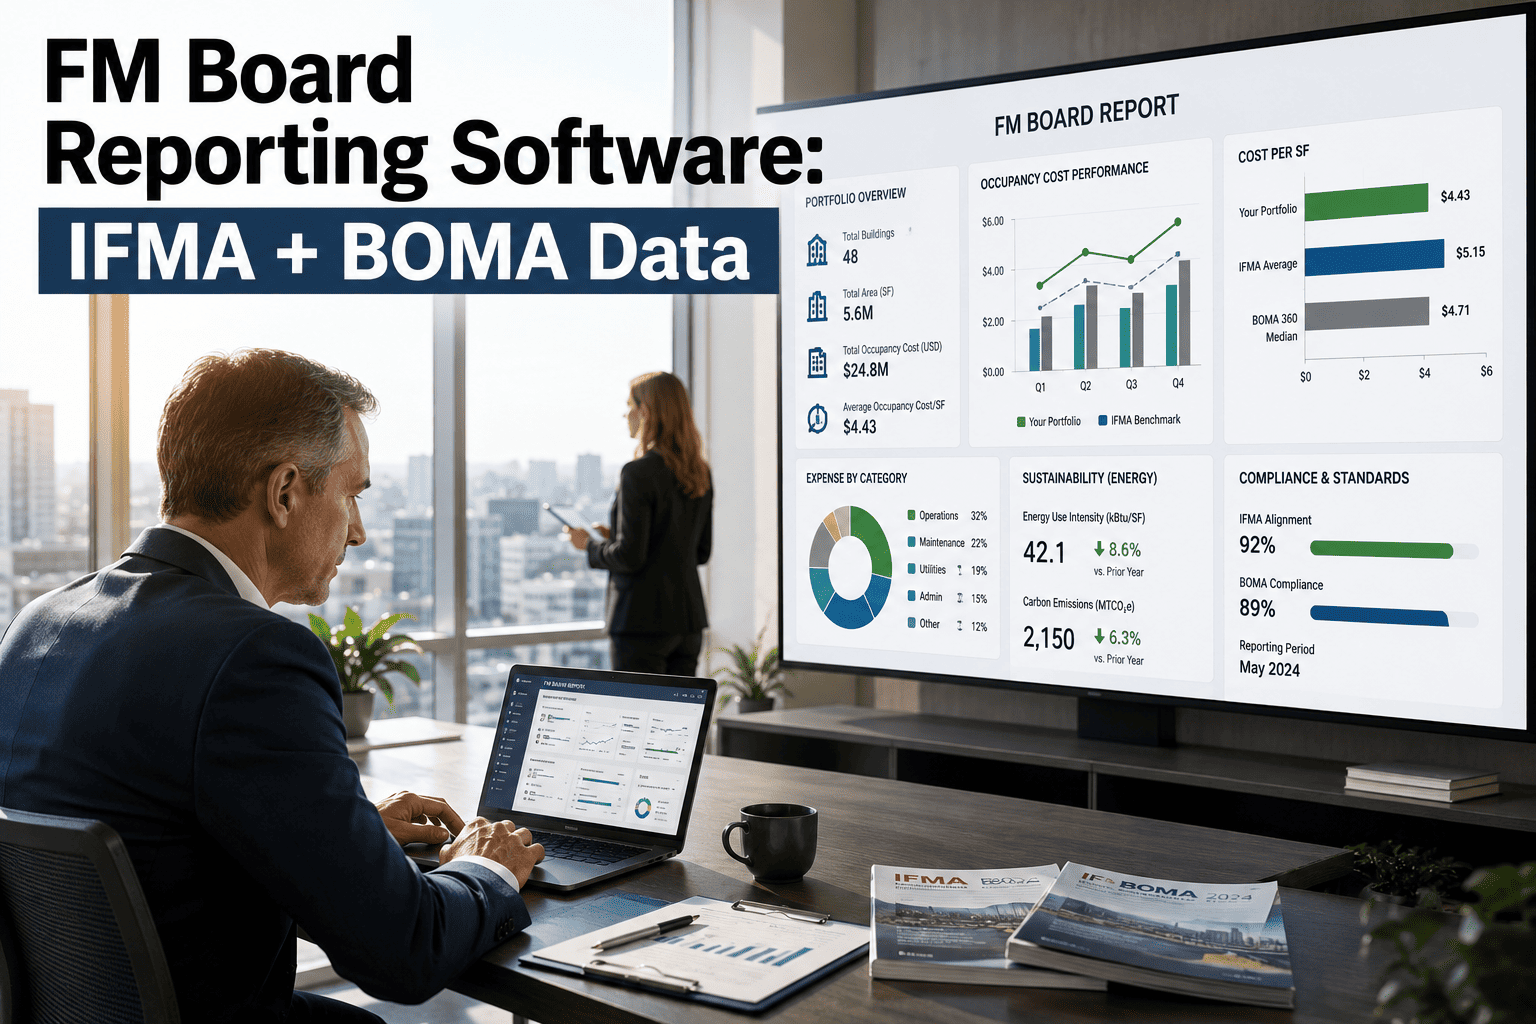
FM board reporting software turns raw maintenance data into the IFMA- and BOMA-recognized metrics that board members actually understand — uptime percentages, cost per square foot, asset lifecycle forecasts, and compliance scores. In 2026, the best board reporting CMMS platforms automate this translation, pulling live work-order, asset, and cost data into executive-ready dashboards instead of forcing facility managers to spend 12–20 hours per quarter assembling PowerPoint decks from spreadsheets. OxMaint is a purpose-built AI-powered CMMS and EAM platform that generates board-ready facility reports directly from your maintenance operations — no manual exports, no stale data, no guesswork. Whether you manage a single commercial building or a 40-site portfolio, the right facility board reporting platform pays for itself the first time a budget request is approved because the data was undeniable. Start Free Trial and see your first board report in under a week.
What If Your Next Board Meeting Ran on Live Maintenance Data — Not Last Quarter's Spreadsheet?
Facility managers who present IFMA- and BOMA-benchmarked metrics win budget approvals 2–3x more often than those who show up with anecdotal summaries. The top board reporting CMMS platforms in 2026 automate the entire pipeline — from work order completion to boardroom-ready KPI dashboards.
Which IFMA and BOMA Metrics Should Your FM Board Report Include?
Board members don't think in work orders — they think in cost per square foot, uptime, and capital risk. The best board reporting platforms in 2026 translate maintenance operations into these five universally recognized facility metrics.
Cost per Square Foot
BOMA's Experience Exchange Report benchmarks O&M spending at $8–$14/SF for commercial office and $4–$8/SF for industrial. Your board report should show your actual cost/SF against the relevant BOMA tier — a 15% variance in either direction demands explanation and action.
Planned vs. Reactive Maintenance Ratio
IFMA research shows best-in-class facilities run 70–85% planned maintenance. If your ratio is below 50%, you're overspending on emergency repairs by 3–5x per event. Boards understand this ratio instantly — it maps directly to budget predictability.
Asset Uptime & Availability
Target 97–99.5% availability for critical building systems (HVAC, elevators, fire suppression). Every 1% drop in uptime for a 200,000 SF commercial building translates to roughly $18K–$35K in lost tenant productivity and penalty exposure annually.
PM Compliance Rate
The percentage of preventive maintenance tasks completed on schedule. Below 90% PM compliance, equipment failure rates climb 20–40%. This is the single leading indicator boards should track quarter-over-quarter.
Capital Replacement Forecast
ISO 55000-aligned asset lifecycle projections showing which systems hit end-of-life in the next 1/3/5 years, with estimated replacement costs. Boards use this to approve capital reserves — without it, every major failure looks like a surprise.
Energy & Sustainability Score
ENERGY STAR scores, kWh/SF, and carbon intensity are now standard board agenda items. Buildings scoring below 50 on ENERGY STAR typically have 25–35% energy waste recoverable through maintenance optimization alone.
How Much Time Does Manual Board Reporting Actually Cost?
A facility manager overseeing a 300-asset portfolio typically spends 12–20 hours per quarter pulling data from spreadsheets, email threads, and paper logs to build a board presentation. That's 48–80 hours per year — the equivalent of 1–2 full work weeks — spent on reporting instead of maintenance.
Add the cost of decisions made on stale or incomplete data — deferred maintenance that compounds at 7–15% per year, emergency repairs at 3–5x planned cost — and the true cost of manual reporting exceeds $25K–$60K annually for a mid-size facility.
A 180-asset commercial property spending $42K/yr on maintenance was presenting quarterly board reports assembled from three spreadsheets and a shared drive. After switching to an automated FM board reporting CMMS, the facility manager cut report prep from 14 hours to 20 minutes. More importantly, the live PM compliance dashboard revealed a 62% compliance rate that nobody had tracked — within six months of targeted PM scheduling, compliance hit 94% and unplanned downtime dropped 38%. The board approved a $120K capital request on the first ask because every number was sourced, current, and benchmarked against BOMA data.
Best Board Reporting CMMS Features to Evaluate in 2026
Not every CMMS can produce a board-ready report. When evaluating the top board reporting platforms for facility management, these six capabilities separate genuine executive reporting tools from basic work-order trackers.
| Capability | Why Boards Care | What to Look For |
|---|---|---|
| Automated KPI Dashboards | Eliminates 12–20 hrs/quarter of manual data assembly | Real-time widgets for cost/SF, uptime, PM compliance, and work-order backlog — exportable to PDF/PPT in one click |
| IFMA / BOMA Benchmarking | Boards trust numbers they can compare against industry standards | Built-in benchmark ranges by building type, size, and region — not just raw internal data |
| Asset Lifecycle Forecasting | Enables proactive capital planning instead of emergency requests | ISO 55000-aligned remaining-useful-life models with replacement cost projections at 1/3/5-year horizons |
| Multi-Site Rollup Reporting | Portfolio-level boards need consolidated views, not 40 separate reports | Drill-down from portfolio → region → site → asset with consistent KPI definitions across all levels |
| Audit & Compliance Trail | Regulatory and insurance audits demand documented maintenance history | Timestamped, tamper-proof logs for every inspection, PM task, and corrective action — exportable on demand |
| Mobile Data Capture | Report accuracy depends on field data quality | Technician mobile app with photo capture, barcode/QR scanning, and offline mode so data enters the system at the point of work |
How OxMaint Turns Maintenance Data Into Board-Ready Reports
OxMaint is an AI-powered CMMS + EAM platform built for facility and maintenance teams who need to prove performance — not just track tasks. Here's how it maps directly to the board reporting challenge.
One-Click Executive Dashboards
OxMaint aggregates work orders, PM schedules, asset health, and costs into live dashboards. Export board-ready PDF reports in under 60 seconds — eliminating the 12–20 hours per quarter most FMs spend on manual assembly. Cost/SF, uptime, PM compliance, and backlog are always current.
Predictive Asset Lifecycle Models
AI-driven remaining-useful-life estimates aligned to ISO 55000 give your board a 1/3/5-year capital replacement forecast. Teams using OxMaint's predictive maintenance report 30–50% fewer unplanned failures and capital requests that get approved because the data is undeniable.
Automated PM Compliance Tracking
Every preventive maintenance task is scheduled, assigned, and tracked automatically. OxMaint flags compliance drops below your threshold before they become board-level problems. Facilities using automated PM scheduling achieve 90–97% compliance rates vs. 55–70% with manual systems.
Multi-Site Portfolio Rollup
Manage one building or fifty — OxMaint consolidates KPIs across your entire portfolio into a single board view with drill-down to any site, system, or asset. Consistent metric definitions mean your board compares apples to apples across every property.
See What Your Board Report Looks Like on Live Data
Book a 30-minute demo and we'll build a sample board report from your actual facility metrics — cost/SF, uptime, PM compliance, and capital forecast included.
How to Build a Board Presentation That Gets Budgets Approved
The difference between a deferred request and an approved one usually comes down to three things: benchmarked data, a clear trend line, and a specific dollar ask tied to a measurable outcome. Here's the framework top facility board reporting CMMS users follow.
Open With the Benchmark Gap
Start with your cost/SF against the BOMA benchmark for your building class. If you're at $11.20/SF and the BOMA median is $9.40/SF, that $1.80 gap across 150,000 SF is a $270K/yr story the board immediately understands. OxMaint calculates this automatically from your live cost data.
Show the Trend, Not Just the Snapshot
A single quarter's PM compliance rate means little. Four quarters trending from 62% → 78% → 85% → 93% tells a story of improving operational control. Boards fund trajectories, not data points. Your facility board reporting platform should generate these trend lines without manual chart-building.
Quantify the Risk of Inaction
Deferred maintenance compounds at 7–15% annually. A $45K chiller repair deferred today becomes a $52K–$60K emergency replacement in 18 months — plus tenant disruption costs. Show the board the compounding curve for your top 5 at-risk assets.
Close With a Specific Ask and Payback
"We need $85K to replace two aging rooftop units" is a request. "We need $85K to replace two rooftop units that are 3 years past expected life, currently running at 71% efficiency, costing $14K/yr in excess energy — payback in 2.8 years" is an investment thesis. The best board reporting CMMS platforms generate this ROI math automatically.
5 Board Reporting Mistakes That Kill Facility Budget Requests
Presenting raw work-order counts without context. "We completed 1,247 work orders last quarter" means nothing to a board. They need to know: did uptime improve? Did cost/SF decrease? Is the backlog shrinking?
Translate every operational metric into a financial or risk outcome. 1,247 completed work orders → 96.2% PM compliance → 34% reduction in unplanned downtime → $28K avoided in emergency repair premiums.
Using data that's 30–90 days old. By the time a board sees last quarter's manually assembled spreadsheet, the situation on the ground has changed. Boards lose trust in stale numbers.
Use a CMMS with real-time dashboards so every number in your board report reflects data as of this week, not last quarter. OxMaint's live dashboards update the moment a technician closes a work order.
Requesting capital without a lifecycle forecast. Asking for $200K to replace a chiller without showing the board your 5-year asset replacement plan makes every request feel reactive and unplanned.
Present an ISO 55000-aligned capital forecast showing all major systems ranked by remaining useful life. When the board sees the full pipeline, individual requests become line items in a plan — not surprises.
FM Board Reporting Software: Your Questions Answered
What is FM board reporting software?
FM board reporting software is a CMMS or EAM platform that automatically converts maintenance and facility operations data into executive-ready reports and dashboards. It tracks KPIs like cost per square foot, asset uptime, PM compliance, and capital forecasts — benchmarked against IFMA and BOMA standards — so facility managers can present credible, data-driven reports to boards and ownership groups without manual spreadsheet assembly.
How much does board reporting CMMS software cost in 2026?
Most cloud-based board reporting CMMS platforms range from $28–$85 per user per month, depending on portfolio size and feature depth. Enterprise EAM platforms with advanced analytics can run $100–$200/user/month. OxMaint offers competitive pricing with a free 14-day trial — start your free trial to evaluate board reporting features on your own data before committing.
What metrics should a facility board report include?
At minimum: cost per square foot (benchmarked to BOMA), planned vs. reactive maintenance ratio (target 70%+ planned), PM compliance rate (target 90%+), critical asset uptime (target 97–99.5%), and a 1/3/5-year capital replacement forecast. Energy metrics like ENERGY STAR score and kWh/SF are increasingly expected. The best board reporting platforms generate all of these automatically from live maintenance data.
Can a CMMS replace manual board presentations?
Yes — a modern CMMS with executive reporting eliminates 80–95% of manual board report preparation. Instead of spending 12–20 hours per quarter pulling data from spreadsheets, the facility manager reviews a live dashboard, adds commentary, and exports a formatted report. The board gets current data instead of 30–90-day-old snapshots. Book a demo to see how OxMaint generates a board-ready report in under 60 seconds.
How do IFMA and BOMA benchmarks improve board reporting?
IFMA and BOMA benchmarks give board members an external reference point they already trust. When your report shows $10.80/SF against a BOMA median of $9.40/SF, the board immediately understands the gap and the opportunity. Without benchmarks, internal metrics exist in a vacuum — boards can't tell if 92% PM compliance is good or bad. Benchmarked data transforms your report from a status update into a decision-making tool.
Your Next Board Meeting Could Run on Live Data
OxMaint turns your maintenance operations into board-ready reports — IFMA and BOMA benchmarked, always current, always credible. See it on your assets in a 30-minute demo.
Free 14-day trial · No credit card required · Set up in under a week