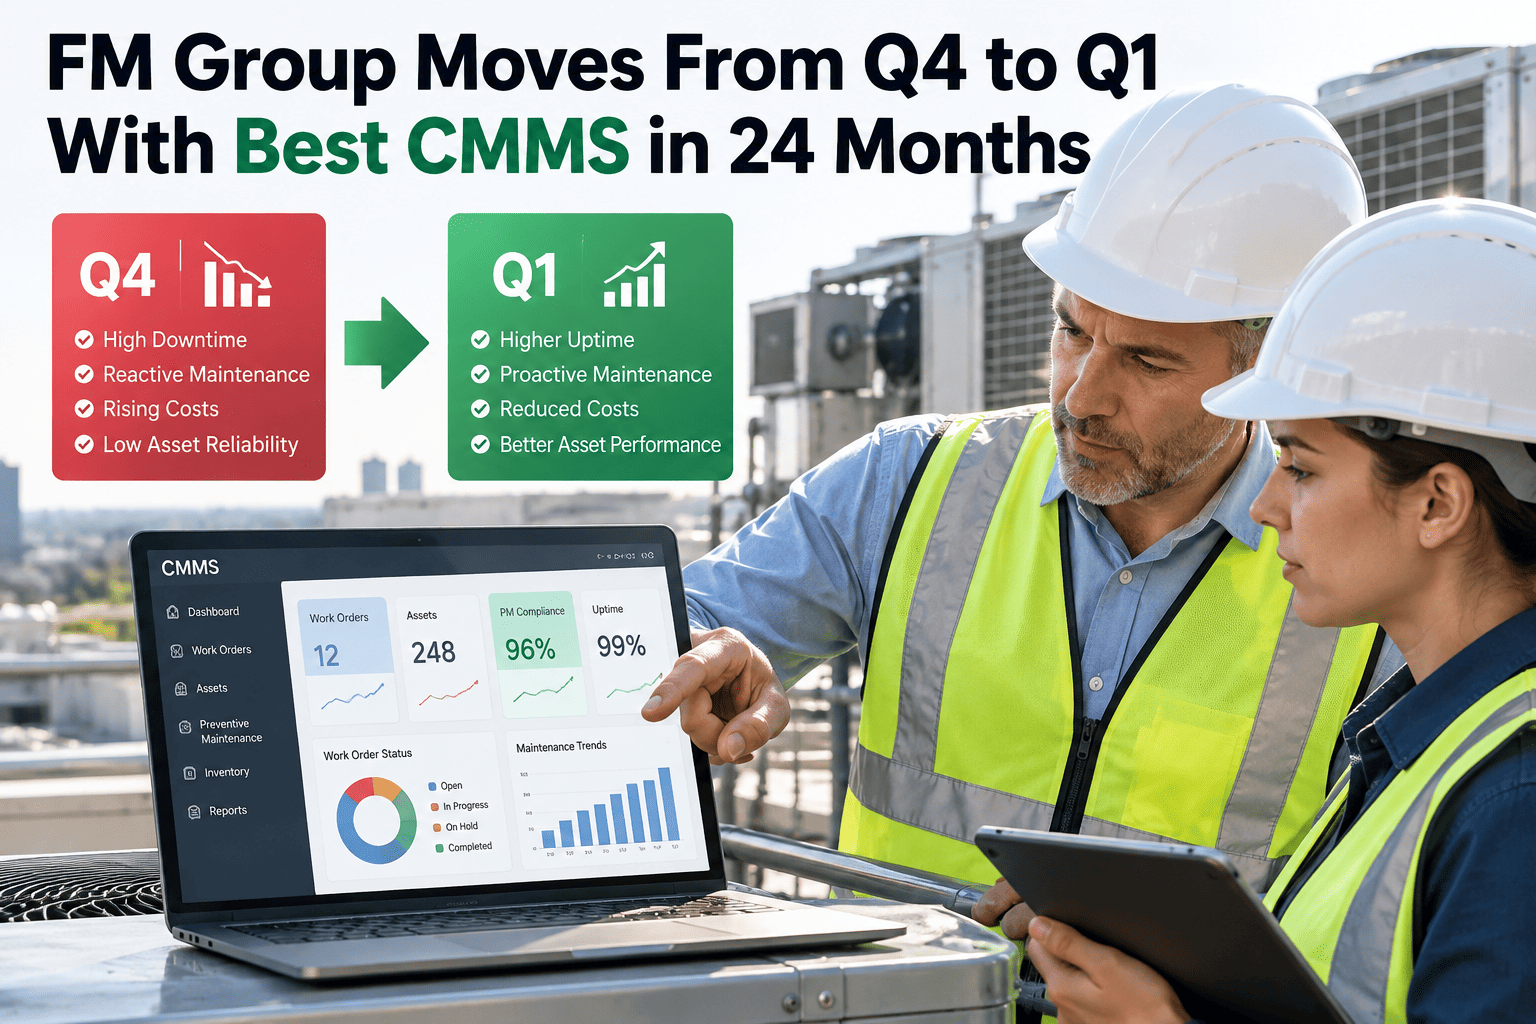
Quartile benchmarking is how larger facility portfolios talk about performance — where your cost, reliability, and compliance metrics sit relative to peer buildings of similar size and type. Moving from the bottom quartile to the top isn't a single fix; it's a sequence of data, process, and workflow changes over roughly one to two years. The scenario below walks through what that sequence typically looks like for a multi-site FM group, and where a CMMS fits into each phase.
What does it actually take to move a facilities portfolio from bottom quartile to top?
A composite, illustrative walkthrough of the phases a multi-site FM group typically works through over roughly 24 months to shift its benchmark position — built from patterns common across portfolio rollouts, not a single named audit.
This walkthrough is an illustrative, composite scenario reflecting common patterns seen across multi-site facility rollouts — it is not a specific named customer, and the figures shown are representative ranges, not audited results from one portfolio. Use it as a planning reference for what a quartile-improvement program typically involves, not as a guarantee of outcomes.
What "bottom quartile" usually looks like on the ground
Before any rollout begins, most FM groups in the lower quartile share a recognizable set of symptoms — not one root cause, but several compounding at once.
- SymptomReactive work orders significantly outnumber planned ones, with technicians spending most of the week responding rather than preventing.
- SymptomEach site runs its own spreadsheet or paper log, so portfolio-level reporting is assembled manually, quarter by quarter, and inconsistently.
- SymptomAsset data is incomplete — install dates, warranty status, and service history are missing for a meaningful share of critical equipment.
- SymptomCapital requests are submitted late, without cost-per-failure history to back them, and are frequently deferred by finance.
A typical 24-month path across a multi-site portfolio
Portfolio-wide change happens in stages — trying to fix reliability, reporting, and capital planning all at once tends to stall. This is the sequence that most consistently holds.
Standardize the asset register and CMMS across sites
Every site migrates onto one platform with a shared asset hierarchy, so portfolio reporting stops being a manual roll-up exercise.
Build preventive maintenance schedules by asset class
PM plans are rolled out site by site, starting with life-safety and highest-criticality equipment, shifting technician time away from firefighting.
Mobile work order adoption on the floor
Technicians move off paper logs onto mobile work orders, closing the gap between when work happens and when it's recorded — the data quality that everything downstream depends on.
Reliability and cost dashboards go live portfolio-wide
With clean, consistent data flowing in, site and portfolio dashboards surface reactive-versus-planned ratios, downtime, and cost per asset class for the first time.
Capital planning and benchmark review
A ranked capital request, backed by cost and failure history, goes to finance alongside a full quartile re-benchmark against the portfolio's original baseline.
See what a phased rollout looks like for your own portfolio
Walk through the same asset standardization, PM build-out, and dashboard sequence — mapped to your sites, not a hypothetical one.
What typically changes across a 24-month program
These are directional shifts commonly reported by facility teams during a portfolio-wide CMMS rollout — treat them as the shape of the change, not a fixed formula.
| Dimension | Typical starting position | Typical position after rollout |
|---|---|---|
| Work order mix | Reactive work dominates the technician schedule | Planned preventive work becomes the majority |
| Portfolio reporting | Manually assembled from per-site spreadsheets | Live dashboard, consistent across every site |
| Asset data completeness | Install dates and service history missing for many assets | Standardized asset register with verified records |
| Capital request quality | Anecdotal, submitted late, often deferred | Ranked, cost-backed, submitted on a fixed annual cycle |
| Benchmark trajectory | Bottom-quartile positioning against peer portfolios | Measurable, sustained movement toward top-quartile positioning |
Four factors that most often determine whether a rollout sticks
Sequencing, not simultaneity
Programs that standardize data before adding dashboards or automation tend to hold; programs that try everything in month one tend to stall.
Technician adoption on mobile
Dashboards are only as good as the work-order data feeding them — mobile adoption on the floor is usually the real bottleneck, not the software.
A fixed capital review cadence
Annual capital submissions built on live cost and failure data replace one-off, reactive requests that finance has learned to discount.
One shared platform across sites
Portfolio comparison is only possible once every site is entering data into the same system, with the same asset hierarchy and field definitions.
Portfolio quartile improvement — common questions
How long does a multi-site quartile improvement program usually take?
Most portfolios plan for 18 to 24 months from initial rollout to a measurable, sustained benchmark shift — shorter timelines are possible for smaller portfolios with fewer sites.
What's the first phase that actually moves the needle?
Standardizing the asset register and getting every site onto one CMMS, since portfolio-level comparison is impossible until the underlying data is consistent.
Do all sites need to roll out at the same time?
No — most portfolios stagger rollout by site, starting with the highest-criticality or lowest-performing locations first, then extending the same workflow outward.
What usually causes a rollout to stall?
Weak technician adoption of mobile work orders is the most common cause — without consistent floor-level data entry, dashboards and benchmarks have nothing reliable to draw from.
How is benchmark position actually measured?
Typically against peer portfolios of similar building type and size, using metrics like reactive-versus-planned ratio, cost per square foot, and downtime. Book a Demo to see how your own portfolio metrics could be tracked.
Plan the path from your portfolio's current position to its next benchmark tier
Bring your site list and current pain points — we'll walk through what a phased rollout would look like for your specific portfolio.
Free 14-day trial · No credit card