When a facility director stands in front of the capital committee and says a chiller "needs to be replaced soon," the answer is almost always no. When that same director opens a report showing three years of work order costs, a rising failure trend, and a Facility Condition Index crossing the threshold IFMA defines as urgent, the answer is almost always yes. The difference between those two meetings has nothing to do with the equipment itself and everything to do with the data sitting behind the request. Most facility budget fights are lost before anyone even speaks, because the case was built on memory, instinct, and a gut feeling instead of structured maintenance history that any reviewer could verify in seconds. See how OxMaint turns your everyday work order data into that case before your next budget cycle opens.
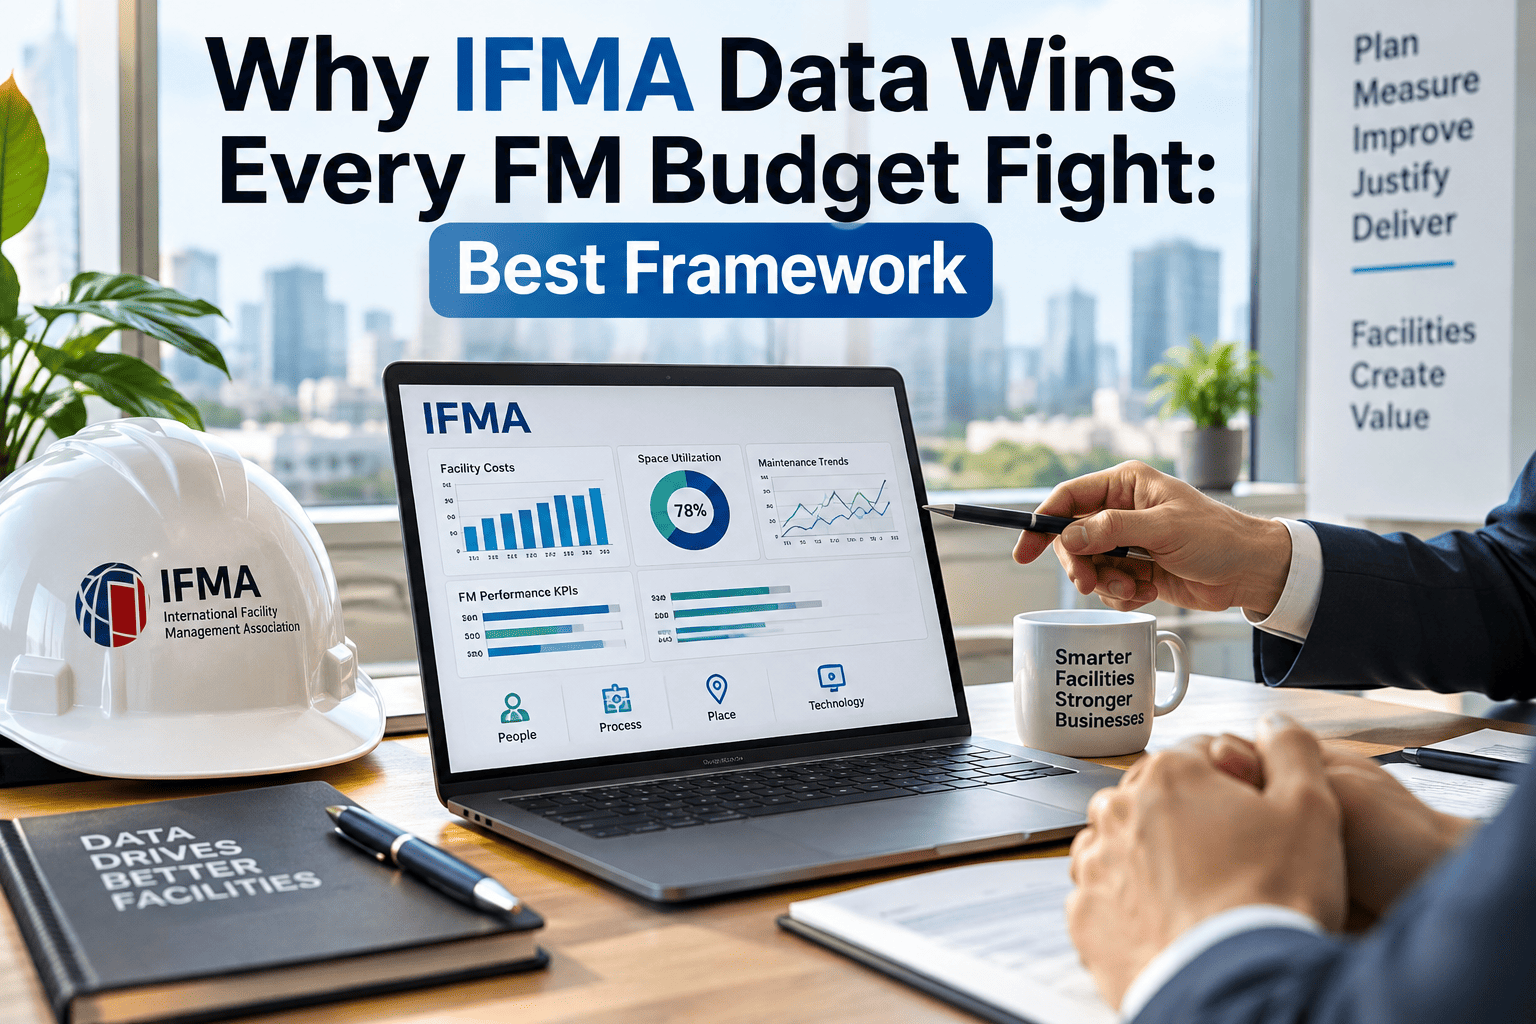
Why IFMA Data Wins Every FM Budget Fight
Facility directors who walk into budget season with Facility Condition Index scores, verified cost trends, and IFMA-aligned benchmarks stop asking for money and start presenting evidence. This is the framework top-performing teams use to get capital approved on the first pass.
Why Most Facility Budget Requests Get Denied
Finance committees do not reject capital requests because the equipment isn't actually failing. They reject them because the request reads as an opinion instead of a case. "This unit is old and needs attention" gives a CFO nothing to underwrite, no number to model, and no risk figure to weigh against the spend. A council or board that would never approve a maintenance line item on a hunch will often approve the exact same spend the moment it is expressed in cost trends, condition scores, and a documented failure history. The gap between those two outcomes is entirely about how the data was assembled and presented, not about whether the underlying need was real. Facility teams that keep losing these fights are almost always sitting on the evidence already; it is simply scattered across paper work orders, personal notebooks, and a technician's memory instead of a single report a reviewer can open in thirty seconds.
The IFMA Framework That Changes the Conversation
The International Facility Management Association has spent decades formalizing how condition data should be captured and reported, and its methodology is now the backbone of most defensible capital requests across commercial, institutional, and public-sector portfolios. A Facility Condition Assessment, recommended every three to five years as baseline practice, produces the Facility Condition Index used to translate a building's physical state into a single comparable number that any reviewer can understand without a background in engineering. That number is what turns "we think this needs replacing" into "our FCI has crossed the threshold for urgent intervention," a sentence that finance committees are trained to act on because it maps to a recognized standard rather than one department's internal opinion. Multi-year capital planning built on this foundation typically spans a 20-year horizon, giving leadership a rolling view of what is coming rather than a single-year surprise.
Total Cost of Ownership: The Number CFOs Actually Want
A replacement cost by itself tells a CFO almost nothing, because it only describes the outflow, not the return. What actually moves an approval is total cost of ownership: current annual maintenance spend on the aging asset, the cost trajectory if the spend continues to climb, the replacement cost, the operating expense reduction that follows a new install, and the resulting payback period. When that full picture is assembled from real work order history rather than estimated, a request stops sounding like a wish list item and starts sounding like an investment with a defined return. This is the exact translation step most facility teams skip, and it is the single biggest reason a technically correct request still gets tabled for another year. A ten-year net financial impact figure, laid alongside the payback period, gives a reviewer everything needed to compare this request against every other line item competing for the same limited pool of capital, which is ultimately what every budget meeting comes down to.
What the Data Actually Shows: Reactive vs IFMA-Aligned Operations
The financial gap between a facility team that runs on spreadsheets and one that runs on structured, IFMA-aligned data is not small, and it shows up in every line of an operating budget, from emergency freight charges to the number of afterhours callouts a crew fields in a given quarter. The table below lines up the two operating postures side by side using industry benchmark figures drawn from published facility management research, and it is the kind of comparison that makes a compelling first slide in any capital committee meeting because it requires no interpretation from the reviewer at all.
| Metric | Reactive-Heavy Operation | IFMA-Aligned Operation |
|---|---|---|
| Planned-to-reactive work ratio | Below 50:50 | Above 80:20 |
| Emergency work order ratio | Industry average, well above top quartile | 16% or below, top-quartile performance |
| Facility Condition Index tracking | Not measured or updated only during a crisis | Reassessed on a 3-5 year FCA cycle per IFMA guidance |
| Capital request basis | Qualitative claim, approved on trust alone | TCO, deferral cost, and payback period evidence |
| Annual deferred-cost escalation | Absorbed silently, rarely quantified | Tracked and presented at roughly 17% per year |
The Cost of Waiting: Why Deferral Is the Most Expensive Decision
Every facility director has watched a modest repair balloon into a five-figure emergency because approval was delayed one budget cycle too many. The pattern is consistent enough that it can be charted: a problem caught and corrected at the point of inspection costs a fraction of the same problem addressed after it cascades into downtime, rush parts, and after-hours labor. Deferred capital maintenance escalates at roughly 17% a year while the failure risk climbs in parallel, which means the "cheaper" choice on paper is almost never the cheaper choice in practice. Facility teams that present this trajectory visually, rather than as a single number buried in a spreadsheet cell, consistently see faster sign-off, because a reviewer can see exactly where the curve bends from manageable to expensive.
Building a CFO-Ready Capital Case: The Four-Step Framework
Finance leaders approve requests that reduce risk or generate a return that outpaces the cost of doing nothing. They rarely approve requests framed around comfort, convenience, or "it just feels old." The following sequence is how facility teams with the strongest approval rates structure every capital ask, and it maps directly onto the reports a well-configured CMMS can generate in minutes rather than weeks, which means the framework below is not just a best practice, it is something a facility director can actually execute before the next scheduled budget review.
Real Numbers Change Real Outcomes
None of these numbers require a bigger team or a bigger budget to produce. They require a system that captures labor, parts, downtime, and condition data at the point of work, instead of asking someone to reconstruct it from memory two weeks before the budget meeting. That is the entire premise behind a modern CMMS, and it is why facility teams that adopt one see their capital approval rate change inside a single cycle rather than over several years. The data was always sitting inside the daily work order log; the only thing missing was a system that could pull it together into the format a finance committee actually reads and trusts.