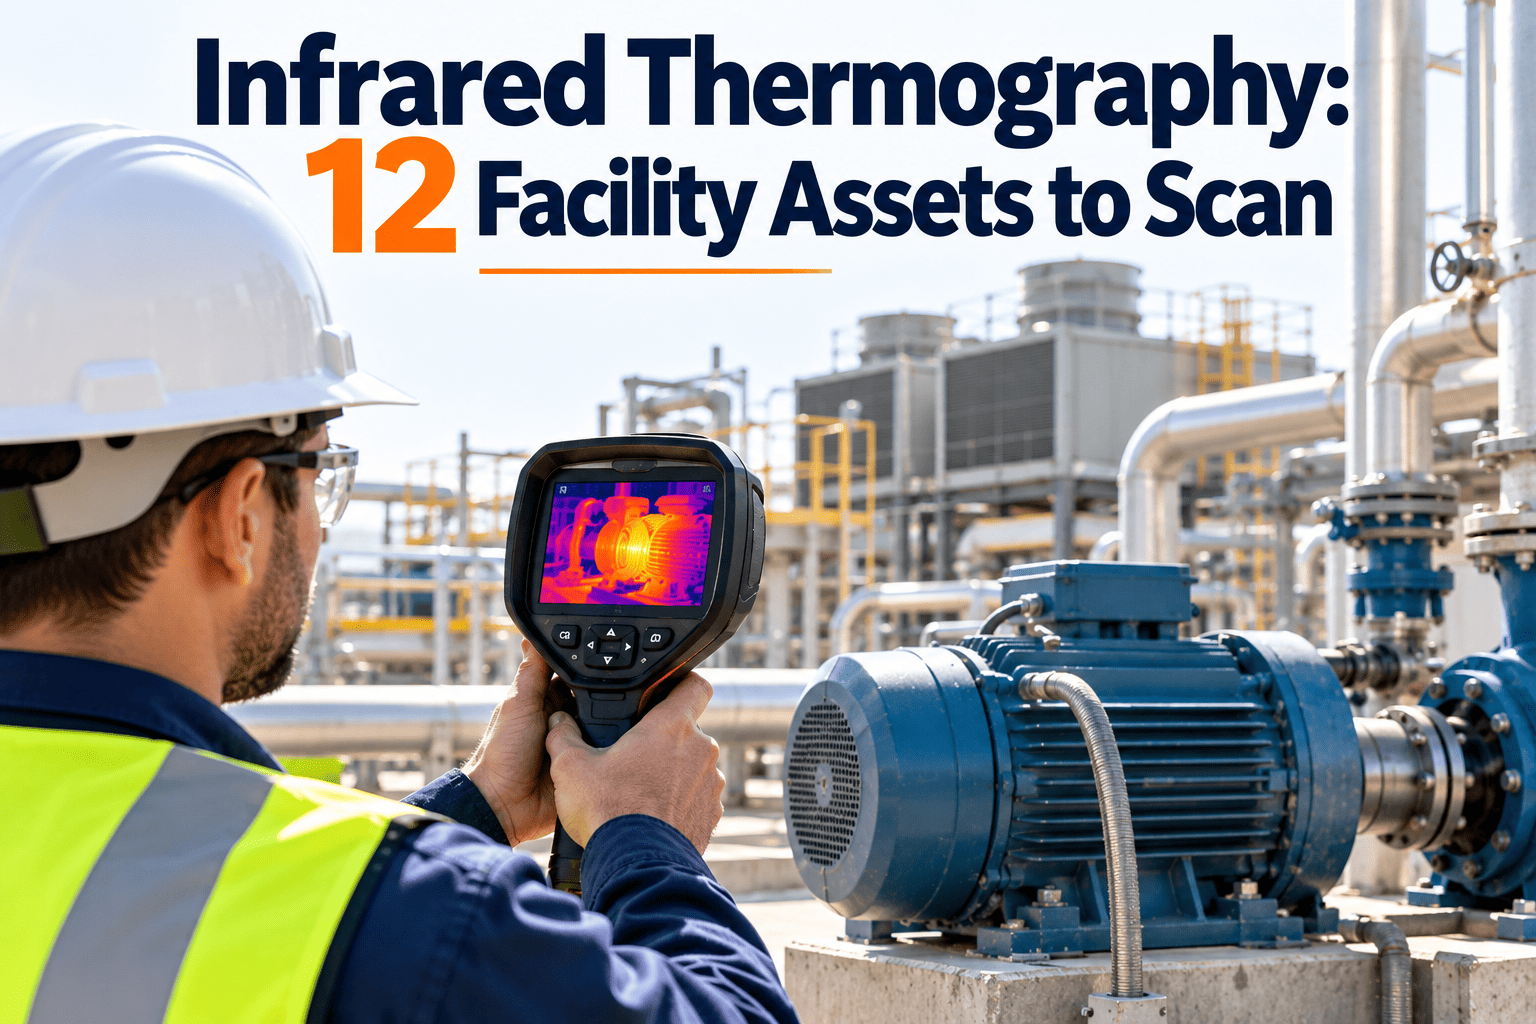
A loose breaker lug runs hot for weeks before it trips a panel and drops a wing of the building. A rooftop unit compressor draws slightly more current every month until it seizes in August. None of this shows up on a routine walkthrough, because heat hides inside enclosures, behind insulation, and under roofing membranes where nobody is looking. Infrared thermography turns that invisible heat signature into a picture a technician can act on, and pairing the scan with a work order system built for follow-up is what actually prevents the failure instead of just documenting it after the fact.
Infrared thermography for facilities: the 12 assets worth scanning
A thermal camera finds resistance, friction, and moisture problems long before they show up as a work order. This guide covers the electrical, mechanical, and envelope assets an FM team should put on a recurring IR route, and how to turn findings into closed work rather than a PDF report that sits untouched in a shared folder.
The failures thermography catches before they become tickets
Electrical connections loosen from thermal cycling and vibration over months and years of normal operation. Bearings run dry before they seize. Roof membranes trap moisture long before a ceiling tile stains or a leak becomes visible. Each of these problems generates measurable heat well ahead of the point where a maintenance tech would notice anything by eye or ear during a routine walkthrough.
Electrical connections drift silently
A breaker lug torqued correctly at installation loosens over years of load cycling. Resistance rises, heat rises with it, and nothing looks different from outside the panel door until insulation fails.
Mechanical wear hides inside housings
A bearing running dry or misaligned generates friction heat well before the sound or vibration is obvious to a technician walking the floor without instrumentation.
Envelope failures are invisible from inside
Wet insulation and missing thermal breaks change the surface temperature of a wall or roof long before a leak or a comfort complaint reaches the help desk.
12 facility assets worth a recurring IR route
Not every asset needs a thermal scan every quarter. Group your route by category and frequency so the program stays sustainable over years, instead of becoming a one-time audit that never repeats after the first budget cycle.
Electrical distribution
Main switchgear and distribution panels
Bus connections, lugs, and breaker terminations are the single highest-consequence scan on the list — a hot bus bar can lead to arc flash events, not just downtime.
Branch circuit panelboards
Overloaded neutral connections and daisy-chained circuits show up clearly under load. Scan under near-peak demand, not right after a panel has been idle.
Transformers and disconnects
Winding and bushing temperature deltas flag insulation degradation and loose taps long before a transformer trips offline unexpectedly.
Motor control centers
Contactors, overload relays, and starter connections run hot under repeated cycling, especially on equipment that starts and stops frequently through the day.
Mechanical and HVAC
Rooftop unit and chiller compressors
Discharge line and compressor housing temperatures reveal refrigerant charge problems and mechanical wear ahead of a mid-summer failure.
Motor and pump bearings
A bearing running a few degrees above its neighbors on the same shaft line is an early lubrication or alignment flag, ideally paired with a vibration reading.
Belt drives and couplings
Slipping belts and misaligned couplings generate friction heat that a thermal image catches well before a belt visibly glazes or snaps.
Steam traps and heat exchangers
A failed steam trap shows a distinct thermal signature downstream, and a fouled heat exchanger shows an uneven surface gradient across its face.
Building envelope and life safety
Roof membrane and insulation
Trapped moisture changes the thermal mass of a roof section, showing up as a warm patch at dusk after the sun-driven heat begins to release.
Exterior wall assemblies and windows
Missing insulation, thermal bridging at studs, and failed window seals are far easier to prove with a thermal image than a written description.
Fire pump and emergency generator connections
Life-safety equipment sits idle most of the time, which makes loose terminations easy to miss without an IR scan during monthly test runs.
Server room and data closet power
UPS terminations, PDU breakers, and busway plugs carry continuous load, so even a small resistance increase generates a measurable and risky heat rise.
Building the scan capability versus contracting it out
Most facility teams start an IR program by hiring a contracted thermographer for an annual electrical survey. That gets the first scan done, but it rarely turns into a repeating program on its own — the report arrives, gets filed, and the next scan happens only when someone remembers to schedule it again.
- Lower upfront cost since there is no camera purchase or certification training
- Consistent methodology from a certified thermographer, useful for insurance documentation
- Findings often arrive as a static PDF disconnected from the CMMS asset record
- Coverage limited to electrical gear, since envelope and mechanical scans are usually a separate line item
- A trained facilities technician can run a monthly route on the highest-risk panels between annual contracted surveys
- Findings log straight into the work order system with photos, closing the loop the same day
- Camera cost is recovered quickly on a portfolio of more than a handful of buildings
- Electrical scans on energized gear still require proper PPE and training regardless of who holds the camera
Many facility teams land on a hybrid model: a certified contractor performs the annual arc-flash-rated electrical survey for insurance and compliance purposes, while an in-house handheld camera covers mechanical rooms, rooftop units, and quick verification scans between visits.
Where IR programs quietly stop working
A thermography program rarely fails on day one. It fails eight months in, when the second scan gets skipped and nobody notices until the next failure.
Scanning cold equipment. A panel or motor scanned right after startup, or during a low-demand period, will not show the heat signature that only appears near typical operating load.
Treating the report as the deliverable. If the survey ends with a PDF emailed to a manager rather than work orders opened against each finding, most items never get resolved.
No baseline for comparison. Without a prior scan of the same asset, a technician cannot tell whether a hot spot is new, stable, or getting worse.
Skipping the repeat scan after a repair. Confirming a fix actually lowered the temperature is the only way to know the corrective work order solved the problem.
No emissivity or reflection correction. Shiny metal surfaces and reflective enclosures can produce misleading readings without proper camera settings, leading to false positives or missed findings.
Suggested scan frequency by category
Cadence should reflect consequence, not convenience. The categories above break down roughly into three frequency tiers once criticality and duty cycle are taken into account.
| Category | Typical Cadence | Reasoning |
|---|---|---|
| Main switchgear, fire pump, generator power | Annually, minimum | High consequence, continuous duty, often insurance-mandated |
| Branch panels, MCCs, UPS/PDU circuits | Annually to semi-annually | Moderate consequence, cycling load increases connection wear |
| Rooftop units, pumps, belt drives | Semi-annually, seasonal peaks | Mechanical wear accelerates under peak seasonal load |
| Roof membrane, envelope, low-priority assets | Annually or after major weather events | Slower-developing failure mode, weather-triggered inspection adds value |
Running an IR route that actually repeats
Most facilities run one thermography survey, generate a report, and never repeat it on schedule. A working program treats the scan as the trigger for a workflow, not the deliverable itself, which is the single biggest difference between a program that sticks and one that quietly fades after the first year.
Baseline under normal load
Scan electrical gear near typical operating load, not right after startup, so findings reflect real operating conditions rather than a cold system.
Classify by temperature rise
Compare the hot spot against a similar unloaded component or ambient reference, then bucket the finding by severity rather than raw temperature alone.
Open a linked work order immediately
A finding that sits in a report folder gets missed at the next PM cycle. A finding logged straight into the CMMS against the asset record does not.
Schedule the repeat scan
Set the next survey date at the same time the current one closes out, so the route becomes a standing preventive maintenance schedule rather than a one-off.
Trend the asset over time
A single scan tells you today's condition. Three scans on the same asset tell you whether the trend is stable, worsening, or resolved after repair.
Turning a temperature delta into a priority
Electrical thermography practice, reflected in guidance such as NETA and NFPA 70B, generally classifies findings by how far a component runs above a comparable reference point rather than by absolute temperature alone.
| Temperature Rise Above Reference | Likely Condition | Recommended Action |
|---|---|---|
| 1–3°C | Minor imbalance or early wear | Log and monitor at next scheduled scan |
| 4–15°C | Developing loose connection or bearing wear | Open a corrective work order for next planned outage |
| 16–40°C | Significant resistance or mechanical fault | Schedule repair within days, not the next PM cycle |
| 40°C+ | Severe fault with near-term failure risk | De-energize or isolate and repair immediately |
Stop letting thermal findings sit in a PDF
Turn every IR survey into a linked work order, a scheduled repeat scan, and an asset history you can actually trend over time.
Where Oxmaint fits into a thermography program
A thermal camera finds the problem. What happens in the twenty minutes after the scan determines whether the finding gets fixed, tracked, and trended, or forgotten in a shared folder no one revisits.
Findings become work orders on the spot
Log a thermal finding against the exact asset record from a phone or tablet in the field, with photos attached, instead of writing it up later from memory.
Recurring inspections stay on schedule
Build the IR route as a recurring preventive maintenance schedule by building, panel, or asset category, so surveys repeat without a manual reminder.
Asset history trends over time
Every scan attaches to the same asset record, so a technician reviewing a panel can see the full temperature trend, not just the latest reading.
Reporting shows program coverage
Dashboards show which buildings and asset categories are due, overdue, or current on their IR route, useful for both operations and insurance reporting.
From annual snapshot to continuous thermal monitoring
Handheld thermography gives a snapshot in time — accurate the day of the scan, and blind to anything that develops in the months between visits. A growing number of facilities are layering in fixed thermal sensors on their highest-consequence electrical gear to close that gap.
Fixed sensors on critical panels
Permanently mounted thermal sensors on main switchgear and data center power gear report continuously, catching a developing hot spot weeks before the next scheduled handheld survey would.
Handheld scans stay relevant everywhere else
Fixed monitoring is realistic for a short list of the highest-consequence assets — the broader mechanical and envelope scan list still relies on a periodic handheld route.
Alert thresholds need the same severity logic
A continuous sensor is only useful if its alert threshold reflects the same temperature-rise logic used in a manual survey, not an arbitrary fixed number that generates false alarms.
Both feed the same asset record
Whether a finding comes from a handheld camera or a fixed sensor, it should land in the same work order system and asset history so trending stays consistent across methods.
Infrared thermography for facilities — answered
How often should a facility run an IR electrical survey?
Annual electrical thermography is the common baseline referenced by NFPA 70B guidance for most commercial facilities, with critical panels such as switchgear and data center power scanned more frequently.
Do panels need to be under load for a useful scan?
Yes. Electrical thermography needs the circuit under at least 40 percent of typical load to reveal resistance-driven heating, which is why scans scheduled during low-occupancy periods often miss findings.
Can building envelope scans be done any time of year?
Envelope and moisture scans work best with a meaningful temperature differential between inside and outside, so early morning or shoulder-season scans typically show clearer results.
Who should perform the thermal survey?
A certified thermographer, trained to standards referenced by organizations such as InterNACHI or ASNT, is important for electrical work given the arc flash exposure involved in scanning energized panels.
How does a thermal finding get tracked after the survey?
The most reliable approach logs the finding directly against the asset record in a CMMS, with a linked work order and a scheduled repeat scan. Get Started to see it set up on your own asset list.
Put your thermography findings to work, not into a folder
Connect every IR scan to an asset record, a work order, and a repeat schedule your team will actually follow.
Free 14-day trial · No credit card



.jpeg)


