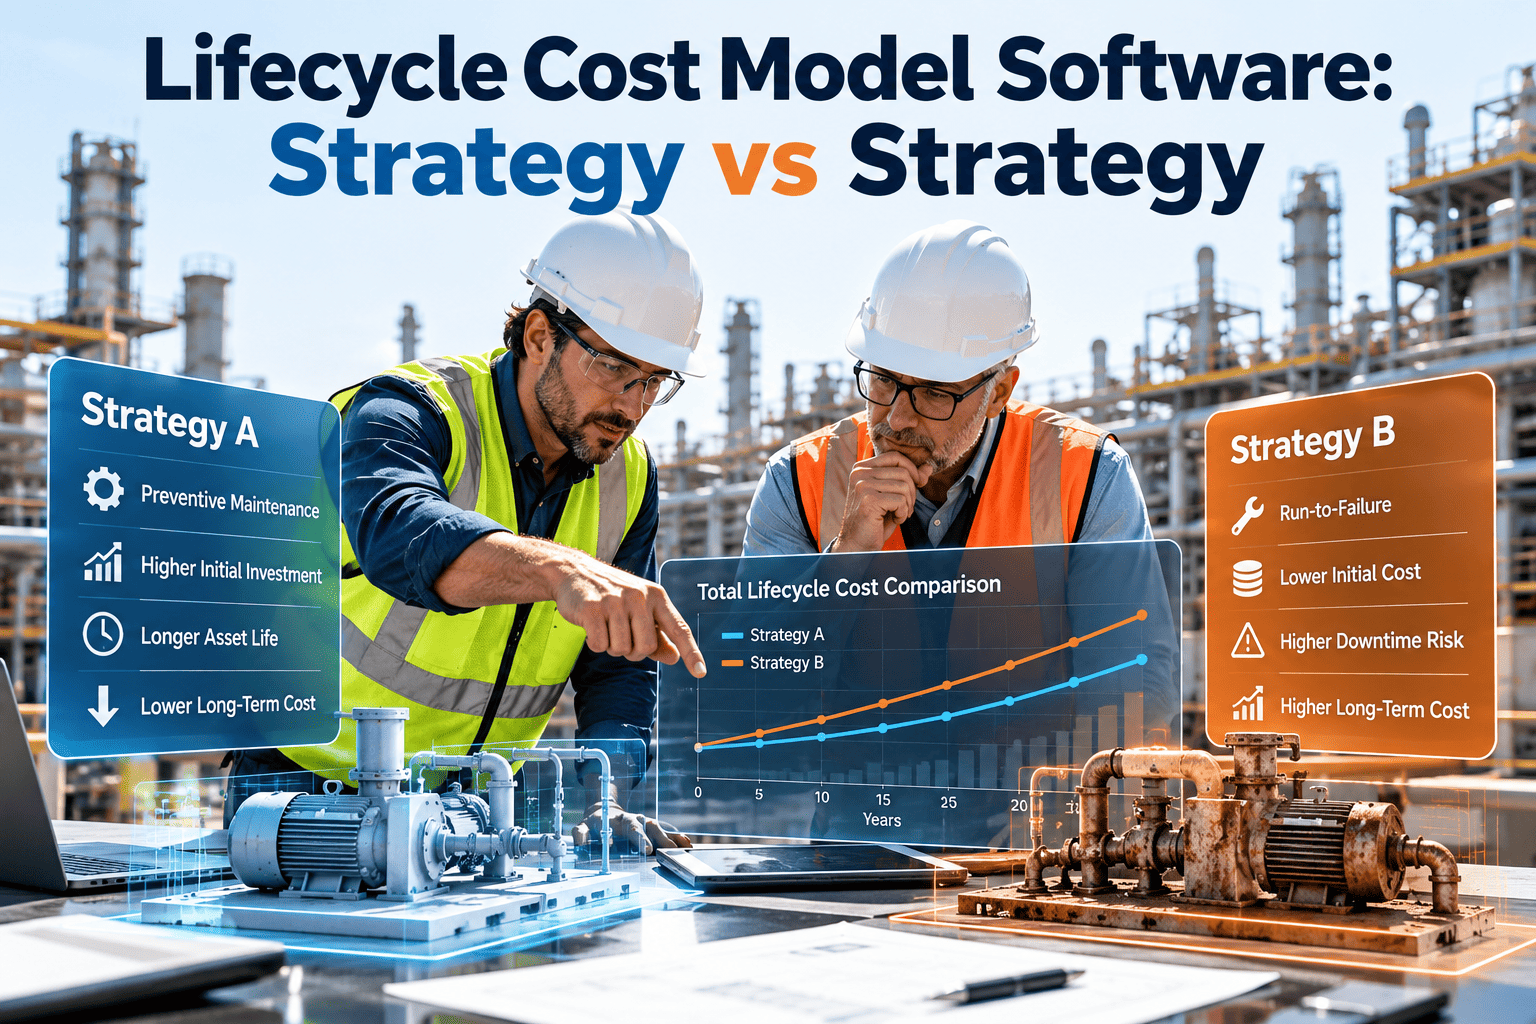
Most facilities choose a maintenance strategy by habit, budget cycle or the last big failure. A lifecycle cost model replaces that with arithmetic. It adds up acquisition, preventive work, repairs, downtime, energy and end-of-life cost for each strategy over the same horizon, then compares the totals. The result is only as good as the records behind it, which is where a facility CMMS earns its place. Teams that keep asset, work order and inspection history in Oxmaint maintenance management software have the cost data the model needs.
Lifecycle Cost Model Software: Strategy vs Strategy
Compare run-to-failure, preventive, condition-based and replacement strategies over a 15-year horizon, with the math visible
What a Lifecycle Cost Model Actually Measures
Lifecycle cost, sometimes called total cost of ownership, covers every cost an asset creates from purchase to disposal. The purchase price is often the smallest part of it.
Comparing strategies means holding everything else equal. Same asset, same service level, same horizon, same discount rate.
Strategy Comparison Without a Model and With One
Strategy chosen by habit
- PM intervals copied from the manufacturer for every asset
- Run-to-failure applied to anything cheap, without checking consequence
- Replacement decided after the second or third major repair
- Budget requests supported by anecdotes
- No view of cost by asset class over time
Strategy chosen by lifecycle cost
- Each asset class costed under two or more strategies
- Consequence of failure included in the comparison
- Repair-versus-replace threshold set from cost history
- Budget requests backed by transparent assumptions
- Annual review using actual work order cost
The Five Strategies Worth Comparing
Most facility assets fit one of these approaches. Many facilities use a mix, applying different strategies to different asset classes.
| Strategy | How it works | Cost profile | Suits | Risk |
|---|---|---|---|---|
| Run to failure | Repair or replace after it fails | Low planned cost, high unplanned cost | Low-consequence, cheap, redundant items | Unplanned downtime and safety exposure |
| Time-based preventive | Service at fixed calendar or usage intervals | Steady planned cost, fewer failures | Assets with known wear patterns | Over-maintenance or intervals that miss real failure modes |
| Condition-based | Act when inspection or sensor data shows deterioration | Monitoring cost, fewer unnecessary tasks | Critical assets with detectable degradation | Monitoring cost can exceed benefit on low-value assets |
| Predictive | Forecast remaining life from trends and models | Higher setup cost, better planning | High-value assets with good data history | Poor data produces poor forecasts |
| Redesign or replace | Remove the cause or renew the asset | Capital cost, lower repeat failure cost | Chronic failures and end-of-life equipment | Replacing before the economic point wastes capital |
Worked Example: One Asset, Three Strategies, 15 Years
The figures below are illustrative assumptions for a mid-size rooftop cooling unit, not measured data. Replace them with your own work order history.
| Annual cost item | Run to failure | Preventive | Condition-based |
|---|---|---|---|
| Planned maintenance and monitoring | $2,000 | $9,000 | $11,000 |
| Repairs | $14,000 | $6,000 | $4,000 |
| Downtime and consequence | $9,000 | $3,000 | $1,500 |
| Annual total | $25,000 | $18,000 | $16,500 |
| 15-year total, undiscounted | $375,000 | $270,000 | $247,500 |
| Present value at 6% discount rate | about $242,800 | about $174,800 | about $160,300 |
Present value uses an annuity factor of about 9.71 for 15 years at 6%. Multiply the flat annual cost by that factor.
Build the Cost History Your Model Depends On
Capture labor, parts and downtime against each asset so strategy comparisons use real numbers.
Reading the Example Honestly
A model is a tool for testing assumptions, not a verdict. The example shows three useful behaviors.
- Cheapest to maintain is not cheapest to ownRun to failure has the lowest planned spend and the highest total.
- The best strategy has a break-even pointCondition-based work wins here only while monitoring stays under about $12,500 a year. Above that, preventive maintenance costs less.
- Consequence drives the rankingIf downtime cost were near zero, run to failure would look far better, which is why low-consequence assets deserve different treatment.
- Sensitivity mattersChange repair cost, discount rate and failure frequency by a reasonable range and check whether the ranking holds.
Inputs the Model Needs From Your CMMS
Every number in the model should trace to a record. These are the fields that matter most.
- Asset registerClass, age, location, criticality and installation cost.
- Work order historyCorrective, preventive and inspection work with labor hours and parts.
- Failure codingFailure mode and cause, so repeats can be counted.
- Downtime recordsDuration and consequence for each outage.
- Energy and contract dataUtility use and service agreements by asset.
- Replacement quotesCurrent cost to renew the asset and expected life.
Cost Categories Often Missed
| Category | Why it is missed | How to capture it |
|---|---|---|
| Internal labor | Treated as fixed salary, not asset cost | Record hours on every work order |
| Emergency premiums | Overtime and rush freight hide inside general budgets | Flag emergency work orders and expedited parts |
| Downtime impact | Owned by operations, not maintenance | Agree a cost-per-hour value with finance and operations |
| Energy drift | Degraded equipment uses more energy gradually | Compare consumption before and after maintenance |
| Early life loss | Neglect shortens service life without a visible event | Compare actual life with expected life by class |
| Compliance cost | Fines, re-inspections and documentation effort | Track inspection records and corrective actions |
The Repair-Versus-Replace Decision
Lifecycle models are most useful when they show when to stop repairing. Compare the annualized cost of keeping the asset with the annualized cost of a replacement.
- 1Total recent repair costSum corrective cost over the last three to five years for the asset.
- 2Annualize itDivide by the number of years to get a yearly figure, and project the trend forward.
- 3Annualize the replacementDivide purchase and installation cost by expected service life, then add expected annual maintenance.
- 4Add non-cost factorsSafety, efficiency, parts availability, refrigerant or code changes and tenant impact.
- 5Decide and recordReplace, continue with a defined review date or redesign the failing part.
Matching Strategy to Asset Criticality
Trends in Facility Lifecycle Planning for 2026
- Capital planning linked to maintenance dataReplacement forecasts built from actual cost and condition history, not age alone.
- Condition data from inspections and sensorsBetter evidence for extending or shortening asset life.
- Energy and sustainability targetsEfficiency losses from poor maintenance counted as lifecycle cost.
- Asset management standardsFrameworks such as ISO 55000 encourage documented, risk-based decisions across the asset lifecycle.
- Portfolio views across sitesMulti-site teams compare cost by asset class to find where standards or suppliers should change.
What to Look For in Lifecycle Cost Model Software
Features matter only if they produce trusted numbers. Use these questions when you compare platforms.
- Does every work order record labor, parts and downtime against an asset?
- Can assets be grouped by class, site and criticality for comparison?
- Can the platform report cost by asset over a selected period?
- Are failure modes and causes recorded in a structured way?
- Can preventive and corrective cost be separated in reports?
- Can data be exported for finance or capital planning tools?
- Does the mobile workflow make complete data entry realistic for technicians?
- Can assumptions such as discount rate and horizon be documented and reviewed?
How Oxmaint Supports Lifecycle Cost Analysis
Oxmaint provides the maintenance record that lifecycle models draw on. Relevant capabilities include:
- Asset management with lifecycle history, location and criticality.
- Preventive maintenance scheduling with recorded cost and completion.
- Work orders that capture labor, parts and root cause notes.
- Digital inspections that record condition findings over time.
- Mobile workflows including QR asset tags for fast record entry.
- Reporting and dashboards for cost by asset, class and site.
- Inventory for spare parts cost and usage.
Confirm which cost reports and exports fit your modeling method in a demo.
A 15-Year View: When Decisions Fall Due
- Years 1 to 3Warranty period. Establish baselines and confirm PM tasks.
- Years 4 to 8Stable operation. Optimize intervals and track cost per asset class.
- Years 9 to 12Wear increases. Compare repair cost trend with replacement cost.
- Years 13 to 15End-of-life planning. Decide on renewal, refurbishment or run-out.
Actual timing varies by equipment type, duty and environment. Use manufacturer life ranges as a starting point only.
Sensitivity Testing: Does the Ranking Survive Changed Assumptions?
A strategy that wins only under one set of assumptions is a weak recommendation. Vary the inputs that carry the most uncertainty and see whether the order changes.
| Assumption changed | What happens in the worked example | What to conclude |
|---|---|---|
| Downtime cost falls to zero | Run to failure drops to $16,000 a year, close to condition-based at $16,500 | Run to failure becomes credible when consequence is negligible |
| Monitoring cost rises to $14,500 a year | Condition-based reaches $20,000 a year, above preventive at $18,000 | Preventive maintenance becomes the better value |
| Preventive repairs fall to $4,000 a year | Preventive reaches $16,000 a year, below condition-based | Better task quality can beat added monitoring |
| Discount rate rises from 6% to 10% | The annuity factor falls to about 7.61, so every present value shrinks | The ranking stays the same, but the gaps in present value narrow |
If the ranking flips under small changes, collect better data before committing money to a new strategy.
Lifecycle Cost Drivers by Facility Asset Class
Different assets accumulate cost in different ways. Use this as a starting list when you build your asset class groups.
- HVAC and chillersEnergy use, coil and filter condition, compressor wear and refrigerant rules drive cost more than purchase price.
- Electrical distributionInspection, thermography and testing cost is small compared with the consequence of an outage.
- Emergency generatorsTest runs, fuel quality and battery condition determine whether the asset works when needed.
- Elevators and liftsService contracts, safety inspections and modernization timing dominate cost.
- Fire and life safetyMandatory inspection and testing cost is fixed by code, so lifecycle work focuses on component renewal.
- Roofing and envelopeEarly inspection and small repairs defer large renewal cost, but evidence of leaks must be recorded.
- Plumbing and pumpsSeal, bearing and valve failures create repeat repair cost and water damage risk.
Building the Model: A Practical Workflow
- 1Pick asset classes, not single assetsStart with classes that have many units and meaningful annual spend, so data volume supports the average.
- 2Define the service levelState the performance the asset must deliver, for example temperature control or uptime, so strategies are compared on equal terms.
- 3Pull three to five years of historySeparate preventive, corrective and inspection work, and flag emergency jobs.
- 4Estimate each strategy's cost profileUse history for current practice, and engineering judgment or supplier data for strategies you have not yet applied.
- 5Run the comparison and test sensitivityDocument every assumption, so reviewers can challenge it.
- 6Pilot before rolloutApply the winning strategy to a subset, and compare actual cost with the forecast after a full cycle.
End-of-Life, Disposal and Sustainability Costs
Lifecycle models should include the end of the asset's life. Disposal, decommissioning and regulatory requirements can add significant cost, and they differ by equipment type and region.
- Removal and disposalRigging, crane access, hazardous material handling and recycling fees.
- Refrigerant and fuel handlingRecovery, documentation and compliance obligations during retirement.
- Residual valueScrap or resale value can offset part of the cost for some equipment.
- Efficiency gain from replacementNewer equipment may reduce energy cost, so count the saving only where you can measure it.
Common Modeling Mistakes
- Using purchase price as the main comparison and ignoring maintenance and failure cost.
- Leaving downtime cost at zero because nobody owns the number.
- Comparing strategies over different time horizons.
- Assuming a strategy delivers its best case without checking compliance with the plan.
- Ignoring monitoring and data analysis cost in condition-based strategies.
- Building the model once and never updating it with actual cost.
- Treating averages as certain, when the spread between best and worst units in an asset class is often large.
- Presenting the result to leadership without listing the assumptions, which makes the recommendation easy to dismiss.
Frequently Asked Questions
What is a lifecycle cost model in maintenance?
It totals all costs of owning an asset over a set period so strategies can be compared fairly.
Which strategy is best over 15 years?
It depends on consequence, failure pattern and monitoring cost. Model each asset class instead of assuming one answer.
What data do we need first?
Asset records, work order cost and downtime. Try Oxmaint to start capturing them.
Should we discount future cost?
Usually yes, using a rate agreed with finance. Book a demo to discuss reporting inputs.
How often should the model be updated?
Review annually, and after major failures, equipment changes or large cost shifts.
Choose Maintenance Strategy With Numbers You Can Defend
Connect asset history, work order cost and inspection findings in one maintenance platform.