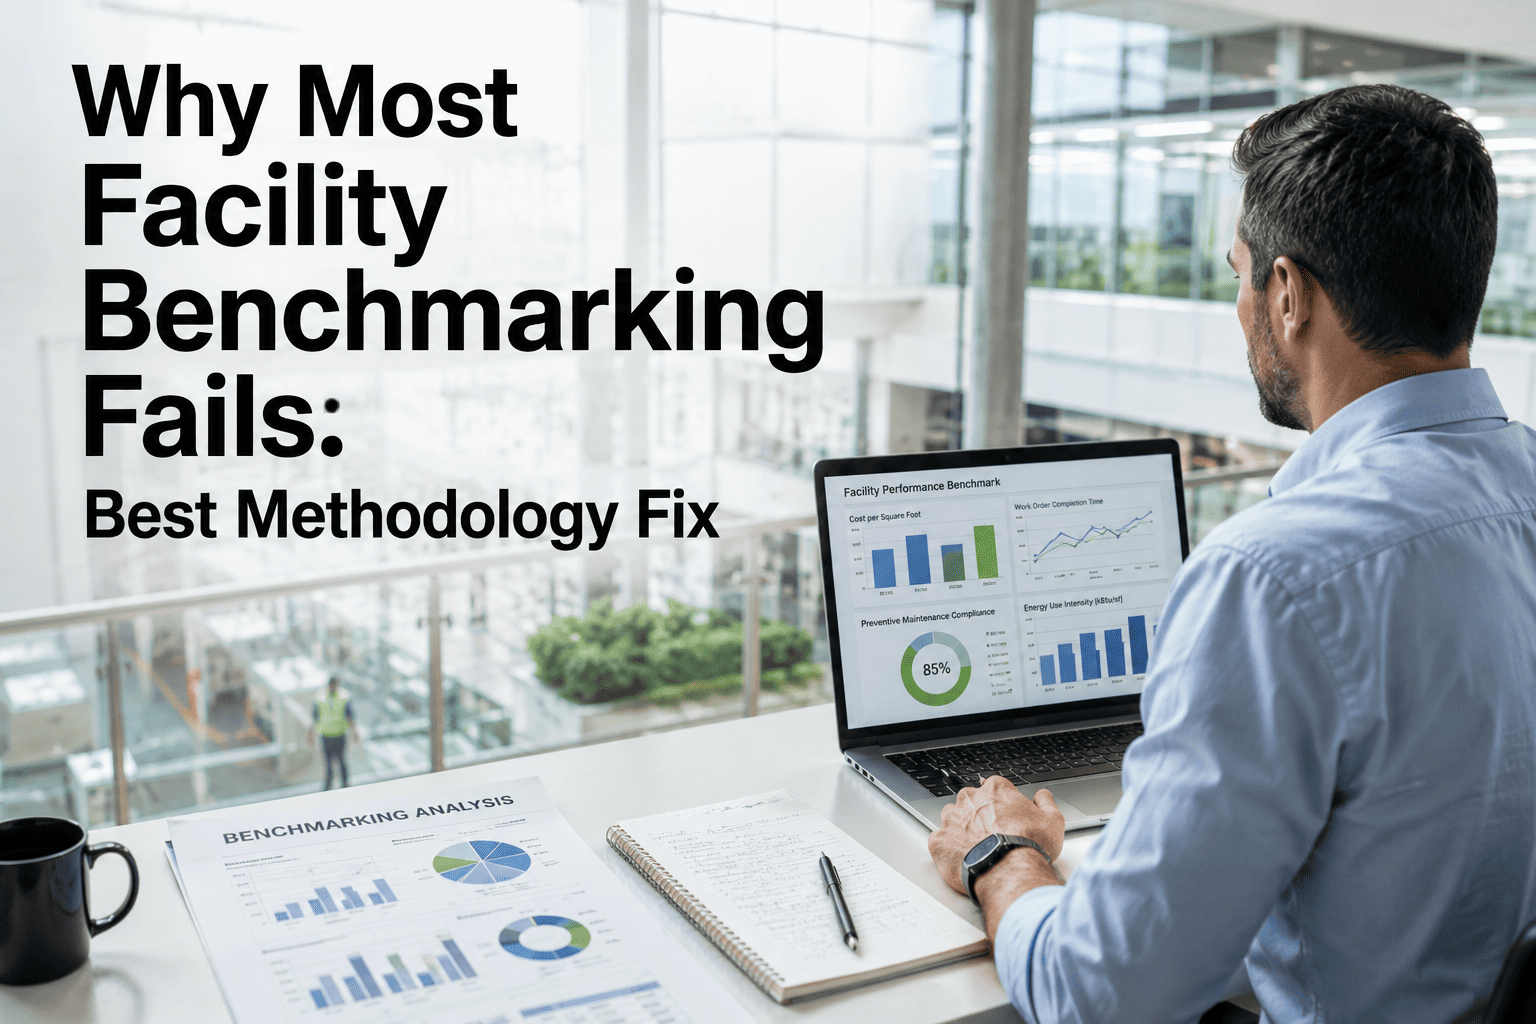
Most facility benchmarking fails because the methodology is broken — not the data. When teams compare inconsistent metrics, mismatched asset classes, and unnormalized cost figures, the result is a report no board trusts and no technician acts on. A sound benchmarking methodology for facility management starts with standardized data collection, normalized KPIs like cost per square foot and mean time between failures, and a CMMS platform that enforces consistency at the source. This guide breaks down exactly why benchmarking programs collapse, what the best benchmarking methodology looks like in 2026, and how top CMMS platforms make apples-to-apples comparison automatic. If you want to skip the theory and see it working on your own assets, Start Free Trial with OxMaint today.
Why do 7 out of 10 facility benchmarking programs produce numbers nobody trusts?
Because they compare apples to oranges — different asset classes, different cost codes, different time periods. The fix is not more data. It is a standardized methodology enforced by the right CMMS platform from day one.
The 5 Methodology Failures That Kill Facility Benchmarking
Industry surveys consistently show that fewer than 30% of facility benchmarking initiatives survive past their second year. The reason is almost never a lack of effort — it is a flawed benchmarking methodology that produces incomparable, unactionable numbers. Here are the five failures that account for the vast majority of abandoned programs.
Inconsistent Data Definitions
One site logs "repair cost" as labor only; another includes parts, contractor fees, and overhead. When definitions vary across facilities, every downstream comparison is meaningless. Standardizing field definitions is the first step in any credible facility benchmarking methodology.
Mismatched Asset Classes
Comparing a 15-year-old rooftop HVAC unit to a 2-year-old VRF system on "energy cost per unit" tells you nothing. Without normalized asset taxonomies — aligned to standards like ISO 55000 — cross-facility comparisons produce noise, not insight.
No Normalization for Context
A hospital in Houston and a warehouse in Minneapolis have wildly different operating profiles. Raw cost-per-square-foot comparisons without adjusting for climate, occupancy, criticality, and building age mislead every stakeholder who reads them.
Manual, Spreadsheet-Based Collection
When benchmarking data lives in emailed spreadsheets, version control collapses within weeks. A 2025 IFMA survey found that 62% of facility teams still rely on manual data aggregation — the single largest source of benchmarking errors.
No Feedback Loop to Operations
Benchmarks that sit in a quarterly PDF change nothing. The best benchmarking methodology platforms feed insights directly back into work order prioritization, PM schedules, and budget planning — closing the loop between measurement and action.
What the Best Benchmarking Methodology for Facility Management Looks Like in 2026
A defensible facility benchmarking methodology rests on four pillars: standardized data capture, normalized KPIs, automated collection, and closed-loop action. Top CMMS platforms in 2026 build all four into the workflow so benchmarking happens as a byproduct of daily operations — not as a separate, error-prone project.
Standardized Data Capture
Every work order, inspection, and cost entry uses the same fields, units, and taxonomies across all sites. OxMaint enforces this at the form level — technicians cannot submit incomplete or inconsistent records.
Normalized KPI Engine
Cost per square foot, PM compliance rate, MTBF, MTTR, and planned-vs-reactive ratio are calculated automatically with built-in normalization for facility type, size, and asset criticality.
Real-Time Collection
Mobile apps, QR asset tags, and IoT integrations feed data continuously. No quarterly scramble, no version-control nightmares — the benchmark updates as work happens on the plant floor or rooftop.
Closed-Loop Action
When a facility underperforms its peer group on energy cost or PM compliance, the system flags it and auto-generates corrective work orders. Benchmarks drive action, not just reports.
How a 12-Site Portfolio Fixed Its Benchmarking in 90 Days
Consider a real-world scenario: a property management group running 12 commercial facilities — 1.4M square feet total, $8.2M annual maintenance budget. Their benchmarking program had collapsed because each site manager tracked costs differently. Here is the timeline they followed to rebuild it on a standardized CMMS methodology.
Standardize Asset Taxonomy
All 12 sites mapped their equipment to a single asset hierarchy aligned to ISO 55000. OxMaint's bulk import and QR tagging reduced what would have been a 6-week manual audit to 10 business days.
Deploy Uniform Work Order Forms
Every site switched to identical digital work order templates with mandatory cost-code fields. Mobile apps with offline mode ensured adoption even in basement mechanical rooms and remote utility sites.
Activate Normalized KPI Dashboards
Cost per square foot, PM compliance, and reactive-vs-planned ratios went live across all 12 sites — automatically normalized for building age, climate zone, and occupancy type.
First Board-Ready Benchmark Report
The portfolio director presented the first apples-to-apples benchmark to the board. Two underperforming sites were flagged; corrective PM plans were auto-generated. The board approved a $340K reallocation based on data they finally trusted.
Result: within one quarter, the portfolio reduced its reactive maintenance share from 58% to 41%, identified $210K in annual energy waste across two sites, and produced the first benchmark report the board accepted without a single methodology challenge.
Top Benchmarking Methodology CMMS Platforms for Facility Teams in 2026
Not every CMMS supports rigorous benchmarking methodology. The table below compares the top platforms on the capabilities that matter most for facility benchmarking: data standardization, KPI normalization, multi-site support, and automated reporting.
| Capability | OxMaint | Legacy CMMS A | Spreadsheet + BI Tool |
|---|---|---|---|
| Standardized data capture (enforced fields) | Built-in, form-level enforcement | Optional, often bypassed | None — manual entry |
| Automatic KPI normalization | Native — adjusts for size, type, criticality | Requires custom scripting | Manual formulas, error-prone |
| Multi-site benchmarking dashboard | Real-time, unlimited sites | Add-on module, extra cost | Requires BI developer |
| Mobile + offline data collection | Full-featured iOS/Android, offline sync | Limited mobile, no offline | None |
| IoT / sensor integration | Native IoT connectors | Third-party middleware needed | None |
| Board-ready report generation | One-click, methodology documented | Manual export + formatting | Fully manual |
| Time to first reliable benchmark | 30–90 days | 6–12 months | Ongoing, never stable |
How OxMaint Delivers the Best Benchmarking Methodology for Facility Management
OxMaint is an AI-powered CMMS and EAM platform purpose-built for maintenance and reliability teams that need benchmarking they can defend. Here is how four specific capabilities map directly to the methodology failures described above.
Enforced Data Standardization
Custom work order templates with mandatory fields, dropdown taxonomies, and validation rules ensure every site captures data the same way. Eliminates the #1 cause of benchmarking failure — inconsistent definitions — at the source.
Outcome: 100% data consistency across sites from day oneAI-Normalized Analytics
OxMaint's analytics engine automatically normalizes KPIs for facility size, asset age, climate zone, and criticality — so a data center in Phoenix and a cold-storage warehouse in Chicago can be compared fairly on the same dashboard.
Outcome: board-trusted benchmarks without a data science teamMobile + Offline + QR Collection
Technicians scan a QR tag on any asset, log work from their phone — even offline in a basement or on a rooftop — and the data syncs automatically. No paper forms, no end-of-month data entry backlog.
Outcome: real-time data capture, 95%+ technician adoptionAutomated Compliance + Board Reports
Generate audit-ready and board-ready benchmark reports in minutes, with full methodology documentation attached. Every number is traceable back to the source work order — no more defending your data in the meeting.
Outcome: reports generated in minutes, accepted without challengeReady to Benchmark With Numbers Your Board Actually Trusts?
See OxMaint's benchmarking methodology running on your own assets in a live 30-minute walkthrough — no slides, just your data.
Frequently Asked Questions About Facility Benchmarking Methodology
Why do most facility benchmarking programs fail?
The primary reason is inconsistent methodology — not bad data. When different sites define cost categories differently, use mismatched asset classifications, or collect data manually via spreadsheets, the resulting comparisons are unreliable. A standardized CMMS platform like OxMaint enforces uniform data capture so benchmarks are apples-to-apples from the start.
What KPIs should a facility benchmarking methodology track?
The core set includes maintenance cost per square foot, PM compliance rate, planned-vs-reactive maintenance ratio, mean time between failures (MTBF), mean time to repair (MTTR), and energy cost per square foot. These should be normalized for facility type, size, age, and climate zone to ensure fair comparison across a portfolio.
How long does it take to get a reliable benchmark with a CMMS?
With a modern CMMS like OxMaint, most facility teams produce their first defensible benchmark within 30 to 90 days. The timeline depends on how quickly asset taxonomies are standardized and technicians adopt mobile data capture. Book a Demo to see a realistic implementation timeline for your portfolio.
Can I benchmark facilities with different asset types and ages?
Yes — but only with proper normalization. Raw cost comparisons between a new office tower and a 30-year-old industrial plant are meaningless. The best benchmarking methodology platforms normalize for asset age, criticality, building type, and operating context so cross-facility comparisons are fair and actionable.
What is the difference between internal and external facility benchmarking?
Internal benchmarking compares your own facilities against each other to identify best practices and underperformers. External benchmarking compares your metrics against industry standards or peer organizations. Both require the same methodological rigor — standardized data, normalized KPIs, and automated collection — which a CMMS provides. Start Free Trial to see both modes in action.
Stop Benchmarking With Broken Methodology
OxMaint gives your facility team standardized data capture, AI-normalized KPIs, and board-ready reports — all in one platform. Start your free trial or book a live demo to see it on your assets.
Free 14-day trial · No credit card required · Set up in minutes