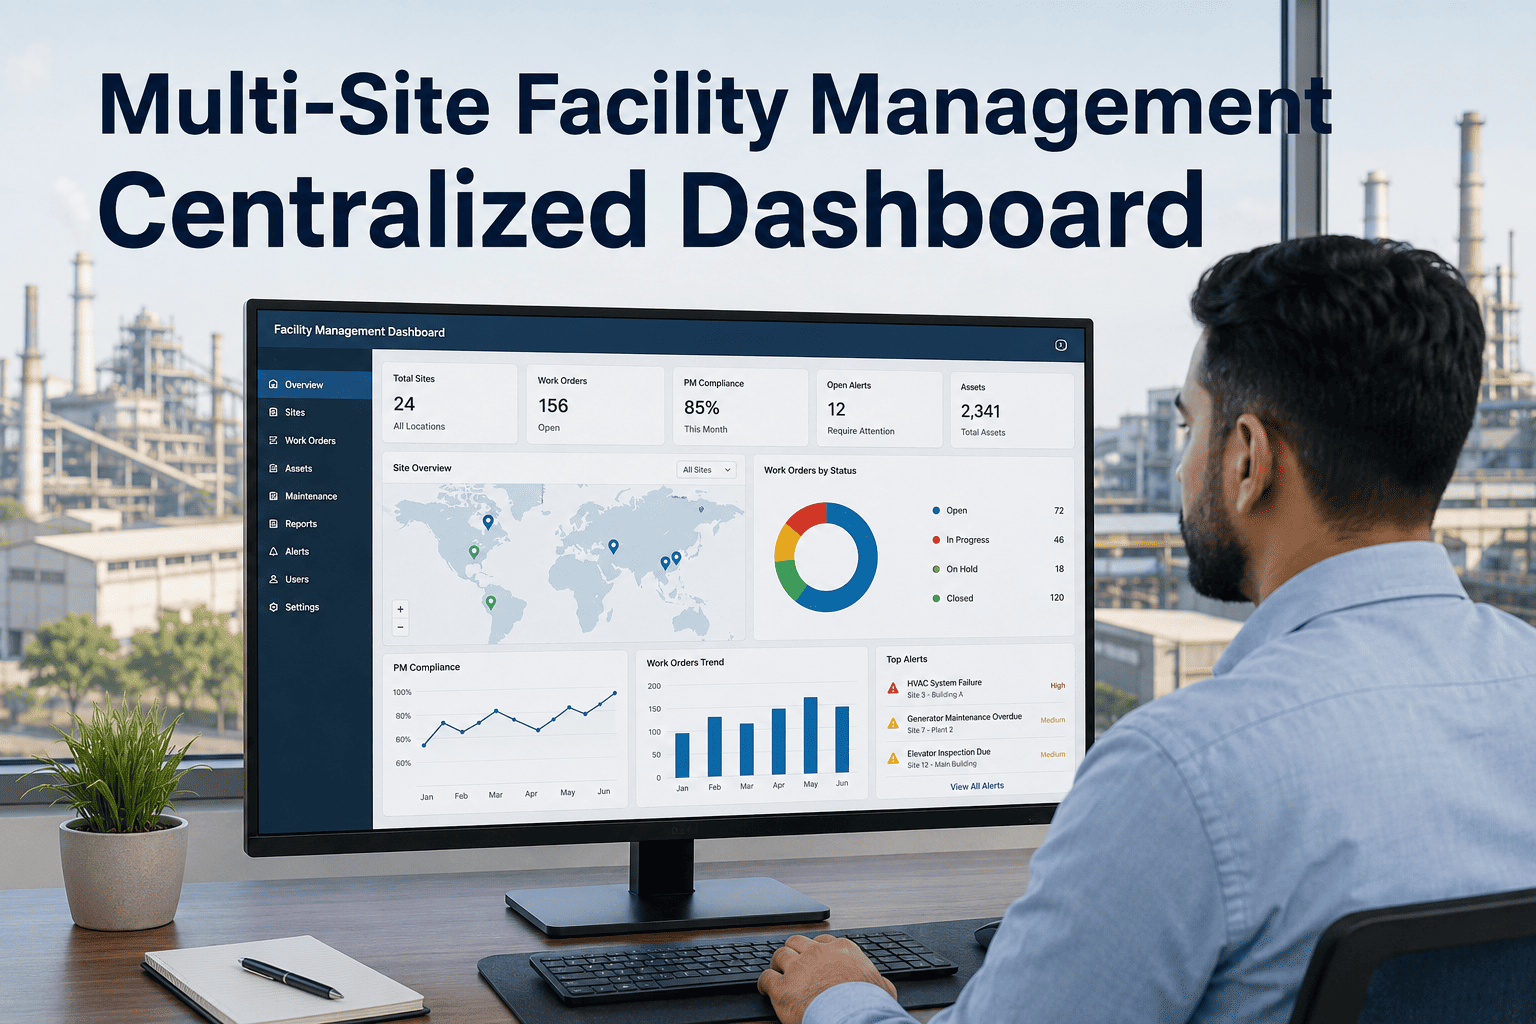
One building's inspection results tell you about that building. Fifty buildings' results, viewed together, tell you about your standards, your vendors, your capital plan and your risk. The trouble is that most portfolios still read inspections site by site, so the same roof defect, failing fire door or missed safety round repeats across locations without anyone seeing the pattern. This guide explains how to design a portfolio-level rollup that works from 5 to 500 buildings, and how an inspection and maintenance platform can feed it.
Multi-Site Inspection Rollup: One Dashboard, 50 Buildings
A rollup is not a bigger spreadsheet. It is a consistent scoring model, a clear hierarchy and a drill-down path from portfolio trend to the single failed item. Oxmaint captures inspections the same way everywhere so the rollup means something.
What Single-Site Views Miss
Each site manager sees their own results and usually explains them well. The patterns that cost the most only appear when sites are compared.
The Rollup Hierarchy: Build It Before the Dashboard
Dashboards fail when the underlying hierarchy is inconsistent. Settle the structure first, because every filter and total depends on it.
Tag every building with the same attributes so filters can slice the portfolio by age, use, owner, vendor and criticality without manual cleanup.
What to Roll Up, and How to Make It Comparable
A number is only useful in a rollup if it means the same thing at every site. Normalise each measure before summing or averaging.
| Measure | Site-level meaning | Portfolio-level use | Normalisation needed |
|---|---|---|---|
| Inspection completion | Rounds done against rounds due | Ranks compliance discipline across sites | Use the same schedule definitions and grace periods |
| Open defects by severity | Backlog at one building | Shows where risk is concentrated | Apply one severity scale, with written definitions |
| Defect age | Time since a defect was raised | Reveals sites where fixes stall | Measure from raise date to closure, not to inspection date |
| Condition score | Overall rating of the building | Trends and capital prioritisation | Weight systems by criticality, not by item count |
| Repeat finding rate | Same item failing again | Flags root causes and vendor quality | Define repeat window and asset match rules |
| Inspection to work order time | Delay turning findings into jobs | Tests the response process | Track from fail record to created work order |
See Every Building's Inspection Status in One Place
Standardise checklists, scoring and defect follow-up across the portfolio with Oxmaint, then roll results up without rebuilding spreadsheets each month.
Dashboard Layout: A Wireframe That Works
Resist the urge to show everything. A rollup dashboard should answer three questions in order: how are we doing, where is the problem, and what is being done.
Scaling the Design: 5, 50 and 500 Buildings
The right rollup changes with portfolio size. Overbuilding for a small estate wastes effort, and underbuilding for a large one hides risk.
- One shared checklist template
- Simple building list with status
- Manual review in a monthly meeting
- Focus on closing every open defect
- Regional grouping with owners
- Scored checklists and severity scale
- Automated dashboards and alerts
- Vendor and age-band comparisons
- Multi-level hierarchy with delegated views
- Risk-based inspection frequency
- Exception reporting instead of full lists
- Data quality audits and sampling
Scoring Without Distortion
Poorly designed scores hide more than they reveal. Four design choices protect the integrity of the rollup.
Weight by Consequence
A missing signage item and a failed fire door should not move the score equally. Weight systems and items by safety, compliance and operational criticality.
Cap the Score Floor
One critical failure should be able to override an otherwise high score. Use a rule that flags any building with an open critical item regardless of its average.
Avoid Averaging Away Risk
Averages across systems hide a failing one. Show the lowest system score beside the overall score so weakness is visible.
Keep the Method Stable
Changing the scoring formula breaks trends. If it must change, version the method and restate prior periods so comparisons stay fair.
Reading the Rollup: Patterns and What They Suggest
Once data is comparable, a handful of patterns recur. Each one points to a different kind of action.
| Pattern in the rollup | Likely cause | Action to consider |
|---|---|---|
| Same failure at many sites | Product, design or vendor method problem | Run a root cause review and update the standard |
| One region scores lower throughout | Vendor performance or local resourcing | Review the contract, staffing and supervision |
| High completion, low scores | Inspections done but defects not fixed | Tighten defect-to-work-order conversion and closure targets |
| Low completion, high scores | Selective or rushed inspections | Audit samples and enforce schedules |
| Older buildings cluster at the bottom | Ageing systems nearing end of life | Feed findings into the capital plan |
| Score drops after a vendor change | Transition gaps | Increase supervision and review onboarding |
Closing the Loop: From Finding to Fix
A rollup that only reports is a scoreboard. Value comes when each failed item becomes tracked work with an owner and a due date.
Data Quality Traps in Portfolio Rollups
Most rollup disappointments trace back to data, not to dashboard design. Audit for these problems before trusting a trend.
- Inconsistent asset naming: the same chiller appears under three names, so history and repeat failures are split.
- Template drift: sites quietly edit their own checklists, which breaks comparison.
- Backdated entries: inspections completed later and entered with the due date, hiding delays.
- Blank closures: defects closed without notes or photos, so nobody can verify the fix.
- Unmapped buildings: new or acquired sites missing region, use or criticality tags, leaving them outside filters.
- Mixed severity scales: acquired portfolios arriving with their own rating systems.
A short monthly data quality check, with a named owner, protects every report that follows.
Risk-Based Inspection Frequency Across a Portfolio
Inspecting every building the same way wastes effort at low-risk sites and under-serves critical ones. Set frequency from consequence and condition, then let the rollup show whether the rules are working.
| Building profile | Typical drivers | Inspection approach | What the rollup should show |
|---|---|---|---|
| High criticality | Life safety exposure, regulated use, high occupancy | Shorter intervals, deeper checklists, senior reviewer sign-off | On-time rate and zero ageing critical items |
| Ageing with known issues | Older systems, repeat failures, deferred work | Targeted checks on weak systems, plus condition re-scoring | Trend by system and repeat finding rate |
| Stable and low risk | Newer plant, good history, simple use | Standard intervals, lighter checklists, sampling audits | Steady score and no drift in completion |
| Newly acquired | Unknown condition, mixed records | Baseline survey first, then move to a standard cycle | Baseline score and data gaps closed |
Review frequency rules annually. If low-risk buildings keep producing critical findings, the rule is too relaxed.
Who Looks at the Rollup, and What They Decide
A dashboard is only effective when each audience knows what to do with it. Define the review rhythm and the decision each role owns.
A Monthly Portfolio Review Agenda
A short, repeatable agenda keeps the meeting on decisions rather than on explaining numbers.
- Headline movement: portfolio score, on-time inspections and critical open items versus last month.
- Exceptions: the five buildings with the largest fall, and the five with the largest improvement.
- Patterns: any defect type, system or vendor appearing across several sites.
- Stalled items: defects past due, with the reason and the named owner for each.
- Data quality: missing tags, blank closures and late entries found in the monthly check.
- Decisions: actions agreed, owners and due dates, recorded in the same system.
Start each review with the exceptions, not the averages. Averages feel reassuring, while exceptions are where decisions are needed.
Using the Rollup for Audits, Insurers and Capital Planning
Consistent inspection records serve more than the maintenance team. The same data supports several conversations that otherwise need separate evidence gathering.
Handling Acquisitions and Mixed Legacy Data
Portfolios grow by acquisition, and each new building arrives with its own forms, scales and naming. Plan the intake so the rollup does not fragment.
- Run a baseline inspection using your standard checklist before relying on any inherited scores.
- Map the old severity scale to yours in writing, and keep the original rating as a reference field.
- Import the asset list and clean names against your naming rules before the first scheduled round.
- Tag the building with region, use, age band and criticality on day one so it appears in every filter.
- Exclude the building from trend comparisons until it has at least two comparable inspection cycles.
This avoids a sudden score swing every time a new site joins, and keeps trends honest for leadership.
How Oxmaint Supports Portfolio Inspection Rollups
Oxmaint is maintenance management software with inspection, work order and reporting capability on one record, which keeps the rollup connected to action.
A 90-Day Path to a Working Rollup
Start small and prove value on a pilot group before scaling to the full portfolio.
- Define hierarchy and building tags
- Write one severity scale
- Standardise core checklists
- Pilot on a mixed group of buildings
- Train inspectors on mobile capture
- Link fails to work orders
- Launch portfolio dashboard
- Review patterns with regional leads
- Roll out remaining buildings
Frequently Asked Questions
Turn 50 Separate Inspection Packs Into One Clear Picture
Standardise inspections, link every failure to a work order and roll results up by region, vendor and building age with Oxmaint.