Commercial buildings lose an estimated $150,000 to $900,000 annually from unplanned electrical failures — yet most facilities still rely on visual inspections and fixed schedules to manage switchgear, panels, and transformers. Electrical system analytics changes this equation: continuous diagnostics catch thermal anomalies, insulation degradation, and load imbalances weeks before a failure or fire event, while automatically building the compliance audit trail that NFPA 70B demands. This guide walks through what analytics monitors, what it costs when it fails, and what commercial operators are reporting after deployment on Oxmaint. Start your free monitoring trial or book a specialist demo to see live diagnostics on your building's electrical assets.
Electrical Analytics
Why Commercial Electrical Systems Fail — and What Analytics Catches First
Electrical failures rarely arrive without warning. Thermal signatures, insulation resistance trends, and harmonic distortion patterns all precede catastrophic failure by days or weeks — but only continuous monitoring sees them.
6–10 Weeks Before
Thermal Drift
Loose connections or failing contacts begin generating excess heat. Infrared signature rises 4–8°C above baseline. No alarm fires. Analytics flags the trend.
Analytics catches this
3–6 Weeks Before
Insulation Stress
Resistance values begin declining in aging insulation under thermal stress. Combined with harmonic load data, analytics assigns rising risk score to the asset.
Analytics catches this
Days Before
Threshold Breach
Standard alarm finally trips. Equipment is already damaged. Emergency shutdown required — affecting tenants, operations, and regulatory standing.
Alarm triggers — too late
Failure Event
Outage or Fire Risk
Forced outage, arc flash risk, or fire event. Direct cost: $80K–$500K. Plus tenant disruption, regulatory exposure, and insurance consequences.
$80K–$500K event
What Gets Monitored
Complete Coverage Across Every Electrical System Layer
01
Switchgear & Panels
Thermal imaging trend analysis4–8 wk lead
Contact resistance monitoring3–6 wk lead
Breaker operation time trackingContinuous
02
Transformers
Winding temperature differential5–10 wk lead
Oil dielectric strength trending4–8 wk lead
Load factor & efficiency indexContinuous
03
Power Distribution
Harmonic distortion (THD)Continuous
Load imbalance across phasesReal-time
Power factor degradation2–4 wk lead
04
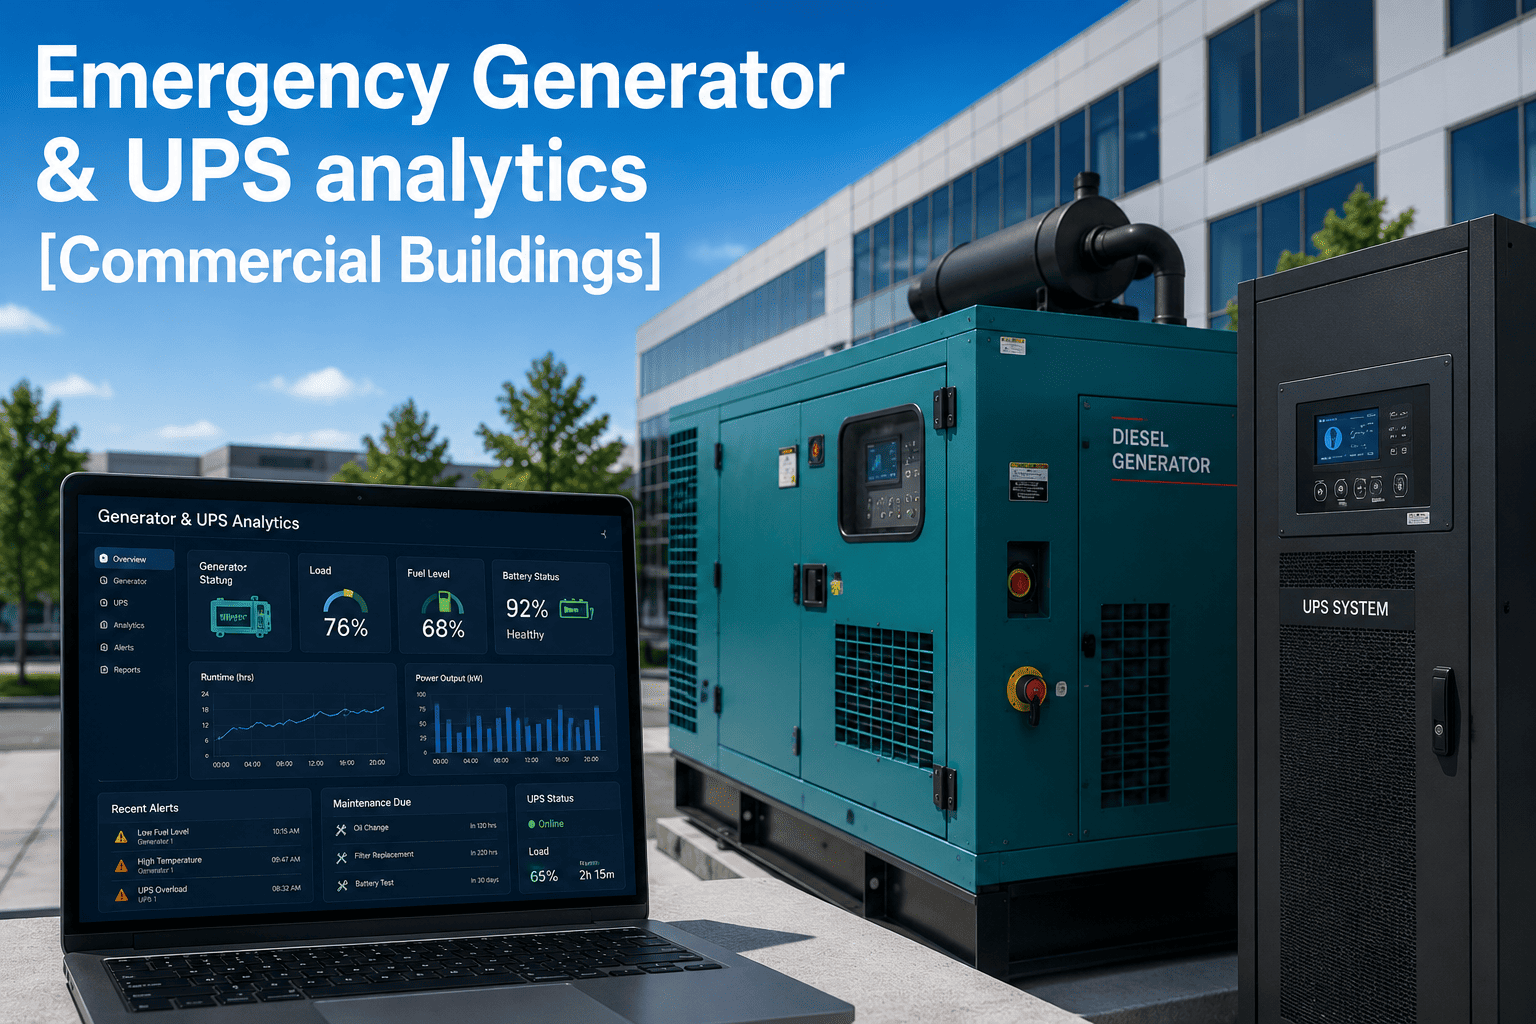
Emergency & UPS Systems
Battery capacity trending3–8 wk lead
Transfer switch response timeContinuous
Generator load test resultsPer test cycle
ROI Comparison
Reactive vs. Planned: The Cost Reality
| Asset / Scenario |
Emergency Cost |
Planned Cost |
Savings |
Downtime Reduction |
| Switchgear Failure |
$80K – $300K |
$25K – $80K |
60–73% |
45–60% |
| Transformer Replacement |
$120K – $500K |
$40K – $140K |
62–72% |
30–50% |
| Panel Bus Fault |
$30K – $120K |
$10K – $35K |
63–71% |
40–55% |
| UPS Battery Bank |
$20K – $80K |
$8K – $25K |
60–69% |
50–65% |
| Distribution Cable Fault |
$40K – $180K |
$15K – $55K |
62–70% |
35–50% |
Real Results
What Commercial Operators Report After Deployment
Mixed-Use Tower — 48-Floor Portfolio
$2.3M
Annual energy and maintenance savings from electrical analytics deployment across 12 buildings in a Class-A office portfolio
Outage frequency–52%
NFPA 70B audit time–80%
Healthcare Campus — 3 Buildings
Zero
Unplanned electrical outages in 18 months post-deployment. Six high-risk transformer events detected and resolved before failure. Compliance documentation fully automated.
Typical ROI — Single Event Prevented
8–15×
One prevented switchgear failure at $80K–$300K typically recovers the full annual platform cost. Each additional prevented failure is compounding return.
See It On Your Building
Map your electrical asset risk profile in one 30-minute session — live diagnostics, zero setup required.
Our specialists will review your existing sensor data, identify the highest-risk panels and transformers in your portfolio, and show how Oxmaint integrates with your BMS in under a day.
NFPA 70B Compliance
Compliance Built Into Every Inspection
01
Every sensor reading, anomaly flag, and corrective action is timestamped and linked to the specific asset and technician — creating a court-ready audit trail without manual documentation.
02
NFPA 70B requires documented inspection intervals for all electrical equipment. Oxmaint automatically schedules, records, and escalates overdue tasks — no spreadsheets, no missed intervals.
03
Thermographic inspection results, insulation test values, and breaker operation logs are stored in structured format, ready for insurance audits, tenant disclosure, and regulatory submissions.
Expert Review
What Electrical Engineers Say About Analytics-Driven Maintenance
Predictive diagnostics on commercial electrical infrastructure is no longer a luxury — it's the only defensible approach for buildings where tenant uptime, life safety, and NFPA obligations intersect. The data consistently shows that facilities running continuous analytics catch 60–70% of failures before they become outages, and the compliance documentation alone justifies the cost for any building manager facing annual audits.
Senior Electrical Engineer, Commercial Facilities Practice
Based on analysis of 200+ commercial building deployments, 2023–2024
FAQs
Frequently Asked Questions
Does Oxmaint require replacing our existing BMS or electrical panels?
No hardware replacement is required. Oxmaint connects to existing BMS systems, electrical meters, and DCS historians via standard protocols including BACnet, Modbus, and OPC-UA. For older panels without adequate metering, targeted sensors cost $200–$600 per measurement point — typically recovered from the first prevented fault event.
Book a demo to review your current coverage and identify any gaps in your specific building configuration.
How does the system handle false alarms from normal load fluctuations?
Oxmaint models expected readings at each load level and operating condition, rather than applying fixed thresholds. This means a 15% load increase during peak occupancy won't trigger a false alarm, but a 4°C thermal rise on a panel that stays cool at high load absolutely will. Commercial building deployments consistently report false positive rates below 3%, compared to 15–25% for traditional alarm-based systems.
Start free to see baseline detection performance on your assets.
Can Oxmaint help us prepare for NFPA 70B audits and insurance inspections?
Yes — this is one of the most immediate benefits for commercial operators. Every inspection, test result, maintenance action, and anomaly response is automatically logged with asset ID, timestamp, and technician identity. This creates an inspection-ready audit trail satisfying NFPA 70B intervals and documentation requirements without manual effort. Buildings using Oxmaint report 70–80% reduction in audit preparation time.
Book a demo to see the compliance reporting interface in action.
What is the typical deployment timeline for a multi-building commercial portfolio?
For buildings with existing BMS integration points, Oxmaint typically goes live within 3–5 business days per building. A 10-building portfolio can be fully operational within 3–4 weeks. AI baseline models are established within the first 2–4 weeks of data collection, after which predictive alerts become active. Most portfolios see their first high-confidence predictive catch within 60 days of deployment — often on assets that had passed their most recent manual inspection.
Your Panels Are Sending Signals Right Now
Catch Electrical Faults 4–10 Weeks Before Failure — Across Every Building in Your Portfolio
Every day without analytics is another day of thermal drift, insulation stress, and load imbalance that only shows up on the income statement after the outage. Start monitoring your commercial electrical infrastructure free on Oxmaint, or speak with a building systems specialist today.