Outcome-based FM contracts flip the accountability model from activity to result: instead of paying a provider for work orders completed, inspections logged or trucks rolled, you pay for uptime, comfort scores and asset availability that actually move the business. The difference between an output-based SLA and an FM outcome contract is the difference between measuring effort and measuring impact — and it reshapes how maintenance teams define scope, price risk and prove value. This guide breaks down the contract structure, outcome definition and measurement methodology behind performance-based facility management, and shows how modern CMMS platforms like OxMaint make outcome-based contracting facilities-ready from day one. If you want to see the toolset in action, Start Free Trial or read on.
You're paying for activity. You should be paying for results.
Output-based SLAs count work orders closed. Outcome-based FM contracts hold providers accountable for uptime, OEE and tenant satisfaction — the metrics that actually protect your assets and your margin. Here's how to structure the shift.
Why activity-based SLAs cost more and deliver less
Roughly 70% of facility management contracts still measure outputs — tickets closed, PMs completed, response times hit. The uncomfortable truth: a provider can score 100% on every output metric while your downtime, energy spend and tenant complaints all rise. Activity compliance is not asset reliability.
| Dimension | Output-Based SLA | Outcome-Based FM Contract |
|---|---|---|
| What you pay for | Tasks, visits, hours logged | Uptime, availability, satisfaction |
| Risk owner | Client absorbs downtime risk | Provider shares performance risk |
| Incentive structure | More activity = more revenue | Better results = gain-share / penalty |
| Provider behaviour | Prioritise volume and ticket closure | Prioritise root-cause and prevention |
| Asset lifecycle impact | Faster wear, reactive replacements | Extended lifecycle, predictable CapEx |
| Audit & compliance posture | Compliance logs, little proof of value | Outcome evidence tied to ISO 55000 |
| Total cost of ownership | 3–8% annual increase | 10–20% reduction within 24 months |
What's true and what's not about performance-based FM contracts
Outcome contracts are too risky for providers, so pricing doubles.
Providers using predictive CMMS data typically reduce their own rework by 25–35% — savings they pass through in competitive bids. Risk is priced, not doubled.
You need a 500-page contract to define every possible outcome.
The best results-based FM contracts define 5–8 outcome metrics, a measurement cadence, and a gain-share formula — often shorter than the SLA they replace.
Outcome-based contracting only works for large single-provider portfolios.
Multi-provider portfolios use a shared CMMS as the single source of truth — each provider is measured on the same outcome dashboard, regardless of size.
You lose visibility into what the provider is actually doing day-to-day.
Modern outcome contracts require real-time work-order and asset-health data streaming into the client's CMMS — visibility is higher, not lower, than under paper SLAs.
How to structure an outcome-based facilities contract
A results-based FM contract lives or dies on the clarity of its outcome definitions. Each outcome must be measurable in real time, tied to a business impact, and enforceable through a CMMS data feed — not a monthly spreadsheet export.
Map asset performance to business impact
Start with what the business cares about: production uptime, tenant comfort, energy intensity, safety incidents. A packaging plant might set "OEE ≥ 85% on Line 3" as an outcome; a commercial office might set "comfort complaints < 1 per 10K sq ft per month." Every outcome must be expressible as a number the CMMS can capture automatically.
Establish a defensible 12-month baseline
Pull 12 months of CMMS work-order, downtime and sensor data to set the current baseline. If your HVAC uptime is 97.4%, a 99.0% target is aggressive but achievable. Targets set without baselines become negotiation footballs — let the data anchor them.
Automate data capture, eliminate manual reporting
The provider and client must see the same numbers. Outcome metrics should flow from the CMMS and IoT sensors into a shared dashboard — not a PDF emailed on the 15th. Define the data source, refresh frequency (real-time or daily), and dispute-resolution process up front.
Align incentives with a clear financial formula
A simple model: provider earns a bonus for exceeding targets (e.g. +1% fee per 0.5% uptime above target, capped at 10%) and absorbs a penalty for missing them (e.g. –1% per 0.5% below, capped at 8%). The formula should be on one page and auditable from CMMS data alone.
Run quarterly outcome reviews, not SLA audits
Replace monthly SLA compliance meetings with quarterly outcome reviews. Look at trend lines, root-cause analysis and predictive-maintenance insights. If a provider is hitting the number but burning out assets, the review surfaces it early — before the next renewal cycle.
Outcome vs output SLA: the value equation
The financial case for outcome-based FM contracts is straightforward: you stop paying for activity that doesn't move the needle and start paying for the asset performance that does. Here's the equation that makes the shift defensible to your CFO.
Compare this figure against your current output-SLA spend + downtime cost. If the outcome value exceeds the gap by 15%+, the switch is self-funding within Year 1.
A 180-asset manufacturing site spending $42K/yr on FM
Payback period: under 4 months. Three-year net value: $267K on a $50K investment.
How OxMaint powers outcome-based FM contracts
Outcome contracts are only as strong as the data behind them. OxMaint gives both client and provider a single AI-powered CMMS that captures every work order, sensor reading and asset event — turning outcome definitions into live, auditable dashboards rather than quarterly spreadsheets.
Real-Time Outcome Dashboards
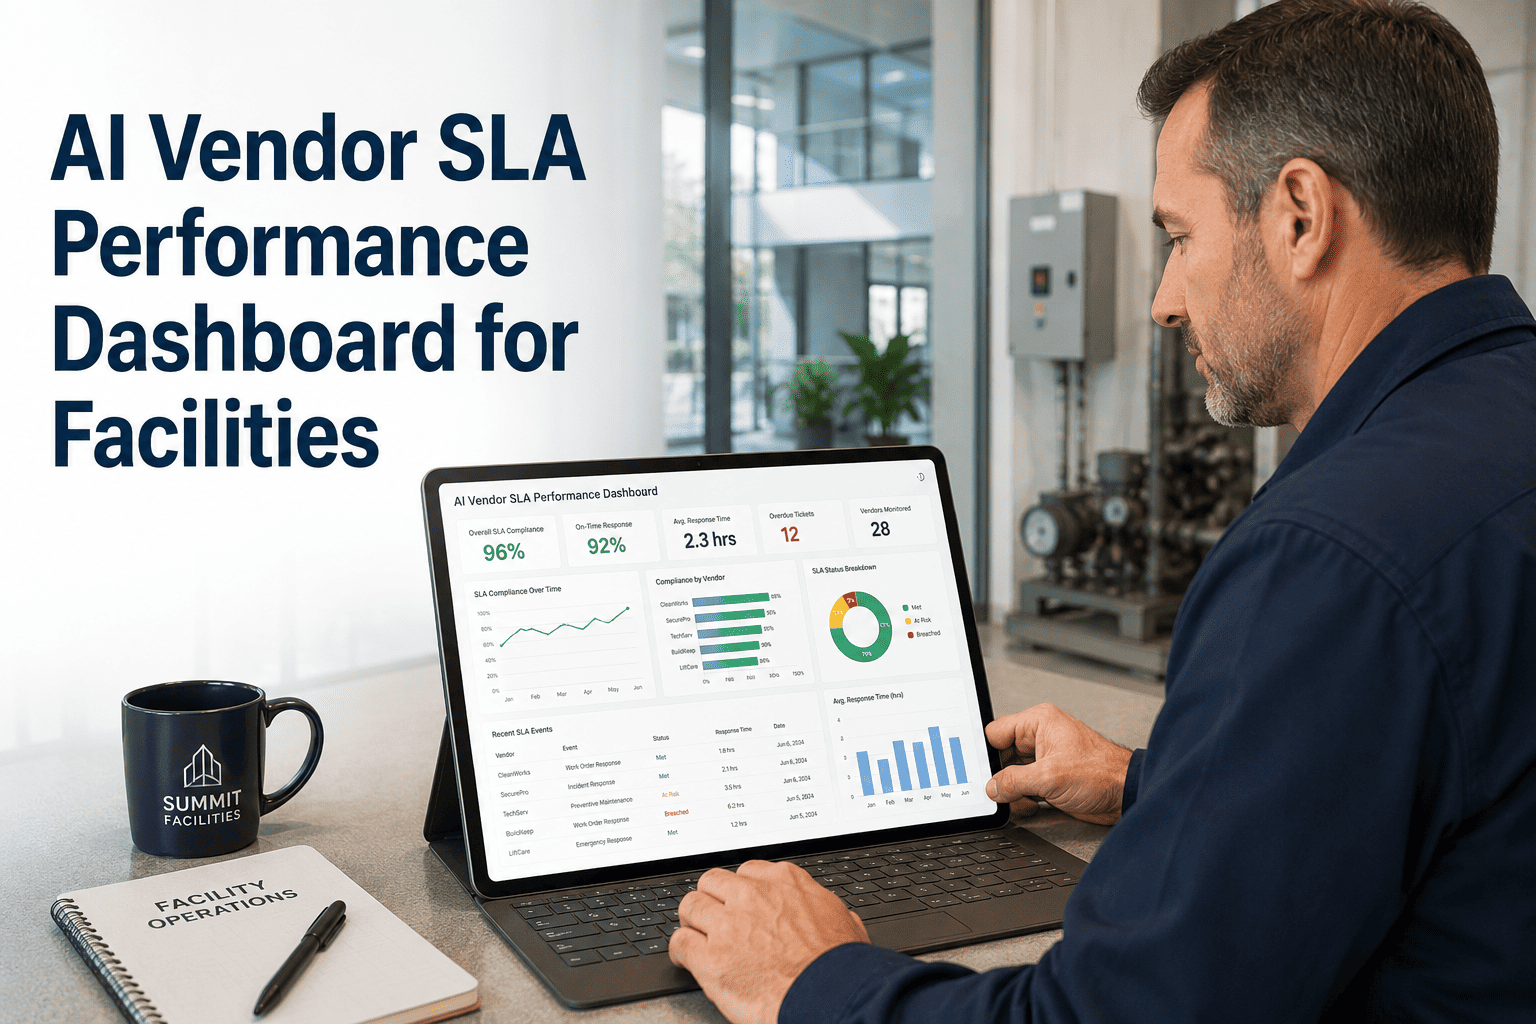
Live uptime, MTTR, OEE and comfort-score widgets fed by CMMS work orders and IoT sensors. Both parties see the same numbers — no disputes, no end-of-month surprises. Cut unplanned downtime 30–50% by catching drift before it becomes failure.
Predictive Maintenance Engine
AI models trained on vibration, temperature and work-order history predict failures 7–21 days out — letting providers hit outcome targets by preventing breakdowns, not reacting to them. Eliminate paper work orders and reactive callouts in one move.
Gain-Share & Penalty Tracking
Built-in SLA and outcome-scorecard modules automatically calculate gain-share bonuses and penalties from live performance data. Every dollar is auditable from a work-order trail — ISO 55000-aligned and audit-ready in minutes, not weeks.
Asset Lifecycle & CapEx Forecasting
Track every asset's condition, maintenance history and remaining useful life. Providers can prove they extended asset life by 2–4 years — the exact CapEx deferral value that funds their gain-share bonus and justifies the outcome model to your board.
Ready to stop paying for activity and start paying for outcomes?
See how OxMaint turns outcome-based FM contract metrics into live, auditable dashboards — book a 30-minute demo on your assets.
Outcome-based FM contracts: what buyers ask most
What is the difference between an outcome-based and output-based FM contract?
An output-based SLA pays a provider for completing defined activities — inspections, work orders, response visits. An outcome-based FM contract pays for the result those activities produce: uptime, availability, comfort, safety. Outputs measure effort; outcomes measure impact. The shift moves risk from client to provider and aligns incentives around asset performance rather than task volume.
How do you measure outcomes in a performance-based facility management contract?
Each outcome is defined as a measurable metric with a data source, refresh frequency and target. Examples: HVAC uptime ≥ 99.2% (from CMMS work orders and BMS sensors), MTTR < 4 hours (from work-order timestamps), comfort score ≥ 4.5/5 (from tenant surveys). A platform like OxMaint automates capture and feeds both parties a shared, real-time dashboard — you can Start Free Trial to see the dashboards live.
Are outcome-based FM contracts more expensive than traditional SLAs?
The contract fee may carry a 5–10% premium for risk transfer, but total cost of ownership typically drops 10–20% within 24 months because downtime, rework and premature asset replacement fall. The worked example above shows a $89K net annual value on a $50K contract — the outcome model is self-funding when measurement is automated and gain-share is structured correctly.
What software do you need to run an outcome-based facilities contract?
You need a CMMS or EAM that captures work orders, asset condition, sensor data and SLA performance in one system — accessible to both client and provider. OxMaint provides real-time outcome dashboards, predictive maintenance alerts, automated gain-share calculations and ISO 55000-aligned audit trails. Book a Demo to see how it maps to your contract structure.
How long does it take to transition from an output SLA to an outcome contract?
A typical transition takes 3–6 months: 4–8 weeks to baseline current performance from CMMS data, 2–4 weeks to define outcome metrics and gain-share formulas with the provider, and 8–12 weeks of parallel running before the outcome contract goes live. Organisations already on a modern CMMS like OxMaint can compress this to 8–10 weeks because the data infrastructure is already in place.
Turn FM outcomes into a live, auditable dashboard
OxMaint gives you the CMMS, predictive analytics and gain-share tracking to make outcome-based FM contracts work — for both sides of the table.
Free 14-day trial · No credit card