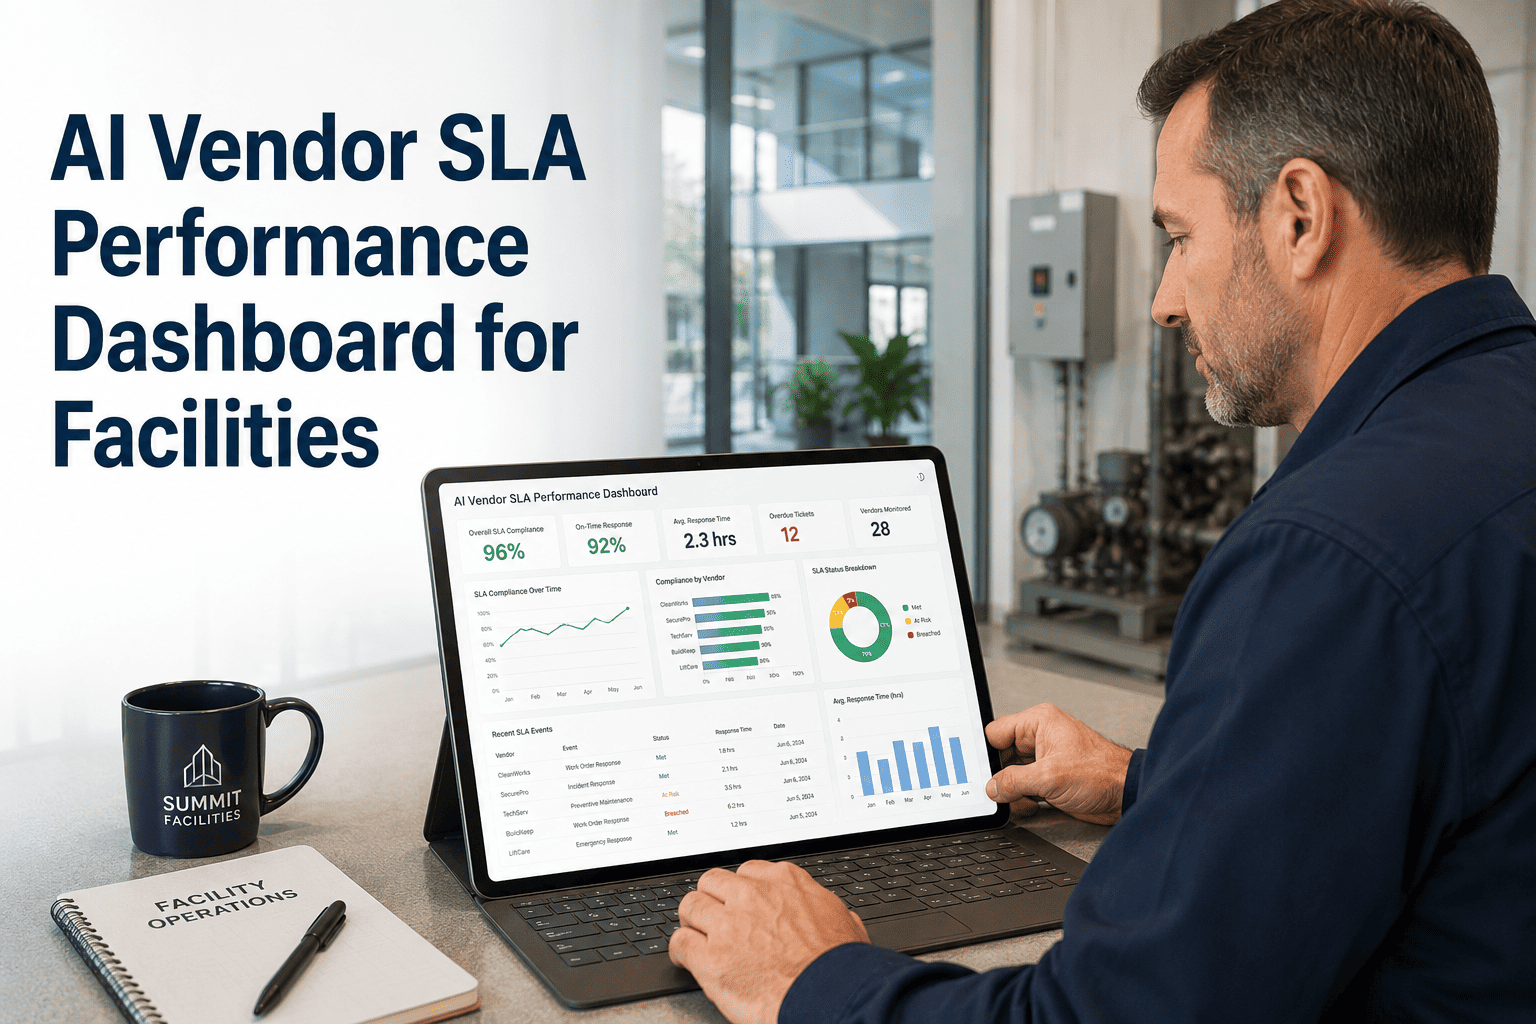
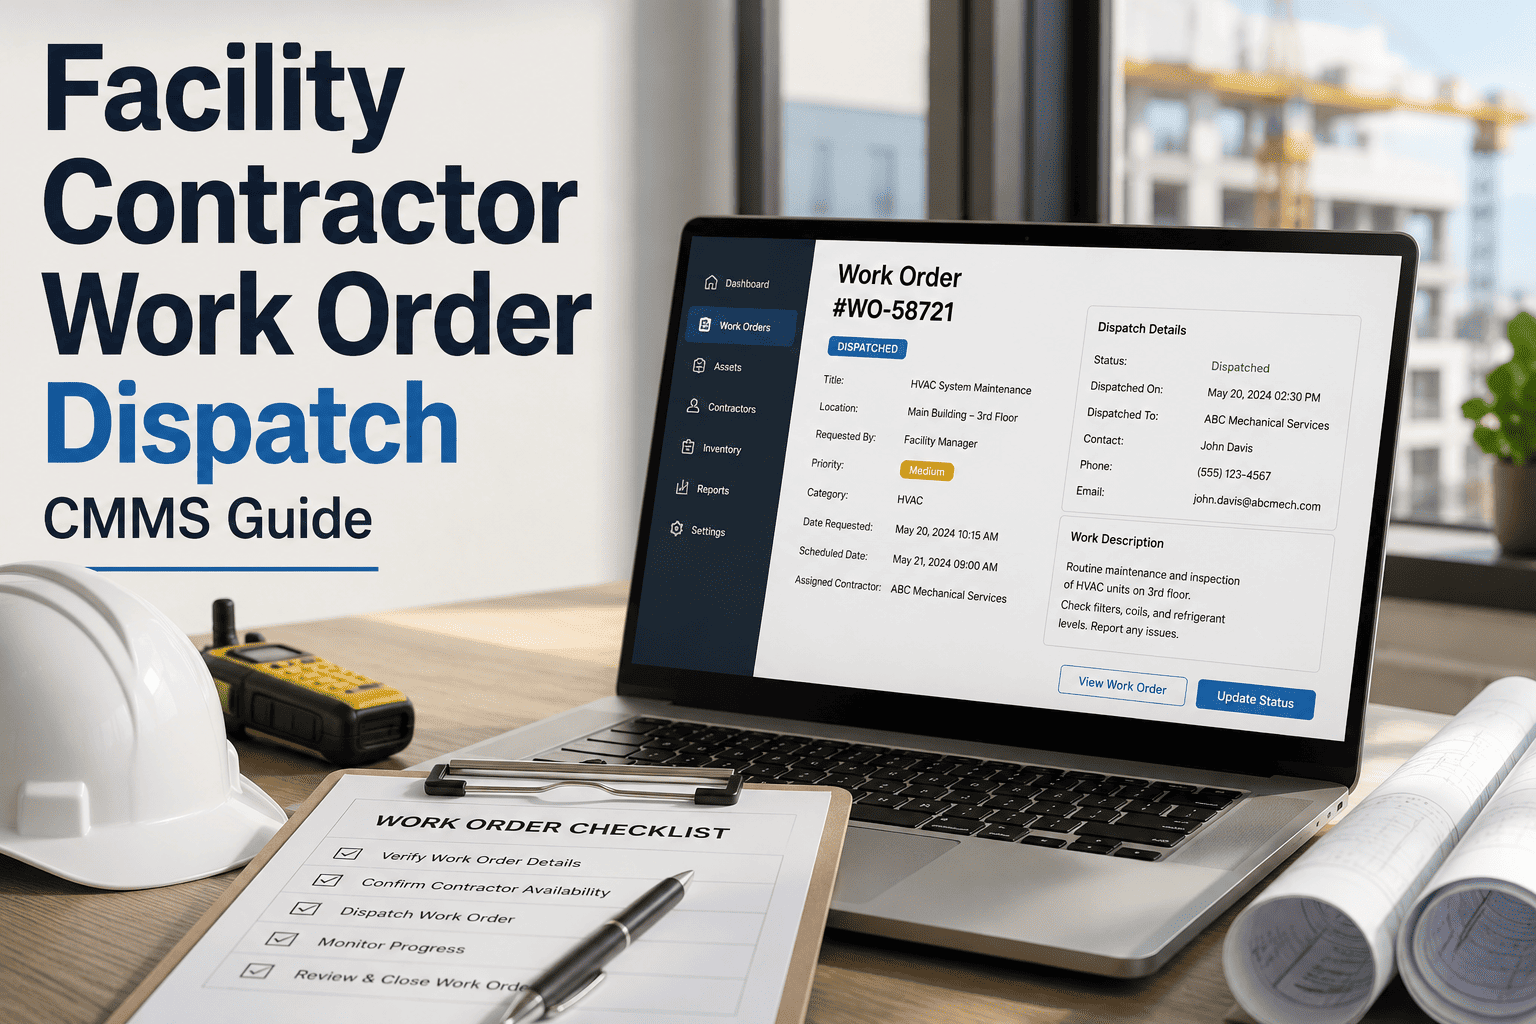
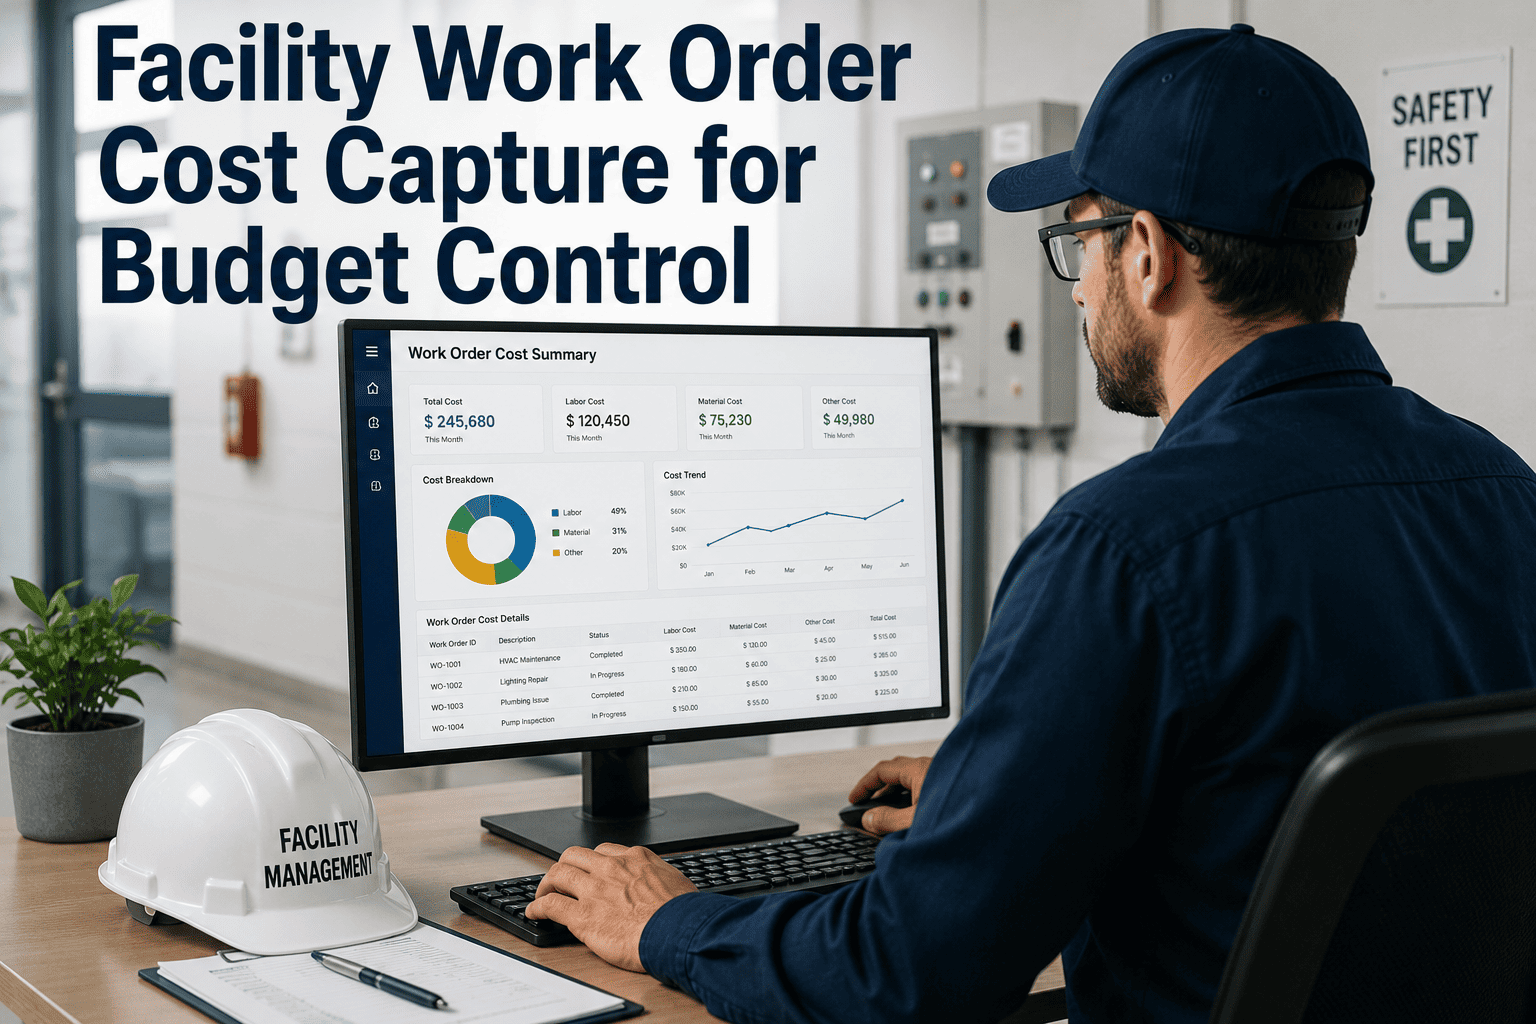
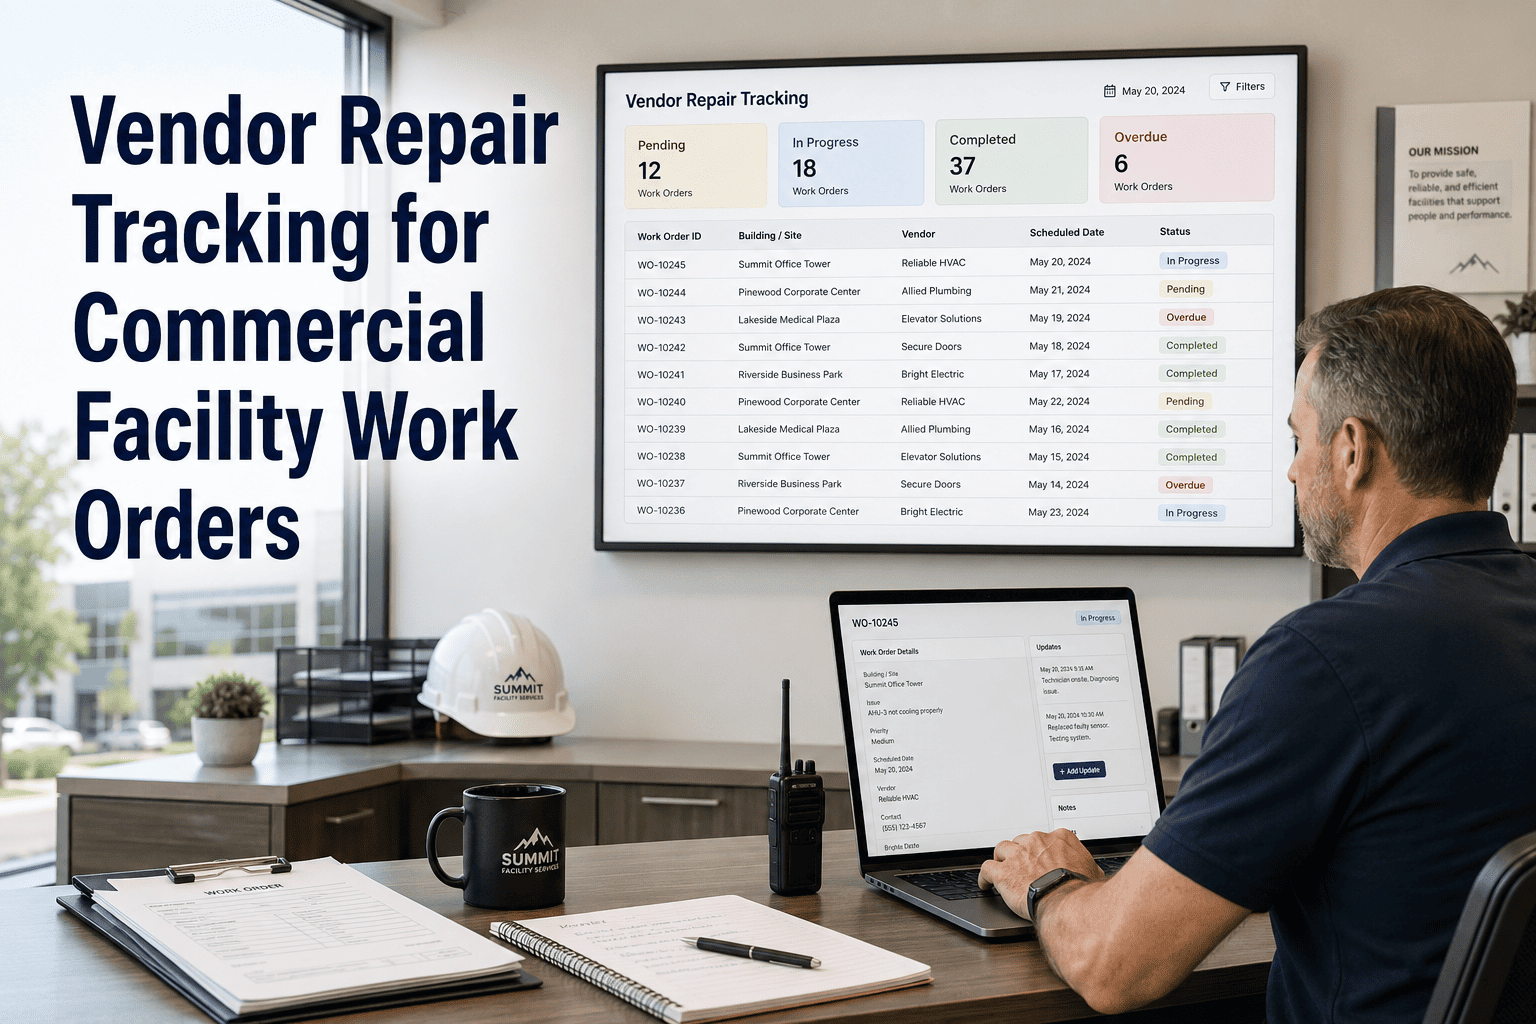
The average enterprise now manages 286 vendors according to Whistic's 2024 Third-Party Risk Management report — and in a multi-site facility operation, vendor performance data is typically scattered across work order systems, invoice records, email complaint threads, and supervisor notebooks that no one has consolidated into a performance picture since the contracts were signed. The result is a facilities team that cannot tell you, on demand, which HVAC contractor has the highest first-visit resolution rate, which electrical vendor is consistently missing their P2 response SLA, or which plumbing contractor's cost-per-work-order is 40% above the regional benchmark. These are not difficult questions. They are questions that require a single platform pulling vendor data from work orders, invoice records, and SLA commitments simultaneously — and presenting the comparison in a format that drives contract renewal decisions rather than filing cabinet storage. Book a demo to see OxMaint's AI Vendor SLA Performance Dashboard for facilities — or start free and connect your first vendor record today.
Article · Vendor & Contractor Management · AI Analytics
AI Vendor SLA Performance Dashboard for Facilities
The six KPIs that define vendor performance in facility maintenance, how AI surfaces what manual reporting misses, and the benchmark data that makes contract renewal a data-driven decision rather than a relationship-based one.
What a Vendor SLA Dashboard Actually Shows — The 6 KPIs That Matter
Most facilities track one vendor metric informally: "Did they show up?" A structured SLA dashboard tracks six dimensions that collectively answer whether a vendor is worth renewing at the same rate, renegotiating, or replacing — before a poor performer costs you a missed SLA penalty, an emergency callout fee, or a failed audit.
P1: ≤ 2 hrs · P2: ≤ 8 hrs · P3: ≤ 24 hrs
Mean time from work order assignment to technician on-site. Tracked per priority level — a vendor who meets P3 SLA 98% of the time but misses P1 response 30% of the time has an SLA profile that masks a critical performance gap.
AI insight: Trends P1 response time by day-of-week — identifies vendors who consistently miss P1 SLA on weekends despite contractual commitment.
02
First-Visit Resolution
Industry benchmark: 72–78% FVR (BIFM data)
Percentage of work orders resolved on the first visit without a return visit, additional parts procurement, or follow-up repair within 30 days. Low FVR indicates technicians arriving without adequate diagnostics, tools, or skills for the assigned scope.
AI insight: Correlates low FVR with work order types — identifies specific asset categories or fault types where a vendor consistently requires return visits.
Acceptable: ≥ 90% · Concern: 85–90% · Breach: < 85%
Percentage of work orders completed within the contracted SLA window for each priority tier. The overall compliance rate masks priority-specific failures — always view SLA compliance by P1/P2/P3/P4 separately, not as a blended average that allows low-priority compliance to offset high-priority failures.
AI insight: Flags vendors approaching SLA breach thresholds in real time — allowing contract enforcement or escalation before the monthly report.
Compare against: Regional benchmark, portfolio average, prior contract period
Average invoice value per completed work order, segmented by work type (reactive, planned, specialist). Without segmentation, a vendor doing predominantly complex specialist work appears expensive against one doing routine PM — the cost benchmark must compare like-for-like by work category.
AI insight: Identifies invoice value drift — vendors whose average cost-per-work-order increases more than 8% above their contract rate without scope justification.
05
Work Order Quality Score
Quality gate: >95% closed with complete documentation
Percentage of work orders closed with required documentation complete — actual time, findings, parts used, photos, and sign-off. Vendors who consistently close work orders with incomplete records create maintenance history gaps and audit compliance risks that are not reflected in their response time or cost metrics.
AI insight: Auto-scores each closed work order against completeness criteria — generates quality score per vendor without manual review.
Flag: Same asset failure within 30 days of vendor repair
Percentage of work orders that are followed within 30 days by another work order on the same asset for the same or related fault. A high repeat failure rate indicates inadequate root cause repair — the symptom is being addressed but not the underlying cause, generating unnecessary reactive spend.
AI insight: Links return visits to original work orders automatically — no manual matching required to identify a pattern the vendor has not disclosed.
Vendor Benchmarking — What Good Looks Like Across Facility Maintenance Trades
| KPI |
HVAC Contractors |
Electrical Contractors |
Plumbing/Mechanical |
Below This = Review Contract |
| P1 Response Time |
≤ 2 hrs (contracted) |
≤ 2 hrs (contracted) |
≤ 2 hrs (contracted) |
P1 MTTR > 4 hrs without proactive communication is a relationship breakdown signal |
| Overall SLA Compliance |
Target ≥ 92% |
Target ≥ 92% |
Target ≥ 90% |
Below 85% for 2 consecutive months = formal performance notice |
| First-Visit Resolution |
75–80% |
78–85% |
72–78% |
Below 65% indicates systemic diagnostic or skills gap |
| Repeat Failure Rate |
≤ 8% (30-day) |
≤ 5% (30-day) |
≤ 8% (30-day) |
Above 15% over 3 months = poor root cause practice — escalate |
| Work Order Quality Score |
≥ 95% complete |
≥ 95% complete |
≥ 95% complete |
Below 85% = maintenance history gap risk — compliance exposure |
| Invoice Accuracy Rate |
≥ 98% |
≥ 98% |
≥ 97% |
Below 95% = manual invoice dispute overhead exceeds vendor management cost savings |
AI VENDOR DASHBOARD · OXMAINT · FACILITIES
Know Which Vendors Are Worth Renewing Before the Contract Arrives on Your Desk.
OxMaint AI pulls vendor performance data from every work order, permit, and invoice — scoring each vendor against your SLA commitments and the industry benchmarks that tell you whether your spend is competitive or carrying a performance gap.
How AI Changes Vendor Performance Analysis
Manual vendor reporting asks a human to pull data from four systems, reconcile it, and produce a summary once a quarter. By the time the report is presented, the underperforming vendor has already caused two months of SLA breaches that no one addressed in real time. AI-driven vendor analytics changes the time horizon from retrospective to predictive.
Manual / Quarterly Report
OxMaint AI Continuous Analysis
SLA compliance calculated at month-end from exported spreadsheet data
Repeat failures identified by supervisor memory or complaint
Cost benchmark unavailable — no like-for-like comparison between vendors
Performance review happens at contract renewal — performance problems already cost 12 months of SLA breaches
Quality of work order documentation assessed during audits — gaps found months after the job
SLA compliance calculated per work order as it closes — vendor approaching breach flagged in real time
Repeat failures auto-linked to original work orders — vendor pattern identified within 30 days, not discovered at audit
Cost per work order benchmarked by trade type — invoice drift above 8% from contract rate auto-flagged
Performance score updated continuously — underperforming vendors visible 6 months before contract renewal decision
Documentation quality scored at work order closure — incomplete records flagged before the maintenance history gap accumulates
Expert Review
"The most expensive vendor management failure I see in multi-site facility operations is not the one where a vendor dramatically fails — it is the one where a vendor consistently underperforms at a level that never quite triggers a formal review. The HVAC contractor who meets their P1 SLA 81% of the time instead of the contracted 92%. The electrical vendor whose average cost per work order has drifted 22% above the contract rate over 18 months without anyone noticing because no one is benchmarking invoice data against contracted scope. The plumbing contractor with a 19% repeat failure rate that has been masked by the fact that their overall work order volume is low. None of these vendors are dramatically failing. They are all quietly costing money and quality, and they will continue to do so until the contract comes up for renewal and the facilities manager tries to assemble the performance case from four different systems' worth of data that was never integrated. An AI vendor dashboard that pulls performance from work orders, permits, and invoices continuously — and surfaces the underperformance in real time rather than at renewal — is not a luxury feature for enterprise facility portfolios. It is the basic management infrastructure that makes vendor relationships financially accountable."
Sandra Okafor, CFM, RPA
Certified Facility Manager · Real Property Administrator · 19 years multi-site facility operations and vendor performance management · Former VP Facilities, 400+ location retail chain · Specialist in CMMS-driven vendor analytics and SLA governance frameworks
Frequently Asked Questions
What are the most important KPIs for measuring facility maintenance vendor performance?
The six KPIs that collectively provide a complete vendor performance picture are:
response time by priority (P1/P2/P3 separately, not blended);
SLA compliance rate (≥90% is the minimum acceptable threshold, tracked per priority tier);
first-visit resolution rate (industry benchmark 72–78%, below 65% indicates a skills or diagnostics gap);
repeat failure rate (same asset, same fault within 30 days — above 15% signals inadequate root cause practice);
work order quality score (documentation completeness at closure); and
cost per work order benchmarked by trade type. Each KPI must be measured per priority level and per work type — blended averages mask the performance gaps that cost the most.
Book a demo to see all six KPIs on the OxMaint Vendor Dashboard.
How does OxMaint calculate vendor SLA compliance automatically?
OxMaint records the timestamp of work order assignment to the vendor and the timestamp of work order closure or first technician on-site visit. The SLA compliance calculation is automatic — each work order is scored as compliant or breached against the contracted response and resolution SLA for its priority level. Compliance scores update in real time as work orders close, so the vendor dashboard shows current-month compliance without waiting for a monthly report cycle. Vendors approaching SLA breach thresholds generate an automated alert to the facility manager so the issue can be escalated before it accumulates.
Start free to configure your first SLA rules per vendor.
How should facility managers use vendor performance data in contract negotiations?
Vendor performance data is most powerful in contract negotiations when it is specific, chronological, and comparative. A vendor whose first-visit resolution rate has declined from 78% to 61% over 12 months has a performance trend that justifies rate renegotiation — but only if the data is retrievable in a documented format that the vendor cannot dispute. Comparative data across vendors in the same trade is equally powerful: if two competing HVAC contractors both service your portfolio, their side-by-side SLA compliance, cost, and quality scores make the contract renewal decision quantitative rather than relationship-based. OxMaint generates a vendor comparison report across these dimensions that can be used directly in renewal negotiations.
What is a realistic SLA compliance target for facility maintenance contractors?
Industry benchmarks suggest ≥90% overall SLA compliance as the minimum acceptable threshold, with best-in-class vendors achieving 95%+ consistently. The caveat: these benchmarks must be applied per priority tier. A vendor meeting 98% P3/P4 compliance but only 72% P1 compliance has a blended rate that looks acceptable while masking a critical failure. Set separate minimum thresholds — we recommend 95%+ for P1, 92%+ for P2, 90%+ for P3 — and treat any vendor falling below P1 threshold for two consecutive months as requiring a formal performance notice under the contract terms.
AI VENDOR DASHBOARD · OXMAINT · FACILITIES
Stop Discovering Vendor Underperformance at Contract Renewal. Start Seeing It in Real Time.
OxMaint AI Vendor SLA Dashboard tracks response time, SLA compliance, first-visit resolution, repeat failure rates, work order quality, and cost benchmarks across your entire vendor portfolio — surfacing the underperformance that manual quarterly reporting finds 12 months too late.