The Planned vs Reactive Work Ratio as an FM Maturity Metric
By Corin Hale on August 4, 2026
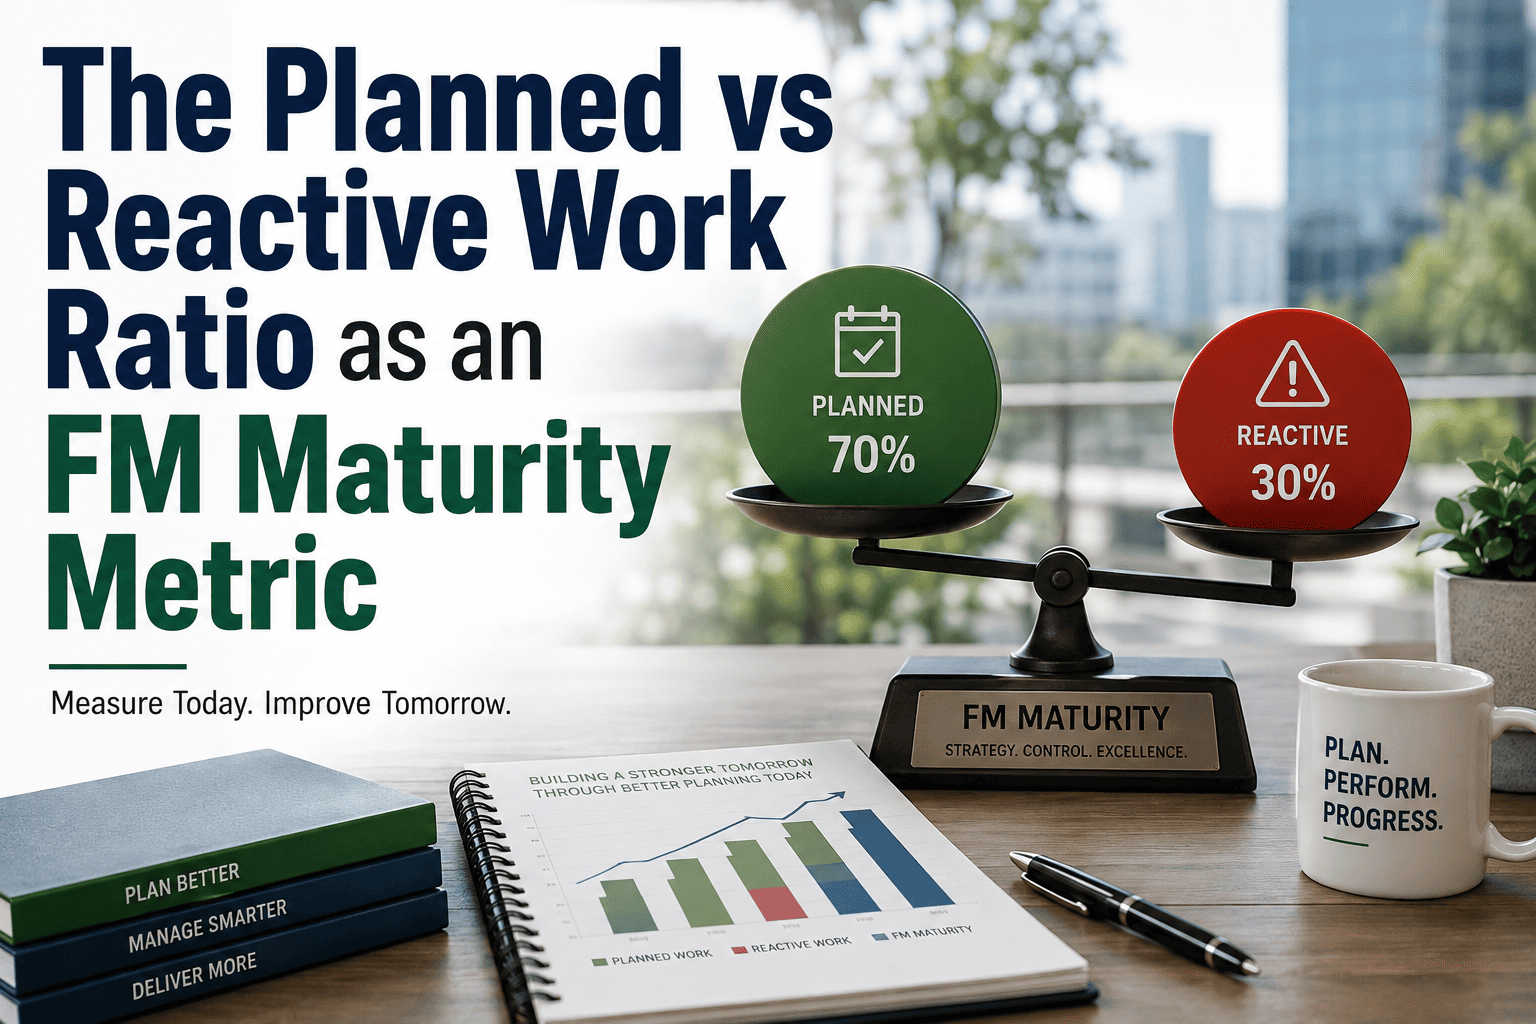
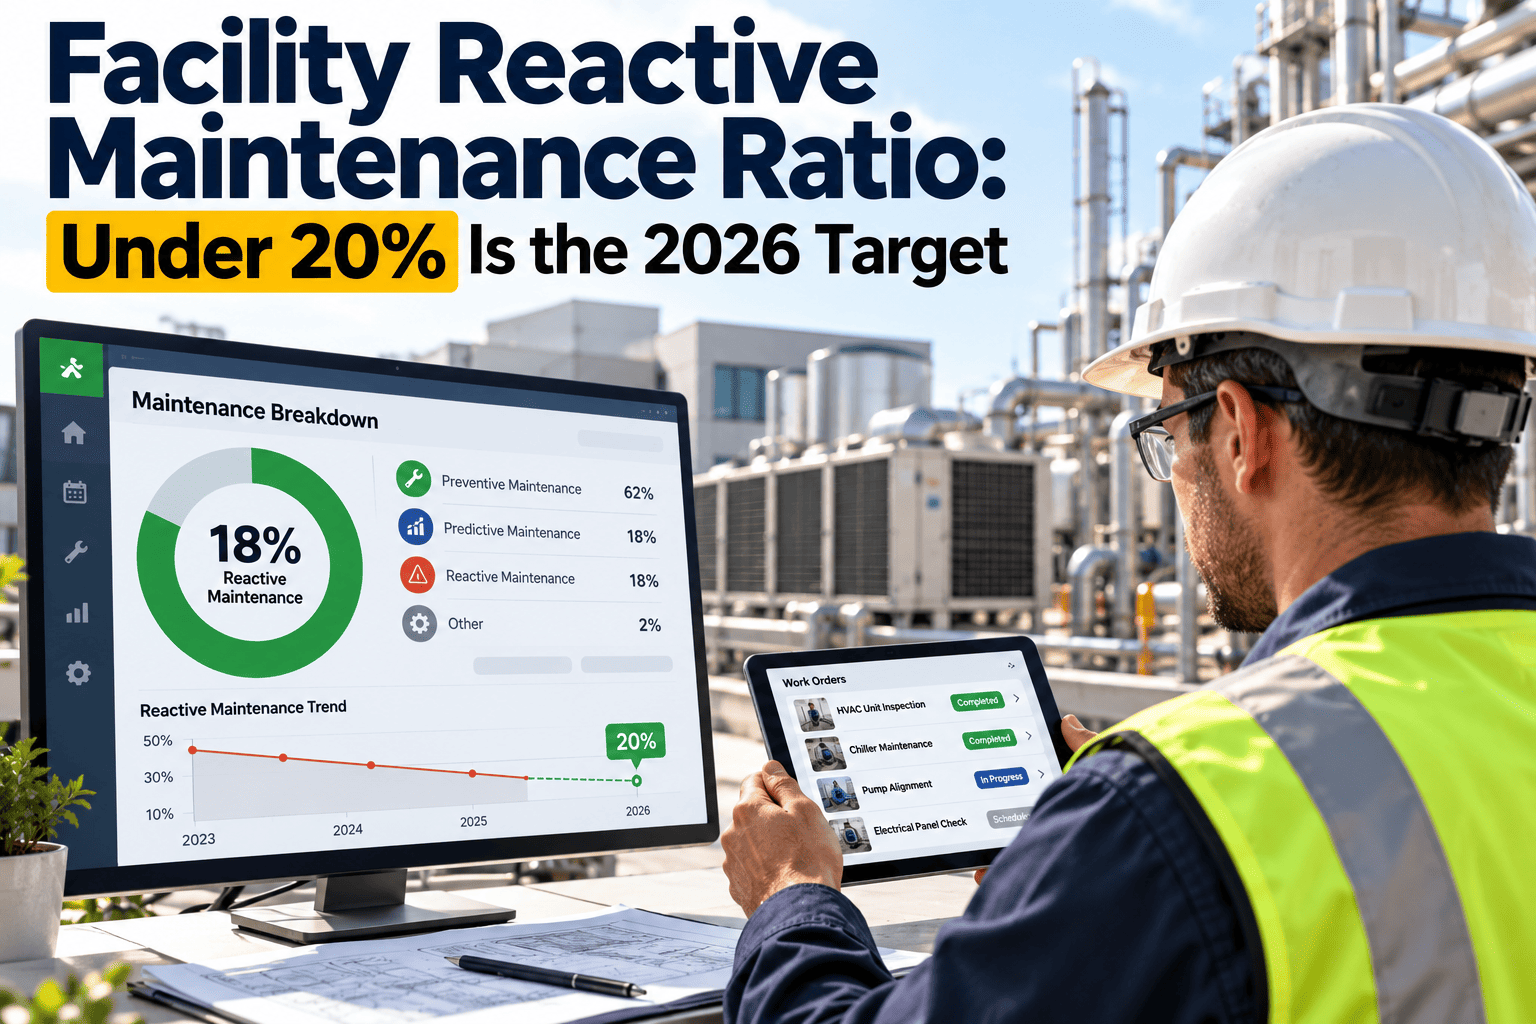
The planned vs reactive work ratio is widely regarded as the single most honest indicator of facility maintenance maturity — far more revealing than any internal survey or self-assessment. World-class FM portfolios consistently operate at an 80:20 planned-to-reactive split or better, while organisations still trapped in firefighting mode often see 60% or more of their labour consumed by unplanned breakdowns. This guide breaks down how to measure the planned reactive work ratio as an FM maturity metric, benchmark it against industry standards, and systematically shift the balance toward planned-work-dominant operations using modern CMMS capabilities. If your team is ready to move beyond spreadsheets and reactive chaos, you can Start Free Trial and see the shift in weeks, not quarters.
FM MATURITY METRIC
Is 60% of your maintenance labour going to unplanned breakdowns?
The planned-to-reactive ratio reveals the true maturity of your facility operations — and it shifts the moment work orders, PM schedules and asset data live in one system. Most FM teams underestimate their reactive load by 20–30% because they never measure it.
World-class planned-to-reactive ratio target for facility portfolios
MEASUREMENT
How to calculate the planned-to-reactive ratio for facility maintenance
The planned reactive work ratio FM teams should track compares labour hours (or work order counts) spent on planned tasks against those consumed by unplanned, reactive events over the same period. The formula is straightforward, but the discipline of categorising every work order correctly is what separates accurate measurement from guesswork.
THE FORMULA
Planned % = (Planned Labour Hours ÷ Total Labour Hours) × 100
Reactive % = 100 − Planned % | Express the result as a ratio, e.g. 70:30
Counts as PLANNED work
Scheduled preventive maintenance (PM) tasks
Predictive maintenance triggered by condition data
Planned shutdown / turnaround work
Corrective work identified during an inspection and scheduled
Calibration and statutory compliance checks
Counts as REACTIVE work
Unplanned breakdown repairs
Emergency call-outs and safety stoppages
"While you're here" add-on repairs outside the PM plan
Tenant complaints with no prior work order
Corrective work deferred until failure occurred
A common pitfall is counting only breakdown work orders as reactive while ignoring undocumented "quick fixes" that never enter the system. OxMaint enforces work-order categorisation at creation — every request is tagged planned or reactive automatically — so your facility planned reactive ratio reflects reality, not aspiration.
BENCHMARKS
What is a good planned reactive ratio in facility maintenance?
Industry benchmarks from SMRP, IFMA and maintenance consulting studies place world-class facility portfolios at or above 80% planned work. Most organisations sit between 45% and 65% planned without realising it, because they benchmark against their own history rather than external standards.
Maturity Level
Planned : Reactive
Typical Characteristics
Approx. Maintenance Cost Premium
Reactive (Chaotic)
20 : 80
Run-to-failure, no PM schedule, paper-based tracking
+40–60% over baseline
Emerging
40 : 60
Some PMs exist but compliance is under 50%
+25–35%
Proactive
60 : 40
Structured PM calendar, basic CMMS in use
+10–15%
Optimised
75 : 25
Predictive triggers, high PM compliance (>90%)
+0–5%
World-Class
80 : 20 or better
Continuous improvement, RCM-driven, AI predictive
Baseline (lowest)
WORKED EXAMPLE
A 180-asset commercial facility spending $42K/yr on maintenance labour tracked their work orders for a quarter and discovered a 45:55 planned-to-reactive split. Emergency call-out labour alone cost $18.5K — nearly 44% of the total budget. After implementing structured PM schedules and automated work-order categorisation through OxMaint, within six months the ratio moved to 68:32, cutting unplanned labour spend by $11.2K annually and reducing tenant-reported faults by 38%.
ROOT CAUSES
Why facility teams get stuck in reactive maintenance
The forces that keep the reactive planned ratio maintenance imbalance alive are operational, cultural and technological. Identifying which of these dominates in your organisation is the first step toward shifting the metric.
01
No centralised asset register
Without a single source of truth for asset criticality, location and service history, PM scheduling is guesswork and critical equipment fails between inspections.
02
PM compliance below 70%
When scheduled PMs are routinely deferred or skipped, small defects become breakdowns — and the team is forced back into reactive mode, abandoning the plan again.
03
Spreadsheets and paper work orders
Manual tracking means no real-time visibility, no automatic escalations, and no data to identify which assets are draining reactive labour month after month.
04
No condition-based triggers
Time-based PMs alone can't predict bearing failure or refrigerant loss. Without IoT or meter-based triggers, the first sign of trouble is the breakdown call.
05
Spare parts not linked to assets
Reactive work takes 2–3x longer when technicians can't find the right part. Untracked inventory turns a 30-minute fix into a half-day chase across multiple stores.
06
Tenant requests bypass the system
When complaints come in by phone or email and never become work orders, the reactive load is invisible in reporting — and impossible to manage proactively.
ROADMAP
How to shift the planned vs reactive ratio — a 6-month timeline
Moving from a 40:60 split to 70:30 or better doesn't happen overnight, but a disciplined sequence — enabled by the right CMMS — delivers measurable progress within two quarters for most facility portfolios.
MONTH 1
Baseline & categorise
Audit all work orders from the past 90 days, tag each as planned or reactive, and establish your true starting ratio. Most teams are shocked by the real number.
MONTH 2
Build the asset register
Import every asset with criticality rating, location and service history into OxMaint. Assign PM templates based on OEM recommendations and failure history.
MONTH 3
Automate PM scheduling
Turn on calendar- and meter-based PM triggers. Technicians receive work orders on mobile devices with checklists, parts and instructions attached.
MONTH 4
Link inventory to assets
Map spare parts to asset BOMs. Set min/max reorder points so critical spares are always in stock — cutting reactive repair time by 40%+.
MONTH 5
Enable predictive triggers
Connect condition-monitoring data — vibration, temperature, run-hours — to OxMaint's predictive analytics. Work orders generate automatically when thresholds breach.
MONTH 6
Measure & iterate
Re-measure the ratio. Review PM compliance, mean time to repair and top recurring failure modes. Adjust PM frequencies and retire tasks that add no value.
Stop guessing your ratio — start measuring it automatically
See how OxMaint tags every work order, tracks PM compliance and surfaces your true planned-to-reactive split in real-time dashboards.
How OxMaint shifts your planned reactive balance — measurably
OxMaint is an AI-powered CMMS and EAM platform built specifically to move facility teams from reactive firefighting to planned-work-dominant operations. Every capability below maps directly to a lever that shifts the ratio.
Automated PM scheduling & compliance tracking
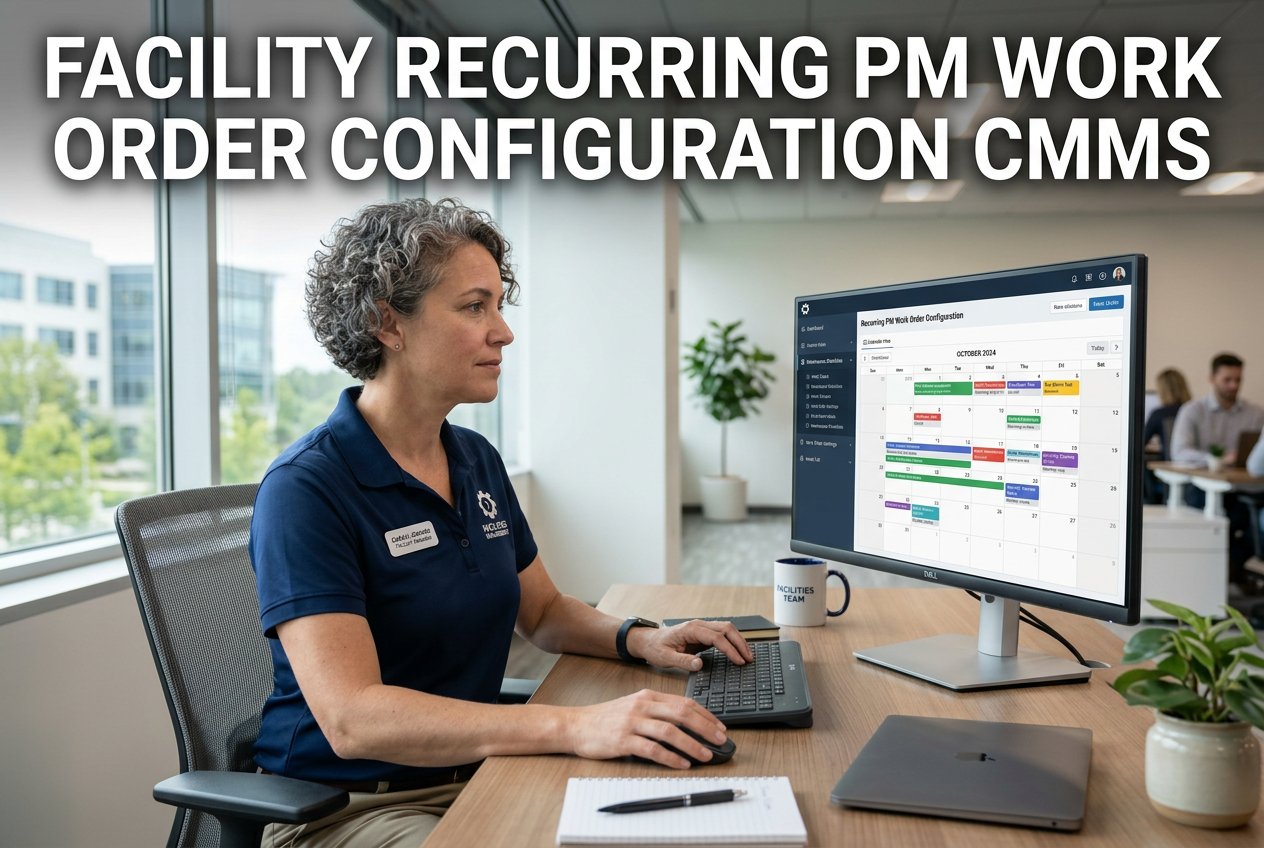
Calendar- and meter-based PMs auto-generate work orders with checklists, parts and SOPs. Compliance dashboards flag missed PMs in real time, helping teams sustain 90%+ completion rates and pushing the planned work percentage facility-wide.
Outcome: +15–25% planned work share in one quarter
AI-powered predictive maintenance triggers
OxMaint's predictive engine analyses run-hours, vibration, temperature and pressure data to flag asset degradation before failure. Work orders generate automatically — converting would-be breakdowns into scheduled interventions.
Outcome: Cut unplanned downtime 30–50%
Spare-parts inventory linked to asset BOMs
Every asset carries its bill of materials. Min/max reorder points auto-trigger purchase requests, so the right part is always in stock — cutting reactive repair time and eliminating the "hunt for spares" that derails planned schedules.
Outcome: 40% faster MTTR on reactive repairs
Real-time FM maturity dashboards
Live dashboards display your planned-to-reactive ratio, PM compliance, MTTR and top failure contributors — updated with every closed work order. No more quarterly spreadsheets; the metric is always current and audit-ready.
Outcome: Full visibility, zero manual reporting
FAQ
Planned vs reactive work ratio — common questions
What is the ideal planned-to-reactive ratio for facility maintenance?
The industry benchmark for world-class facility maintenance is 80:20 or better — meaning at least 80% of maintenance labour is planned and no more than 20% is reactive. Most organisations operate between 50:50 and 65:35 without realising it. Measuring the ratio accurately through a CMMS like OxMaint is the first step to closing that gap.
How do you measure the planned reactive work ratio in FM?
Divide planned labour hours by total labour hours and multiply by 100 to get your planned percentage; the remainder is reactive. Count all work orders — including undocumented "quick fixes" — and ensure each is tagged planned or reactive at creation. OxMaint automates this tagging so the ratio reflects reality, not aspiration. You can Start Free Trial to begin tracking immediately.
Why is the planned-to-reactive ratio considered an FM maturity metric?
Unlike self-reported surveys, the ratio is derived from actual work-order data — making it an objective, hard-to-game indicator of how disciplined your maintenance operation really is. A high planned percentage signals structured PM programmes, good asset data and strong compliance; a low one exposes operational fragility that surveys typically miss.
How long does it take to shift from 50:50 to 70:30 planned-to-reactive?
Most facility teams see measurable movement within 3–4 months and reach a 70:30 split within 6 months when they implement automated PM scheduling, link spare parts to assets and enforce work-order categorisation. The timeline depends on asset count, existing data quality and team adoption — which is why starting with a structured onboarding demo accelerates results.
Does predictive maintenance improve the planned reactive ratio?
Yes — predictive maintenance converts potential breakdowns into scheduled interventions by detecting degradation before failure. Instead of a reactive call-out, the work is planned with parts staged and labour assigned in advance. OxMaint's AI predictive engine typically reduces unplanned downtime by 30–50% and adds 10–15 percentage points to the planned work share.
Ready to see your true ratio — and change it?
Book a 30-minute demo and we'll show you exactly how OxMaint surfaces your planned-to-reactive split, automates PM scheduling and moves your team toward world-class maintenance maturity.