Every facility has a reactive maintenance ratio, whether or not anyone measures it. It shows how much of your team's time goes to responding to breakdowns instead of preventing them. A high ratio usually means overtime, rushed parts orders, unhappy tenants, and technicians who never get ahead of the backlog. A falling ratio is one of the clearest signs that a maintenance program is maturing. This guide explains the target, the measurement method, and how an asset and work order platform helps you reduce the number every quarter.
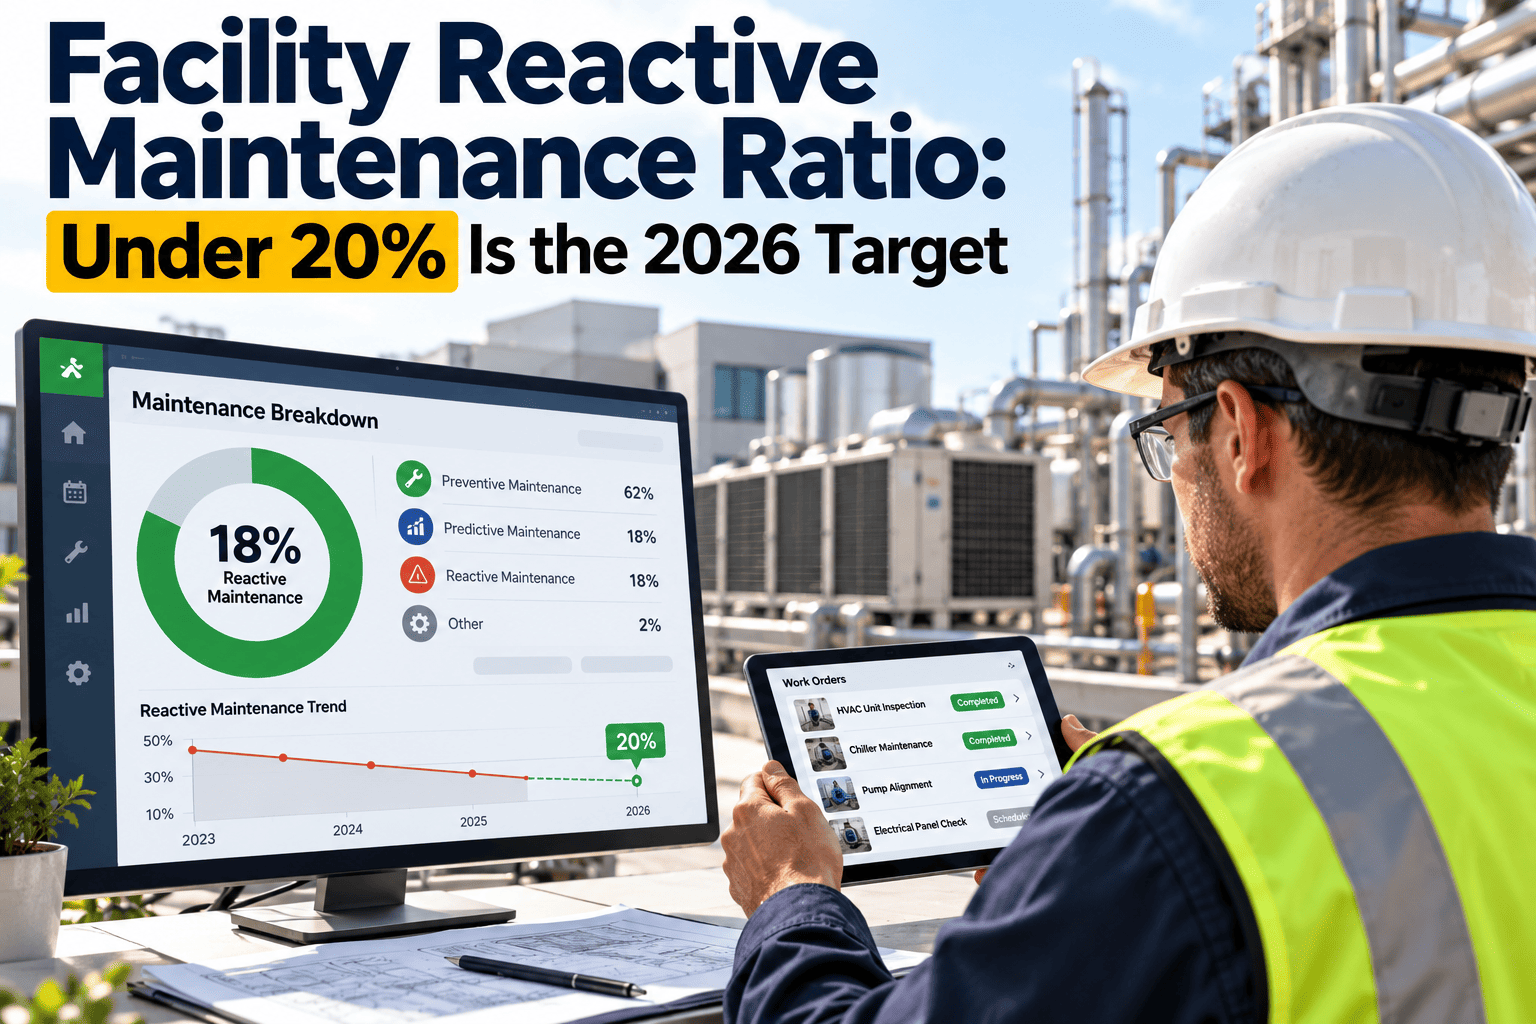
Facility Reactive Maintenance Ratio: Under 20% Is the 2026 Target
Best-in-class teams keep reactive work below one fifth of total effort. Here is how to measure it honestly and move it down.
What the ratio actually measures
Two ways to calculate it
- By work order count: simple to pull, but a quick fix and a major repair count equally.
- By labor hours: more accurate, because it reflects where technicians actually spend their time.
Why under 20% is the common target
- Industry guidance, including benchmarks associated with SMRP, commonly describes world-class operations as running most work as planned and scheduled, with reactive work held to a small minority.
- Exact thresholds vary by sector, asset criticality, and building age, so treat 20% as a direction and not a pass-or-fail line.
- A site that moves from 60% to 40% reactive has made far more progress than the headline gap to 20% suggests.
Classify work the same way every time
A ratio is only as good as the definitions behind it. Agree on categories and apply them consistently.
| Work type | Definition | Counts as |
|---|---|---|
| Emergency | Immediate safety, outage, or severe damage response | Reactive |
| Breakdown | Failure found after loss of function, repaired as soon as possible | Reactive |
| Urgent corrective | Problem found in service that cannot wait for the next planned window | Reactive |
| Planned corrective | Defect found early, then planned, kitted, and scheduled | Planned |
| Preventive maintenance | Time-based or usage-based routine tasks | Planned |
| Predictive or condition-based | Work triggered by measured condition | Planned |
| Project or improvement | Upgrades and capital tasks | Usually tracked separately |
Rule of thumb for edge cases
- If the work was not on a schedule before the day it was done, treat it as reactive.
- If a technician found a defect during a preventive task and it was scheduled properly, treat the repair as planned corrective.
Maturity ladder: where does your team sit?
Use the ladder carefully
- Segment the ratio by asset class, because HVAC, electrical, and building fabric often sit on different rungs.
- Report the ratio for critical assets separately from non-critical ones.
Why facility reactive work stays high
People and process
- No dedicated planner, so technicians plan their own jobs on the fly
- Work requests accepted without triage or priority rules
- Preventive tasks pushed aside whenever breakdowns arrive
Assets and data
- Incomplete asset register, so some equipment gets no preventive work
- Generic preventive tasks that do not match actual failure modes
- No failure codes, so repeat problems stay invisible
Parts and access
- Critical spares not stocked, turning small faults into long outages
- Planned jobs delayed because parts or permits are not ready
- Limited shutdown windows for critical systems
Budget and culture
- Repair spending approved faster than preventive spending
- Heroic emergency fixes rewarded more than quiet prevention
- Deferred maintenance on older buildings compounding over time
The operational cost of a high reactive ratio
Reactive work costs more than the repair itself. Several hidden costs sit behind each emergency call.
Reactive pattern
- Overtime and call-out premiums
- Expedited freight and premium parts pricing
- Collateral damage when a small leak or fault escalates
- Tenant or occupant disruption and complaints
- Technicians interrupted mid-task, reducing productivity
Planned pattern
- Work scheduled in normal hours
- Parts kitted and delivered ahead of the job
- Small defects fixed before they spread
- Planned outages communicated in advance
- Technicians complete jobs without interruption
Measure your own cost gap
- Compare the average cost per work order for reactive and planned jobs on the same asset class.
- Include labor, parts, contractor charges, and any downtime cost you can document.
- Avoid quoting generic multipliers in reports; your own data is more persuasive.
Worked example: calculating the ratio from labor hours
The figures below are illustrative only. Use them to check your method, not as a benchmark for your site.
| Work category | Hours in the month | Share of total |
|---|---|---|
| Emergency and breakdown | 180 | 22.5% |
| Urgent corrective | 120 | 15.0% |
| Planned corrective | 160 | 20.0% |
| Preventive maintenance | 300 | 37.5% |
| Condition-based inspections | 40 | 5.0% |
Reading the result
- Reactive hours: 180 + 120 = 300 out of 800 total, which gives a ratio of 37.5%.
- Planned hours make up the remaining 62.5%, placing this team on the third rung of the ladder.
- To reach 20%, reactive hours would need to fall to about 160 on the same total workload.
What to do with it
- Break the 300 reactive hours down by asset class and failure code.
- Identify the three biggest contributors and decide which preventive or inspection tasks would have caught them.
What a good ratio looks like in different facility types
Commercial offices
- Reactive work often centers on HVAC comfort calls and lighting
- Tenant request triage has a large effect on the ratio
- Planned filter, belt, and coil work reduces repeat complaints
Hospitals and care facilities
- Life-safety and critical systems need strict planned inspection
- Limited shutdown windows push work into night shifts
- Compliance records and response times are scrutinized
Retail and hospitality
- Customer-facing failures such as refrigeration and doors create urgent calls
- Multi-site comparison helps spot weak locations
- Contractor management affects both response and cost
Industrial and warehouse sites
- Dock equipment, conveyors, and compressors drive reactive load
- Production schedules limit when planned work can happen
- Condition monitoring pays back fastest on critical rotating equipment
Set targets that fit your context
- Agree on a target by asset class with operations leaders rather than adopting one number for everything.
- Review targets yearly as assets age, scope grows, or new systems are installed.
Governance: who owns the number
| Role | Responsibility for the ratio | Review cadence |
|---|---|---|
| Technician | Records accurate work type, time, and failure cause on every job | Every job |
| Planner or scheduler | Converts findings into planned jobs and protects the weekly schedule | Weekly |
| Maintenance supervisor | Reviews reactive jobs and assigns follow-up actions | Weekly |
| Facility manager | Owns the target, budget, and reporting to leadership | Monthly |
| Finance or operations lead | Challenges the cost impact and supports investment in prevention | Quarterly |
Meeting structure that works
- Keep the weekly review to thirty minutes and focus on the top five reactive jobs.
- Ask for each: what failed, why, and what task would stop it from happening again.
- Record the decision and the person responsible in the work order.
- Escalate any asset that appears in the top five reactive list for two months in a row.
- Share the trend chart with technicians so they see the effect of their recorded data.
Compliance and audit angle
A low reactive ratio is also easier to defend in an audit, because planned work leaves a clear paper trail.
| Evidence auditors ask for | Reactive-heavy site | Planned-heavy site |
|---|---|---|
| Inspection records on life-safety equipment | Gaps and late entries are common | Dated checklists with sign-off |
| Corrective action after a defect | Fixed informally, rarely documented | Linked work order with cause and closure |
| Contractor service history | Invoices stored separately | Visits recorded against each asset |
| Proof of follow-up on repeat issues | Hard to show | Failure codes and trend reports |
Records to keep consistent
- Who performed the work, when, and what was found
- Parts used and any temporary repairs left open
- Photos or readings that show the condition before and after
- Approval of any deferred work, with a review date
See your reactive ratio on a live dashboard
Classify work orders, track planned versus reactive hours, and show the trend to your leadership team.
How to measure the ratio step by step
- Define categories. Document what counts as emergency, urgent, planned corrective, and preventive.
- Require a work type on every order. No work order should close without a classification.
- Capture labor hours. Technicians record actual time, not estimates, on each job.
- Pull a monthly report. Calculate reactive hours as a share of total hours by site and asset class.
- Audit a sample. Review ten or twenty orders each month to confirm they were classified correctly.
- Trend it. Look at a rolling three-month average so one bad week does not distort the picture.
Related measures to track together
- Preventive maintenance compliance
- Backlog size in weeks of labor
- Schedule compliance for planned jobs
- Repeat failure rate by asset
- Mean time to repair
Measurement traps that make the ratio look better than it is
Interventions that lower the ratio, quarter by quarter
Baseline and triage
- Set definitions and measure the current ratio
- Introduce request triage and priority codes
- Rank assets by criticality and failure history
Prevent repeat failures
- Build or refine preventive tasks for the top failing assets
- Add failure codes to every corrective order
- Stock critical spares identified from history
Plan and schedule
- Assign planning responsibility, even part-time
- Kit parts and permits before scheduling jobs
- Protect a weekly schedule from non-urgent interruptions
Move toward condition-based work
- Add inspection routes and readings for critical equipment
- Trigger work from condition thresholds
- Run root cause reviews on every emergency
Realistic expectations
- Ratios rarely fall in a straight line; new preventive work can expose hidden defects and temporarily raise corrective volume.
- Set targets by asset class, and celebrate steady reductions instead of waiting for the final number.
Choosing the right work strategy by asset
| Asset situation | Suggested strategy | Example |
|---|---|---|
| Critical, failure is costly or unsafe | Preventive plus condition-based monitoring | Chillers, generators, fire pumps |
| Important, failure is disruptive but manageable | Preventive on a sensible interval | Air handlers, elevators, boilers |
| Low criticality, cheap to replace | Run to failure by choice | Standard light fixtures, simple fans |
| Aging asset with repeat failures | Root cause analysis, then repair or replace | Old valves, worn motors |
Why run-to-failure can still be planned
- Choosing to run a low-risk asset to failure is a decision, and spares and procedures can be prepared in advance.
- Unplanned failures on critical assets are what you are trying to remove from the reactive count.
How Oxmaint supports a lower reactive ratio
A simple weekly routine
- Review last week's reactive jobs and tag a likely cause for each.
- Convert recurring causes into new preventive tasks or inspection items.
- Check that next week's planned jobs have parts, permits, and access arranged.
Signals the program is working
- Emergency calls on the same asset stop repeating within a quarter.
- Technicians finish scheduled jobs without being pulled away for urgent requests.
- Overtime hours and expedited parts orders fall month over month.
- Leadership reviews the ratio trend alongside budget and tenant satisfaction results.
Reactive maintenance ratio FAQs
What is a good reactive maintenance ratio?
Many leading teams aim for under 20% reactive, measured by labor hours. Your starting point and asset mix affect the pace of improvement.
Should I measure by work orders or hours?
Hours are more accurate because they show where effort goes. Counts are a useful starting point if time is not yet recorded.
Does more preventive maintenance always lower the ratio?
Only if tasks target real failure modes and are completed on time. Tracking compliance helps confirm that.
How long does it take to get below 20%?
Most sites need several quarters of steady work. Starting with a clean baseline makes the path easier to plan.
Can software calculate the ratio automatically?
Yes, if work types and hours are recorded on each order. A short demo shows the reports.
Make next quarter less reactive than this one
Measure the ratio honestly, plan the work that prevents repeat failures, and watch the trend improve with every cycle.