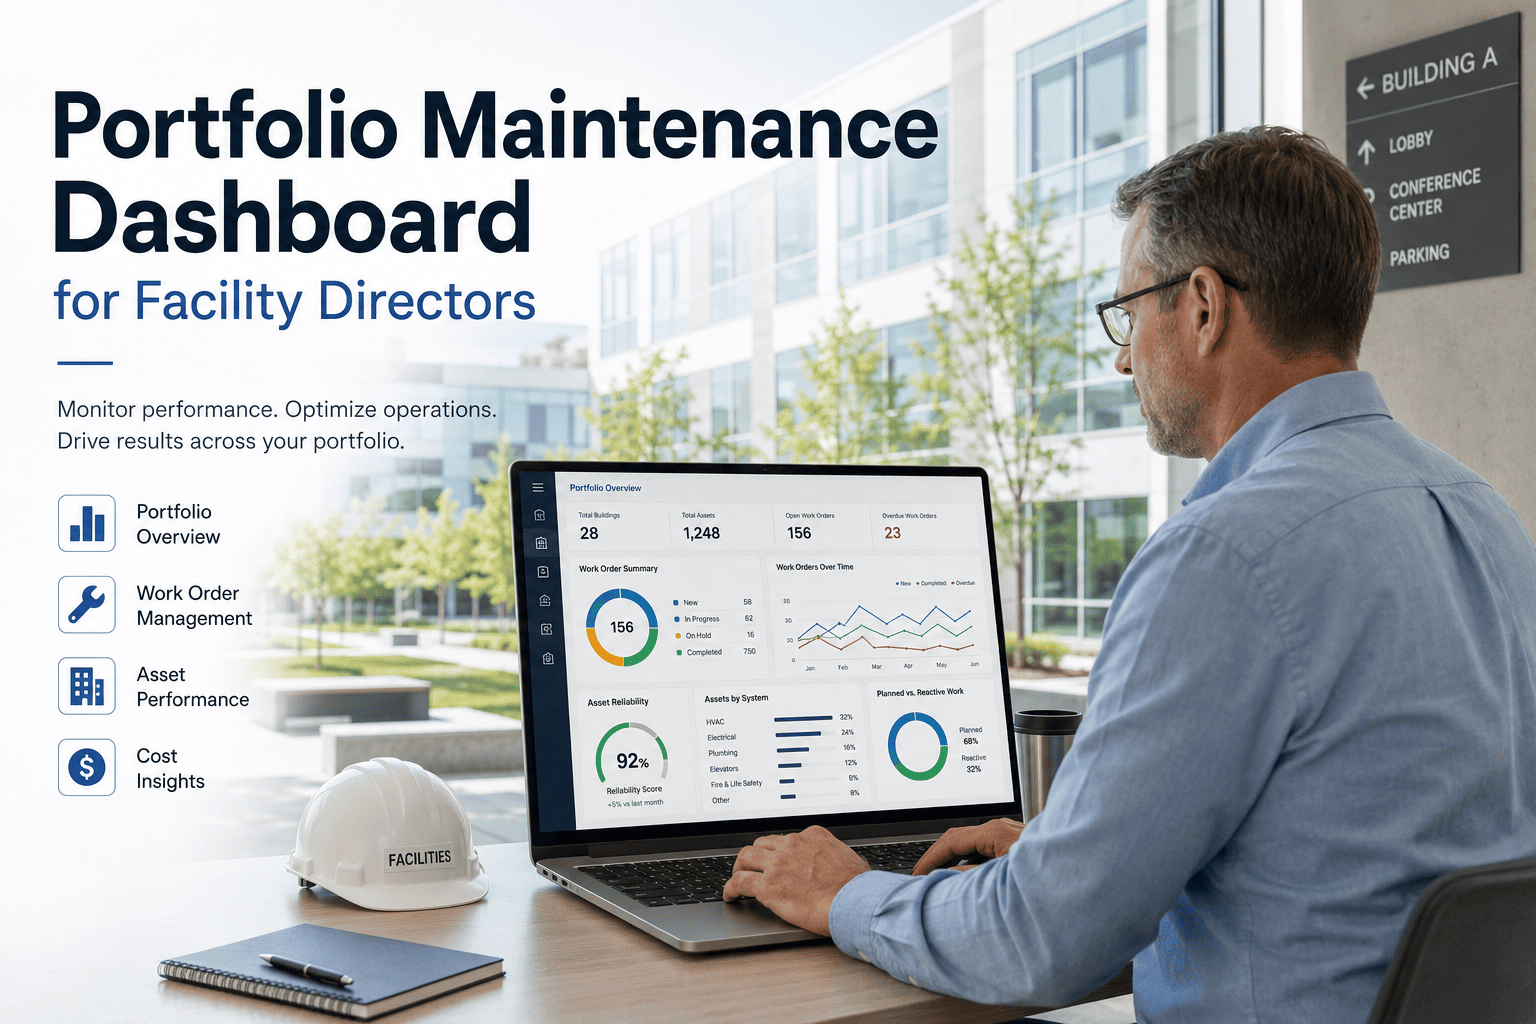
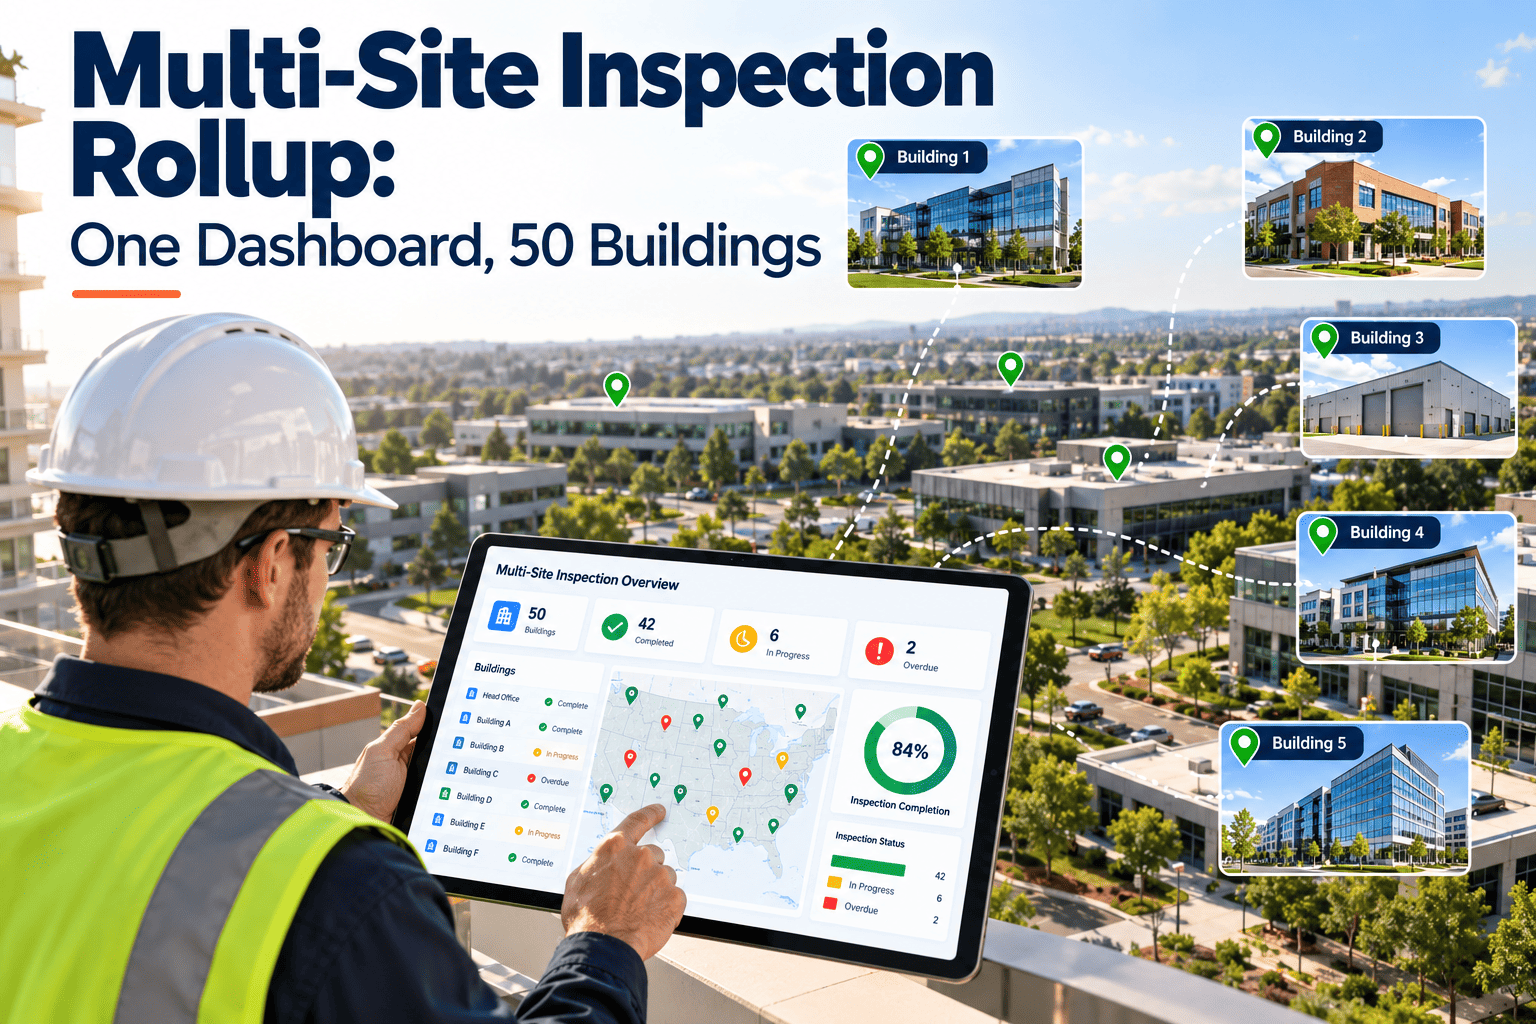
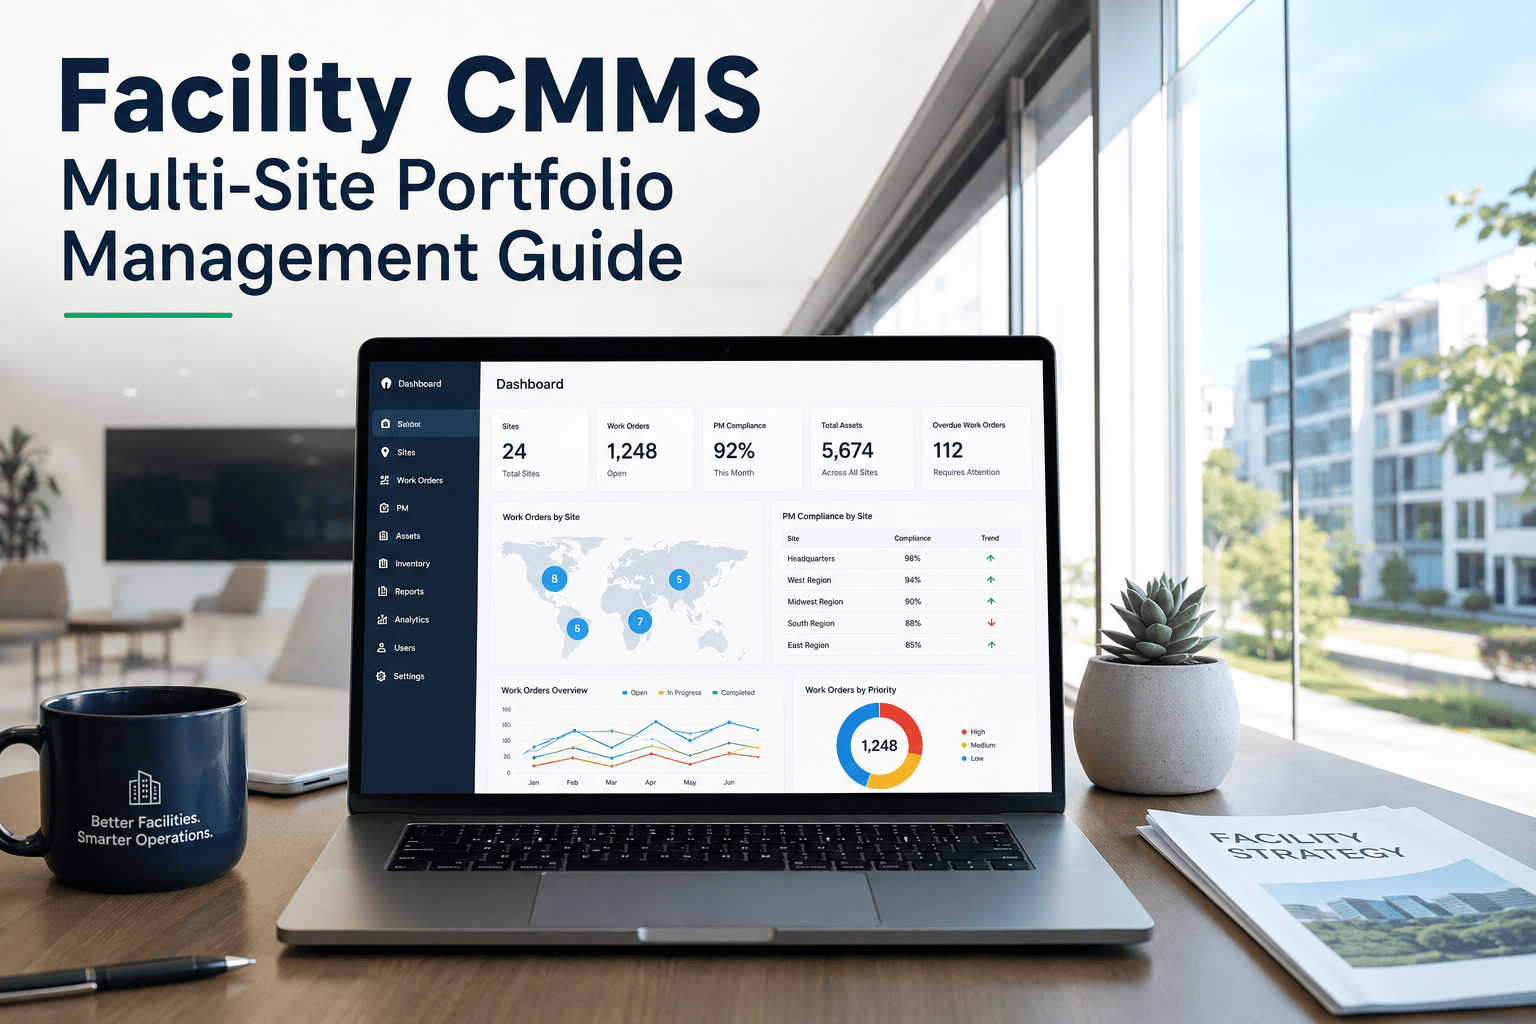
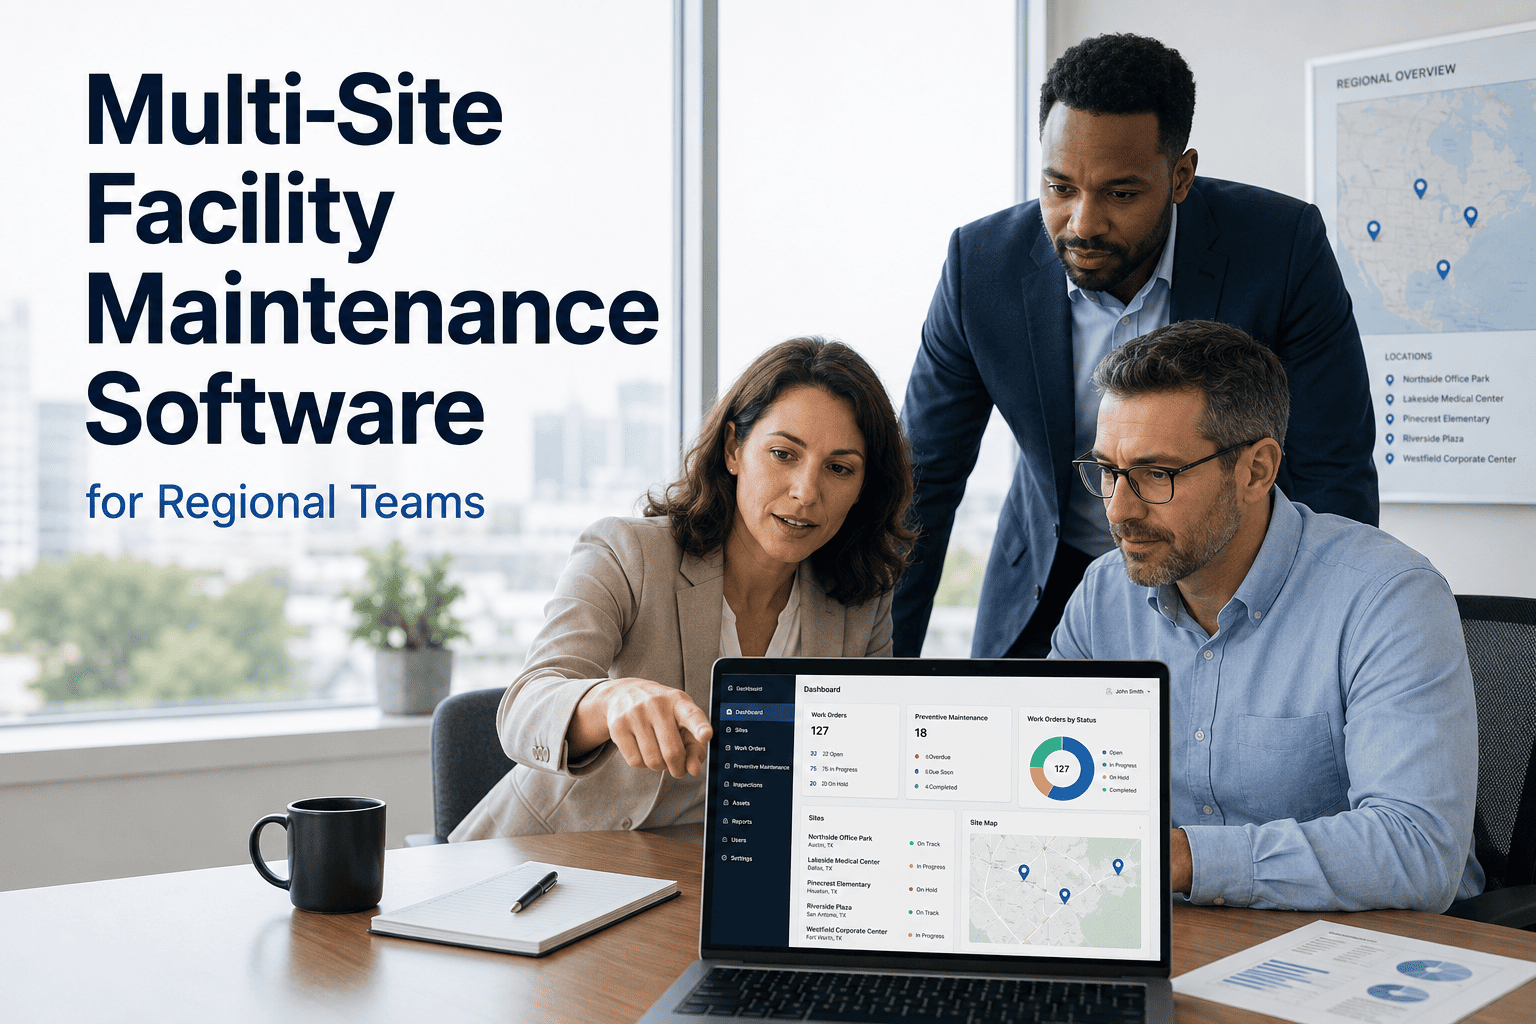
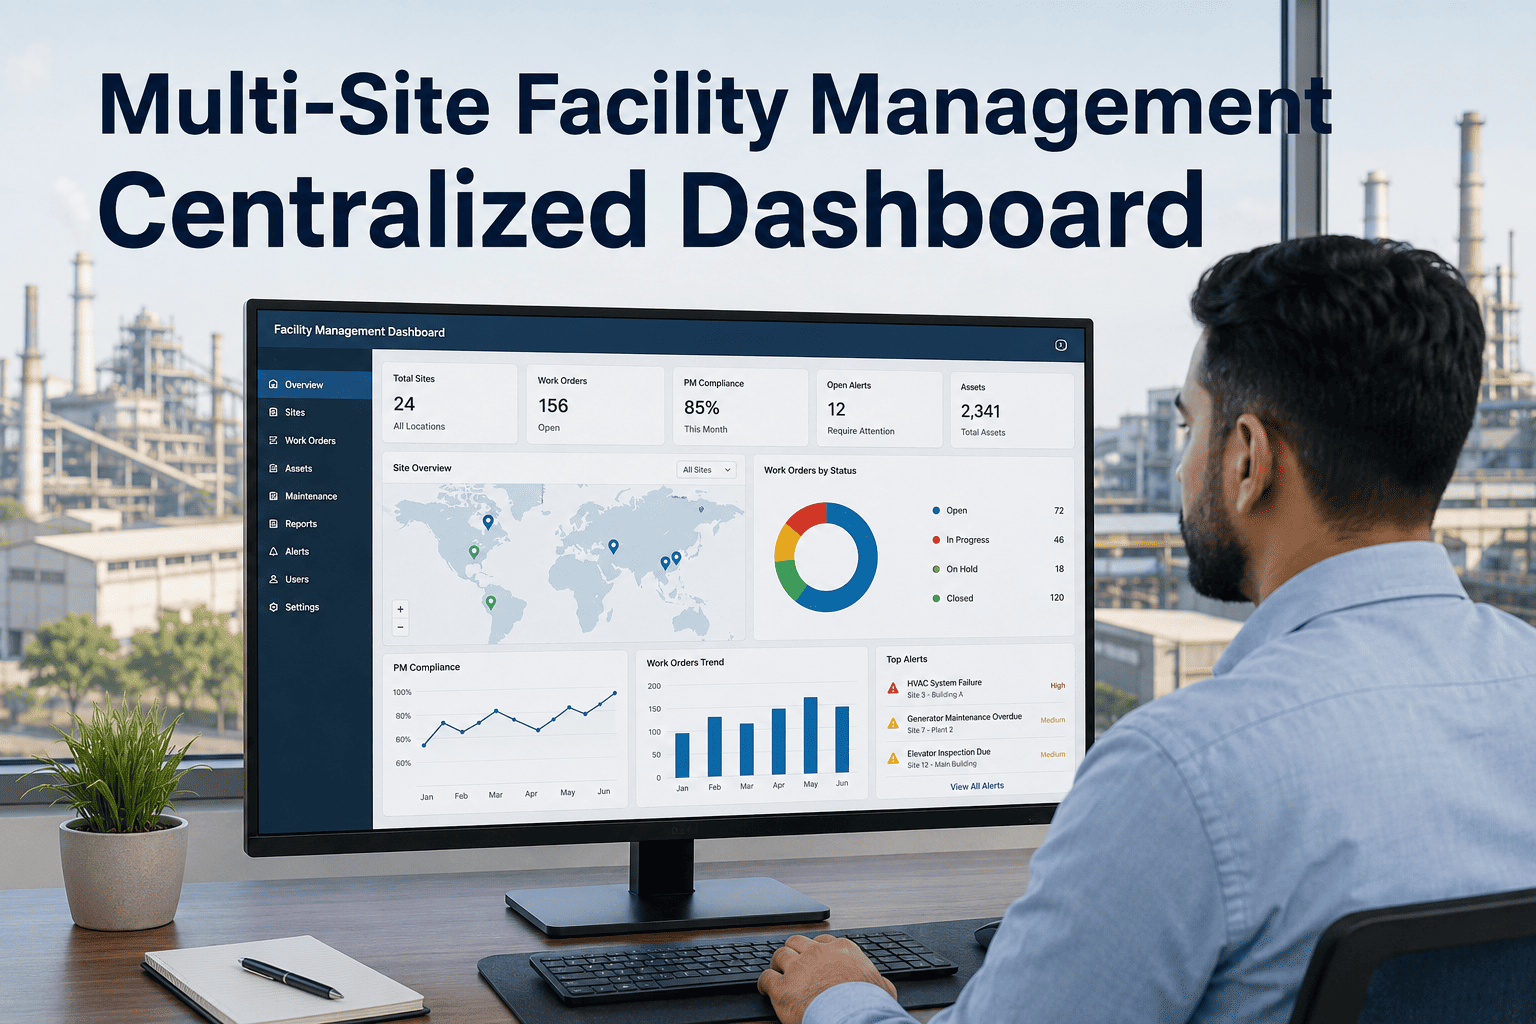
A facility director responsible for a dozen buildings doesn't have time to call a dozen site managers before a Monday morning review. Without a single view across the portfolio, the question of which building needs attention this week gets answered by whoever called last, not by the numbers. A portfolio maintenance dashboard pulls backlog, PM compliance, asset risk, cost, technician capacity, and SLA performance from every site into one screen, so a director can see exactly where the next problem is forming before a site manager has to ask for help. This page walks through how that view comes together inside OxMaint, or book a demo built around your own portfolio.
Multi-Site Operations / Portfolio Analytics
Portfolio Maintenance Dashboard for Facility Directors
Compare every building on backlog, PM compliance, asset risk, cost, technician capacity, and SLA performance — in one screen instead of twelve reports.
Total Open Backlog
100
12% vs last month
Portfolio PM Compliance
84%
6% vs last quarter
High-Risk Sites Flagged
1 of 4
Needs review this week
Avg SLA Performance
92%
3% vs last quarter
Backlog hides until someone opens twelve different reports
Every site already tracks its own numbers somewhere — a spreadsheet, a separate login, a notebook by the front desk. The work is pulling them into one comparable view without someone doing it by hand every week.
| Building |
Open Backlog |
PM Compliance |
Asset Risk |
Monthly Cost |
Tech Capacity |
SLA Performance |
| Building A |
18 |
91% |
Low |
$14,200 |
82% |
97% |
| Building B |
46 |
68% |
High |
$21,800 |
95% |
81% |
| Building C |
27 |
79% |
Medium |
$17,500 |
88% |
90% |
| Building D |
9 |
96% |
Low |
$11,900 |
74% |
99% |
Risk that's visible before it's urgent
Asset risk is rolled up from equipment age, failure history, and overdue PM tasks at each site, then scored so directors can compare buildings that otherwise have nothing in common.
LowAssets aging normally and PM tasks are on schedule.
MediumSome overdue PM or critical assets approaching end of life.
HighOverdue PM stacking up on equipment that can't fail safely.
Put your own buildings on one screen
Bring real backlog and PM numbers from your sites and we'll show you exactly how the portfolio view would look on day one.
What directors actually use it for
The dashboard isn't built for daily ticket triage — it's built for the decisions that need every site in view at once.
Weekly portfolio review
Walk into Monday's meeting already knowing which sites need a conversation, instead of waiting for one to escalate.
Budget conversations
Back capital and headcount requests with backlog and cost trends ownership can see for themselves.
Technician reallocation
Spot a site running at 95% capacity next to one running at 74% and move work before either one falls behind.
Vendor comparison
Compare contractor response times and costs across sites instead of judging each vendor in isolation.
From the portfolio view to one work order
A flagged site is never a dead end — every level of the dashboard drills into the next.
PortfolioAll buildings, ranked by risk and backlog
BuildingBacklog, compliance, and cost for one site
AssetFailure history and PM status for one unit
Work orderThe exact ticket, technician, and timeline
Expert Review
"Directors don't lose sleep over the buildings they can see clearly — they lose sleep over the ones they're not sure about. The value of a portfolio dashboard isn't the dashboard itself, it's that it turns 'I think Building B is struggling' into 'Building B's backlog is up 70% with PM compliance at 68%, here's why.' That's the difference between reacting to a site manager's phone call and walking into the conversation already prepared. Once directors trust the numbers, they stop asking for status updates and start asking better questions."
Reviewed by a Regional Facility Operations Director, overseeing maintenance across multi-building commercial portfolios for 12+ years.
See your portfolio ranked by risk, not by who called last
Walk through backlog, compliance, and SLA performance across your own buildings on a live OxMaint workspace.
Frequently asked questions
What is a portfolio maintenance dashboard?
It's a single view that compares backlog, PM compliance, asset risk, cost, and SLA performance across every building a director oversees, instead of requiring a separate report per site. It's built for comparing sites against each other, not just reporting on one. See it built around your own sites in
OxMaint.
How is asset risk calculated across buildings?
Risk is rolled up from equipment age, failure history, and how far overdue PM tasks are at each site, then scored on a consistent scale so a director can compare buildings with completely different equipment.
Book a demo to see the scoring against your assets.
Can directors drill down from the portfolio to a single work order?
Yes. Every level links to the next — portfolio to building, building to asset, asset to the specific work order, technician, and timeline behind a flagged number. Nothing on the dashboard is a dead end. Try the drill-down in
OxMaint.
How often does the dashboard update?
Figures reflect work orders, PM completions, and cost entries as they happen at each site, so the numbers a director sees Monday morning are current, not pulled together from last month's exports.
See it live in a demo.
Can it compare vendor or technician performance across sites?
Yes. Response times, completion rates, and costs can be compared by vendor or technician across every building, which makes it easier to spot a contractor underperforming at one site versus another. Explore vendor views in
OxMaint.
How long does it take to roll out across an existing portfolio?
Most portfolios are visible on the dashboard within a few weeks of connecting each site's work order and asset data, with no need to migrate historical records before getting value from current activity. Start with a
free trial.
Stop reviewing buildings one report at a time
Give your team one screen for backlog, compliance, risk, and SLA performance across every site you manage.