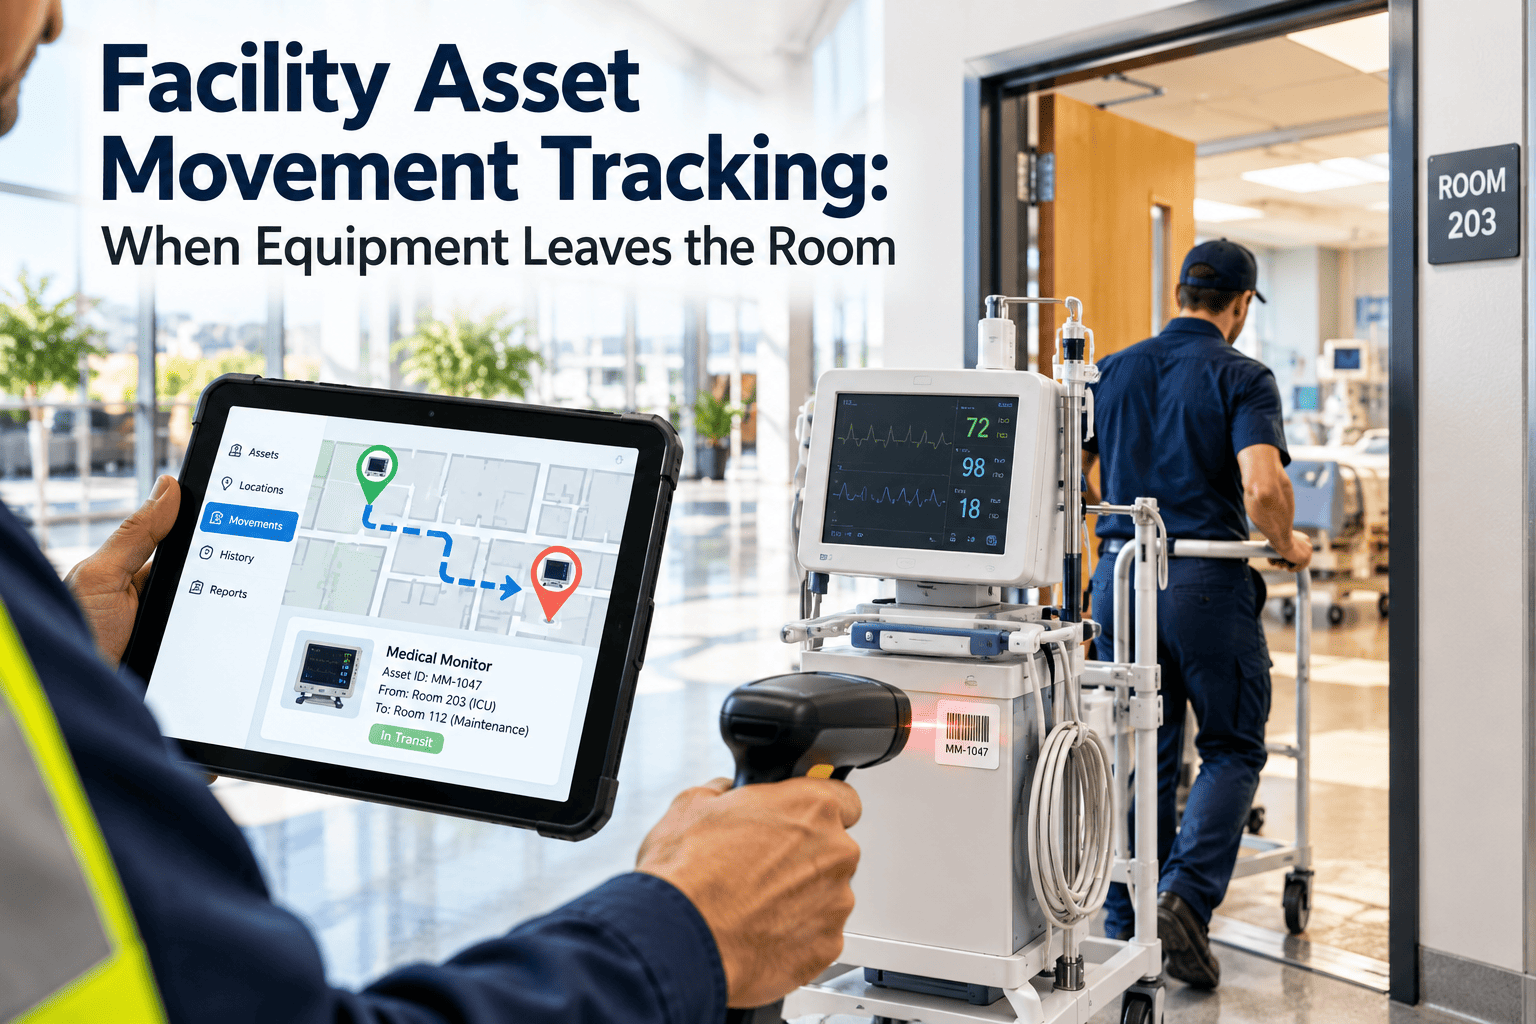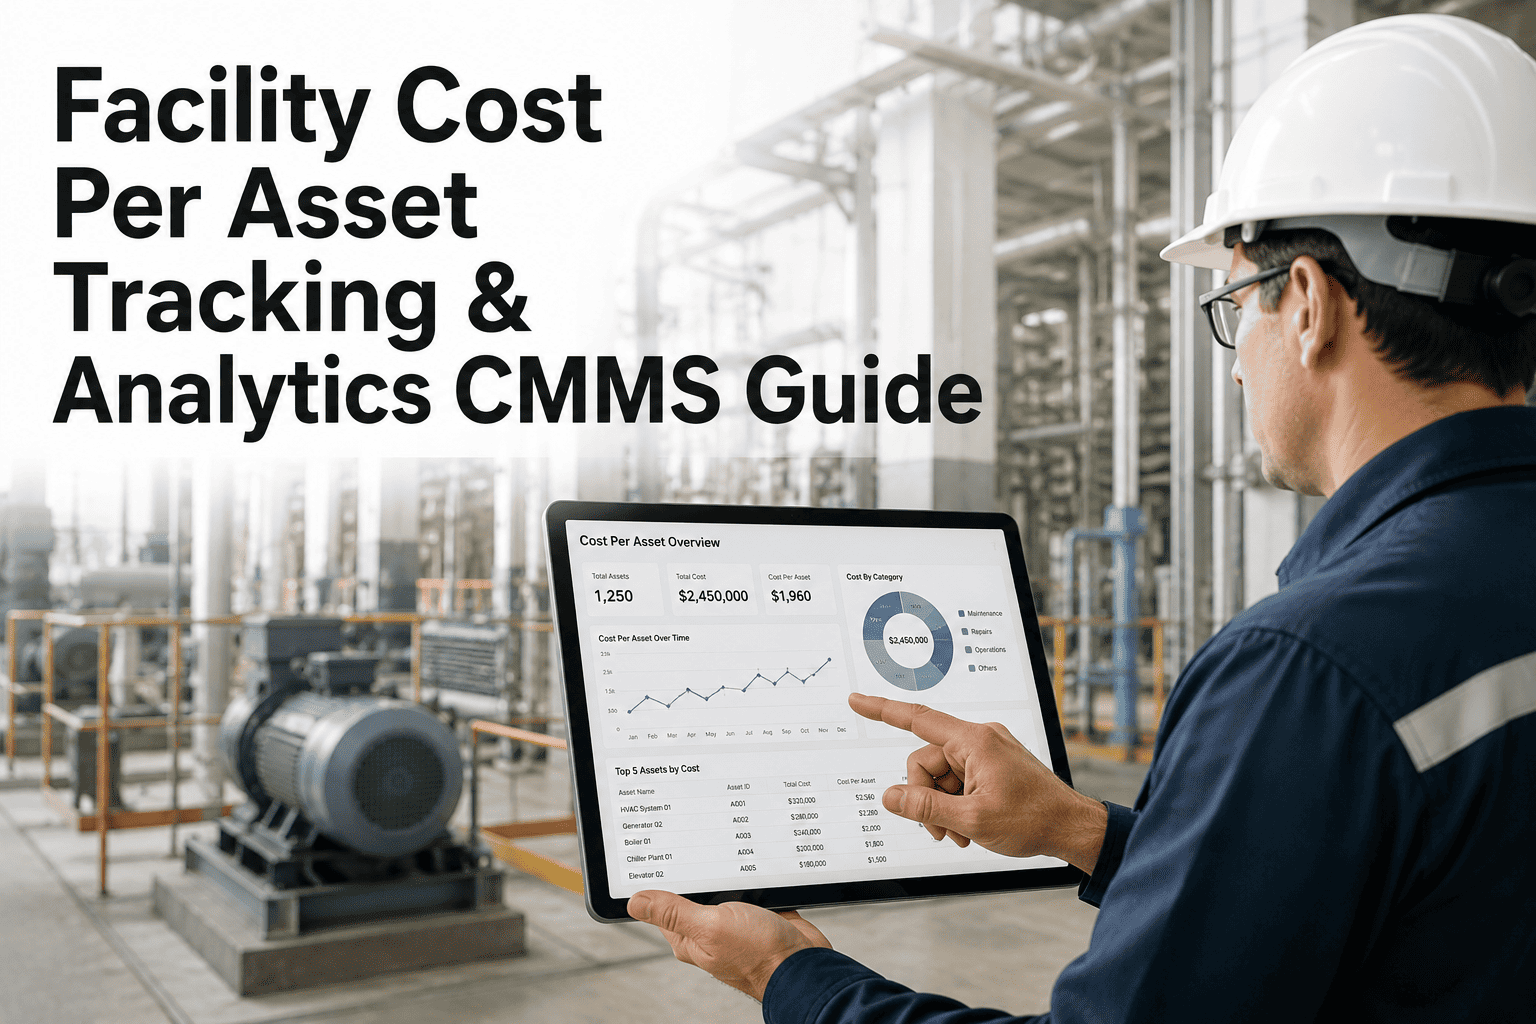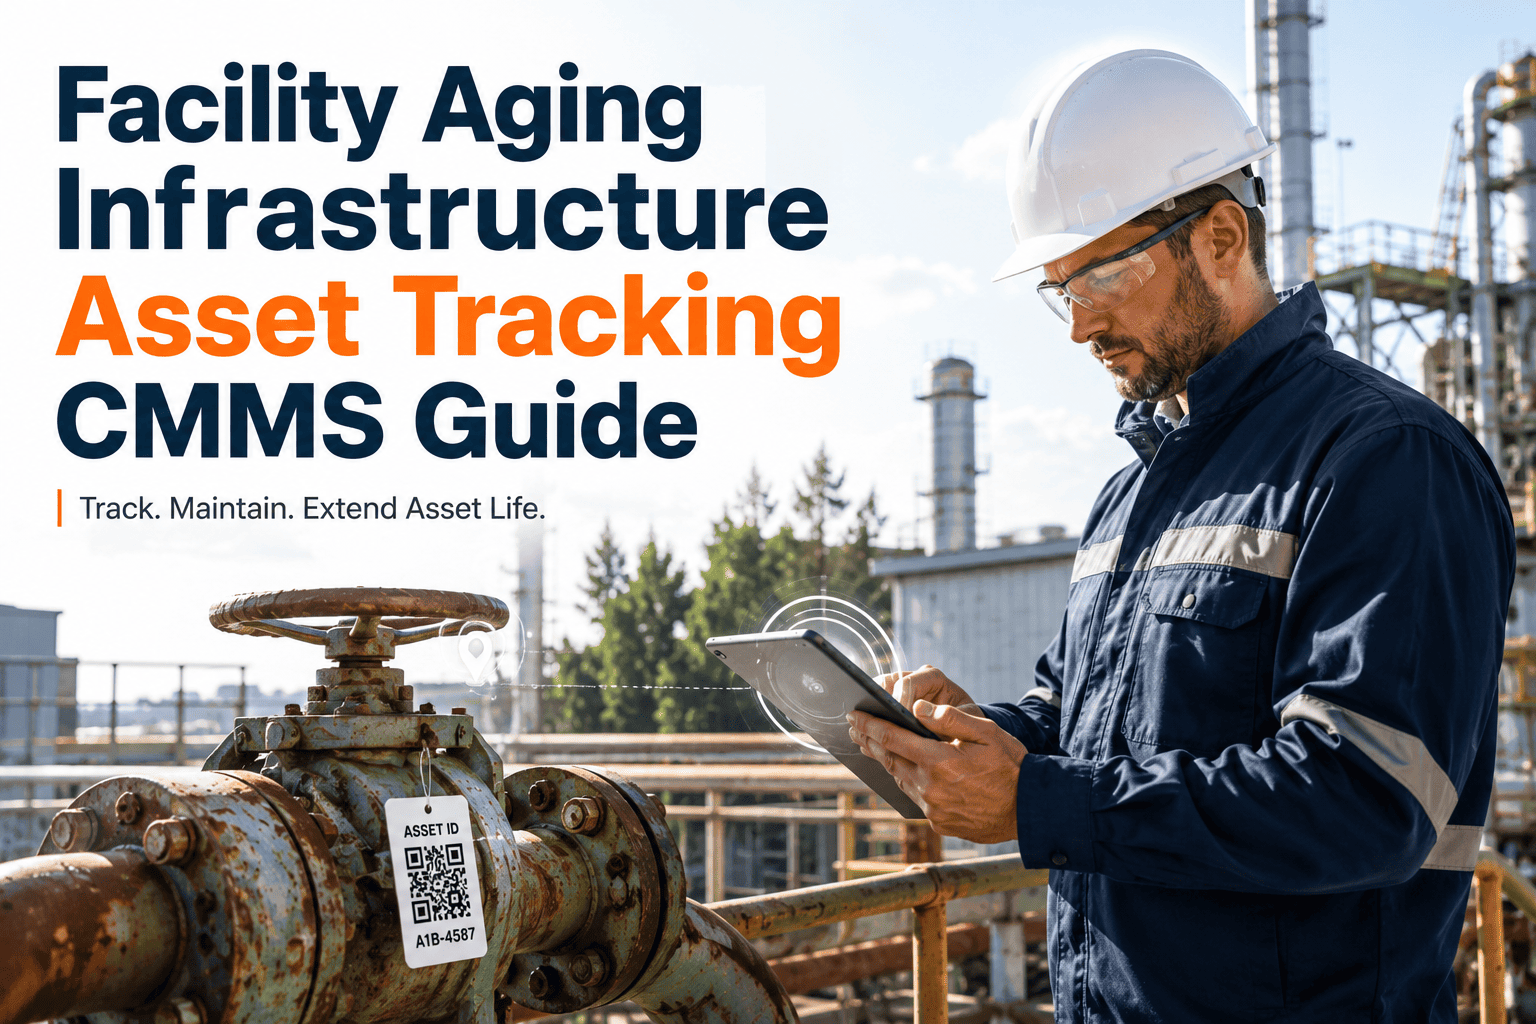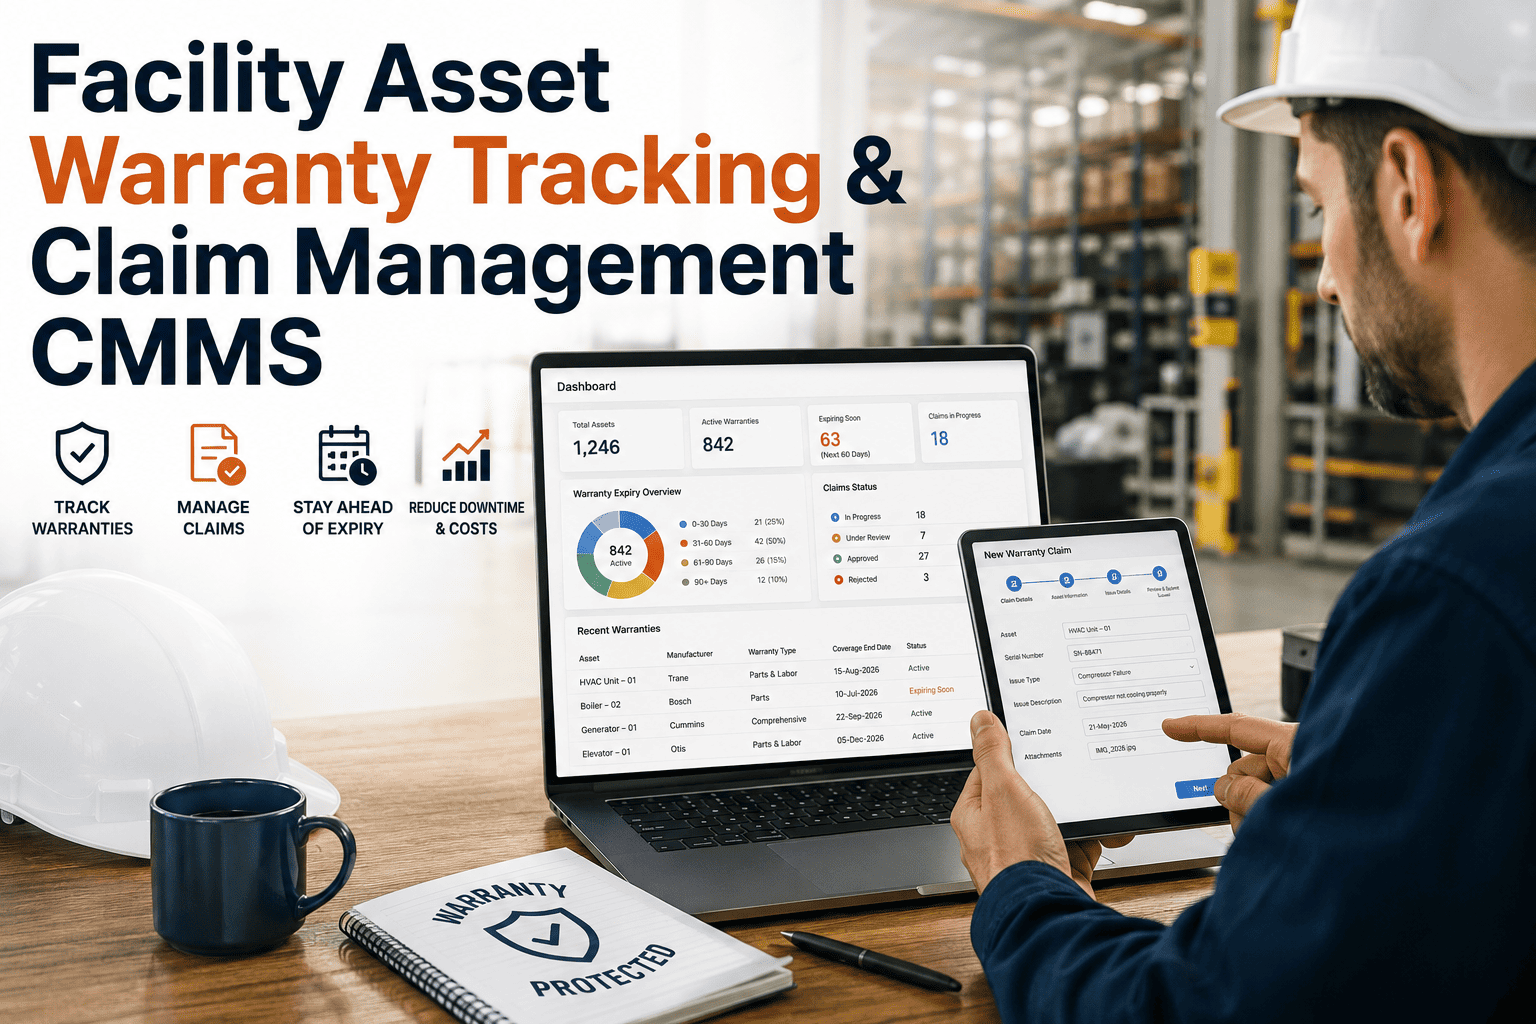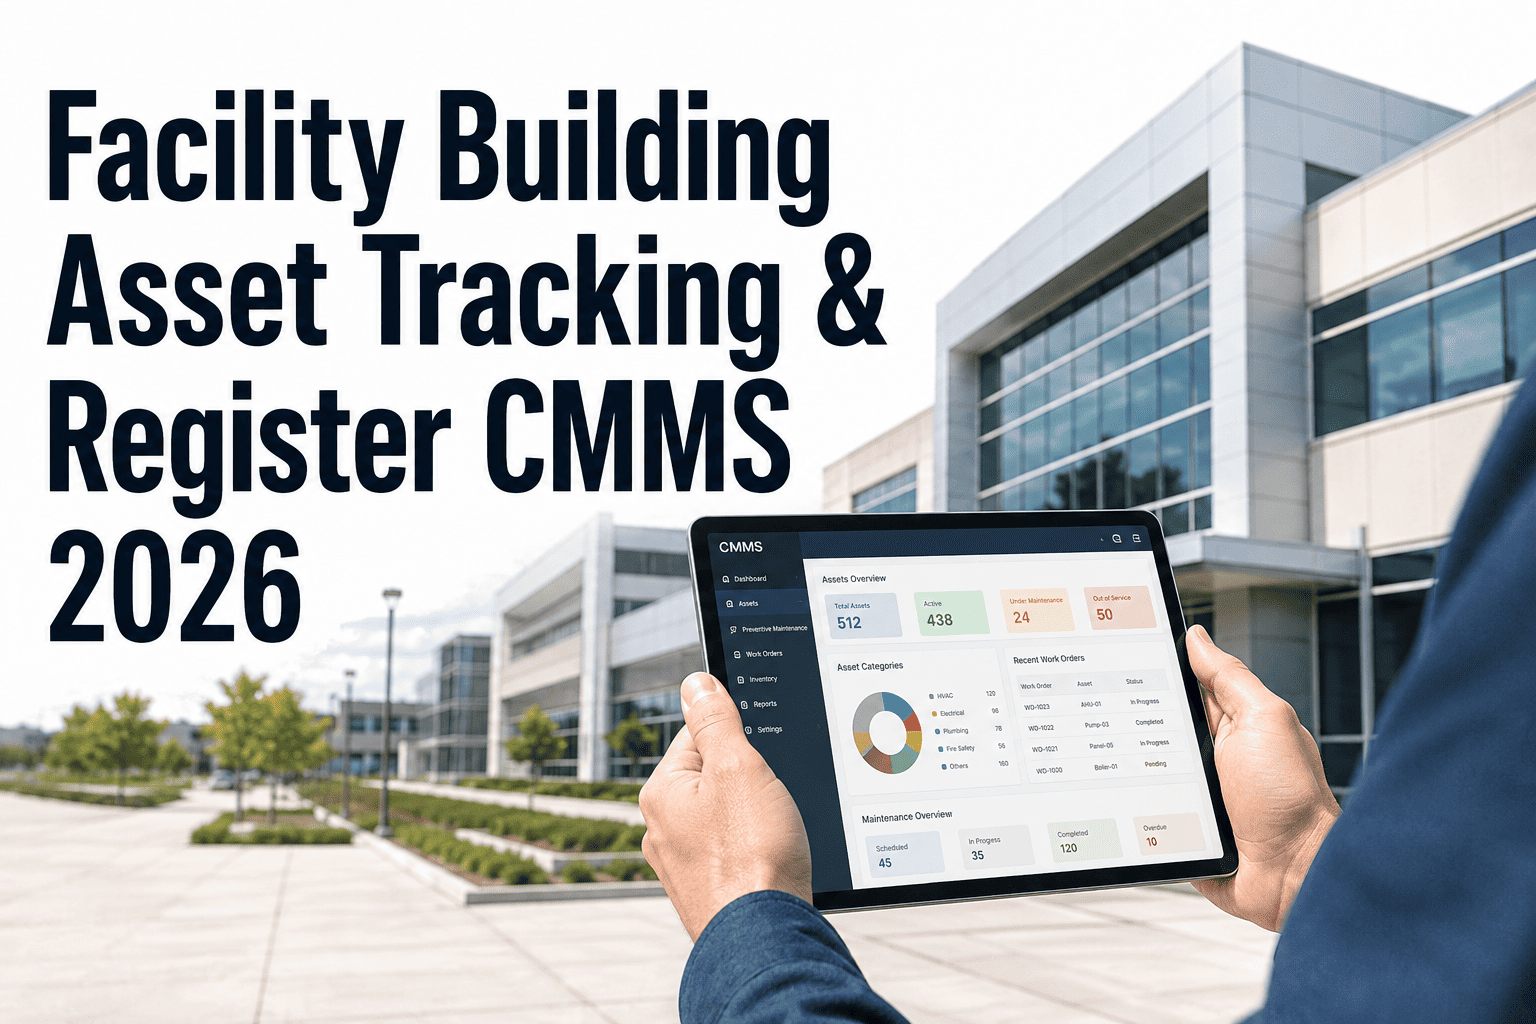
Building asset tracking sits at the core of every mature facility management operation, yet roughly 65% of plants still rely on spreadsheets that lose 12-18% of asset records within the first year of use. A CMMS-backed asset register replaces that fragility with a single source of truth covering hierarchy, location, documentation, and maintenance history. Teams that complete a structured register typically cut equipment lookup time by 40% and reduce unplanned downtime by 18-25% within the first six months. This 2026 guide walks through the register hierarchy, documentation standards, and CMMS workflows that make facility asset visibility real. You can put it into practice today with a Start Free Trial of Oxmaint.
Facility Asset Tracking Guide 2026
Can your team locate, document, and justify every building asset in under 90 seconds?
A complete CMMS-backed asset register gives facility managers full visibility across equipment hierarchy, location mapping, and documentation — cutting audit prep time by up to 60% and recovering an average of $14,000 in lost or double-purchased assets per facility each year.
Asset Register Hierarchy
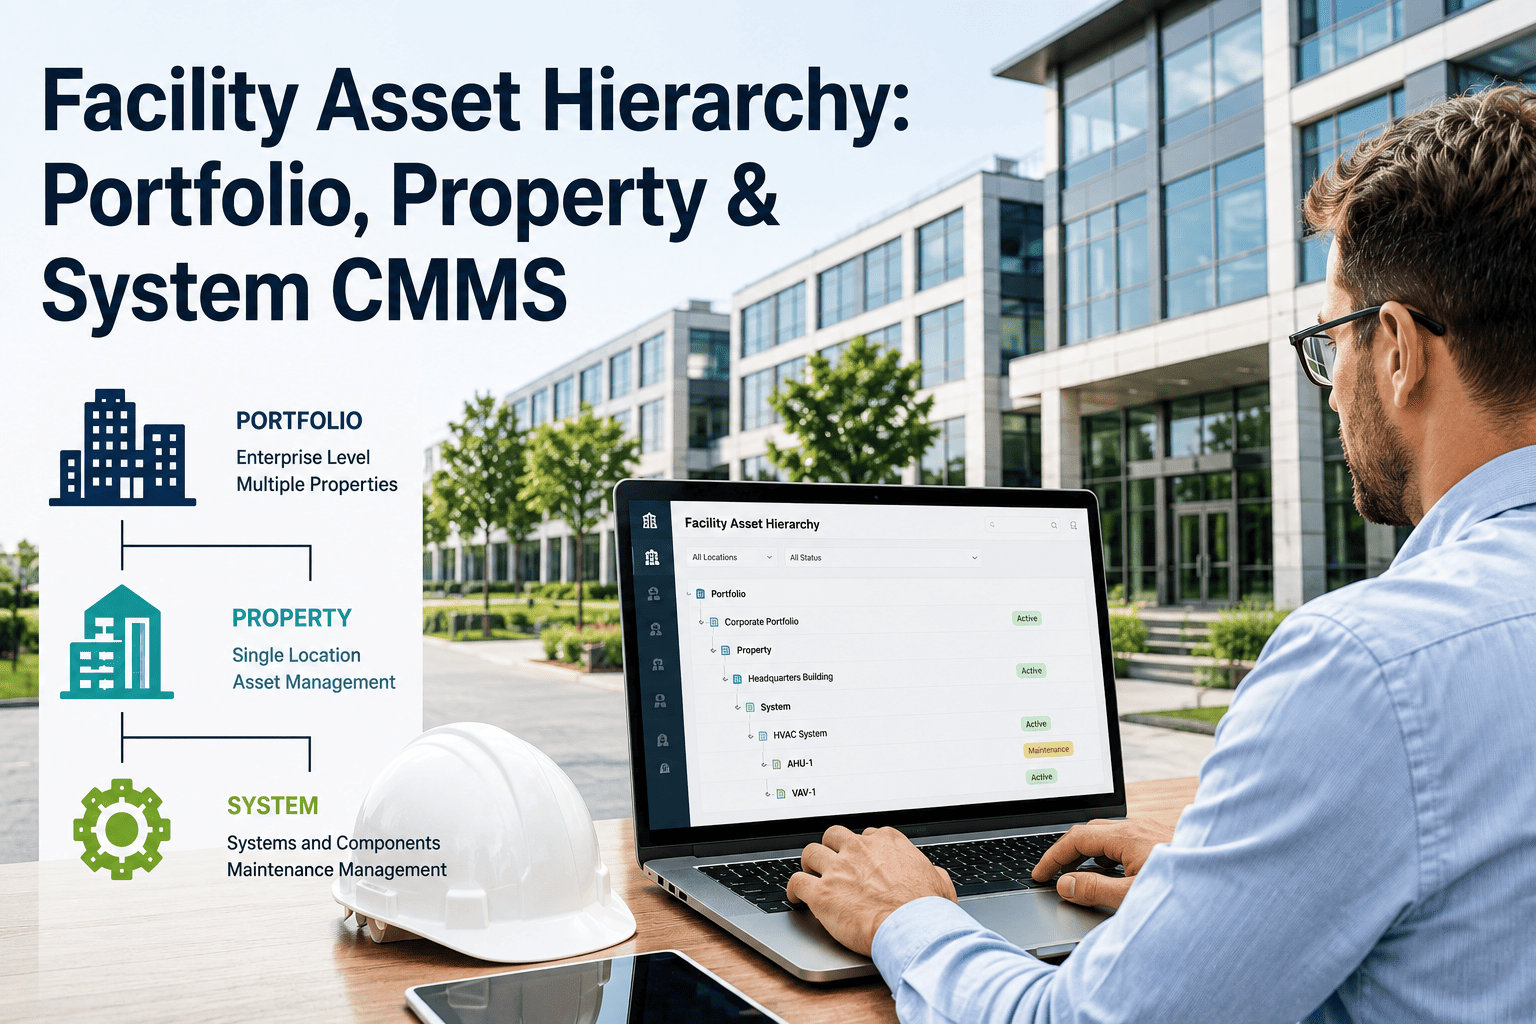
The 4-Level Hierarchy That Keeps Every Asset Accountable
ISO 55000-aligned asset registers group equipment into four nested tiers. Facilities using this structure report 3.2x faster work-order assignment and 28% fewer duplicate-asset records within the first quarter.
Site / Campus
The top node — a single physical address or campus. A 12-building medical complex logs each building as a sub-site under one campus parent, enabling cross-site KPI roll-ups.
Location / Zone
Floor, wing, or functional zone (e.g., Mechanical Room B-2, Rooftop East). Coordinates and parent-child paths let technicians navigate 40% faster during emergency callouts.
System / Assembly
Functional grouping — HVAC, fire suppression, electrical distribution. System-level views surface cascading failures before they spread, protecting OEE above 85%.
Component / Asset
The individual maintainable item — a 25 HP pump, an AHU fan motor, a pressure sensor. Each carries its own PM schedule, criticality rating, and spares list.
Asset Documentation
7 Documentation Fields Every Asset Record Must Carry
Incomplete records cost the average 180-asset facility $42,000 annually in delayed repairs, mis-ordered parts, and repeat failures. These seven fields close that gap.
Unique Asset ID & Barcode
A scannable QR or barcode tied to the CMMS record. Cuts lookup from 4 minutes to under 15 seconds.
Make, Model & Serial Number
Enables accurate parts cross-referencing and warranty claims. Missing serials void 22% of warranty recoveries.
Install Date & Commissioning Record
Anchors lifecycle forecasting and depreciation schedules. Assets past 75% of expected life trigger replacement planning.
Criticality Rating (A / B / C)
A-assets halt production or safety; C-assets are run-to-failure. Drives PM frequency and spares stocking.
Parent Location Path
Full breadcrumb — Campus > Building > Floor > Room > System — so any technician can find the asset on day one.
O&M Manuals & Schematics
Linked PDFs of OEM manuals, P&IDs, and wiring diagrams. Reduces troubleshooting time by 35% on first-time fixes.
Warranty & Service Contract
Contract vendor, coverage window, and SLA terms. Prevents the $2,500 average cost of paying for covered repairs.
The Cost of Inaction
What a 180-Asset Facility Loses Without a CMMS Register
A worked example from a mid-sized manufacturing campus shows how fragmented asset tracking compounds into six-figure annual exposure — and how a CMMS register recovers it.
Annual repair delays from missing manuals and misidentified equipment
Downtime increase tied to untraceable criticality ratings on A-class assets
Duplicate or obsolete spares purchased because no register existed
Warranty claims voided by missing install dates and serial numbers
Worked Scenario
A 180-asset food-processing plant ran on a shared spreadsheet for three years. An audit revealed 31 assets with no recorded location, 14 duplicate pump entries, and $8,200 in warranty-eligible repairs that had been paid out-of-pocket. After migrating to a CMMS register with barcode IDs and parent-child locations, the plant cut average work-order completion time from 6.2 hours to 3.8 hours and recovered full warranty tracking within 90 days — an estimated $61,000 annual savings.
CMMS vs. Spreadsheet
Why Spreadsheets Cap Out Around 50 Assets
Spreadsheets are fine for a 20-asset workshop. Past 50 maintainable items, error rates climb past 30% and version-control chaos makes the file unreliable within a single maintenance cycle.
| Capability | Spreadsheet | CMMS Asset Register |
|---|---|---|
| Real-time location lookup | Manual search, 3-5 min | QR scan, under 15 sec |
| Parent-child hierarchy | Flat rows, no nesting | 4-level nested tree |
| Linked O&M manuals | Separate shared drive | Attached to asset record |
| Work-order history per asset | Cut-and-paste, error-prone | Auto-logged on every WO |
| Criticality-based PM triggers | Manual reminders | Automated, rule-driven |
| Audit-ready reporting | Custom pivot tables | One-click ISO 55000 export |
| Multi-user concurrent access | Broken at 3+ editors | Role-based, unlimited users |
Turn 1,800 scattered asset rows into one navigable register.
Import your existing spreadsheet into Oxmaint and get a structured, scannable, audit-ready asset register in under 48 hours.
Implementation Timeline
From Spreadsheet to Scannable Register in 90 Days
Facilities that follow this phased rollout achieve 95% asset-data completeness by the end of Month 3, compared to 9 months for ad-hoc migrations.
Audit & Cleansing
Walk down every asset, verify physical location, and de-duplicate records. Target: 100% of A-class assets confirmed with photo and QR tag.
Hierarchy & Documentation
Build the 4-level site-system-component tree. Attach OEM manuals, warranties, and P&IDs to each record. Set criticality ratings A/B/C.
PM Linking & Go-Live
Attach preventive maintenance schedules to every maintainable asset. Train technicians on mobile QR lookups. Launch audit-ready dashboards.
Frequently Asked Questions
Facility Asset Tracking & CMMS Register: 5 Answers
How long does it take to migrate an existing asset spreadsheet into a CMMS register?
For a typical 200-asset facility, a structured migration takes 30-45 days. The first two weeks cover data cleansing and de-duplication; the remaining time builds the hierarchy, attaches documentation, and links PM schedules. Oxmaint provides a CSV import template and onboarding support — you can Start Free Trial and begin importing the same day.
What is the difference between an asset register and an asset management system?
An asset register is the structured database — IDs, locations, criticality, documentation. Asset management is the broader ISO 55000 discipline that uses the register to drive lifecycle decisions, risk planning, and investment strategy. The CMMS register is the operational foundation; ISO 55000 builds governance on top of it.
How many asset hierarchy levels should a facility use?
Most facilities need four levels: Site, Location/Zone, System/Assembly, and Component. Complex campuses with multiple buildings may add a Building tier between Site and Location. Going beyond six levels creates navigation overhead without improving lookup speed or reporting clarity.
Can a CMMS asset register support ISO 55000 certification?
Yes. ISO 55000 requires documented asset information, criticality classification, lifecycle plans, and performance measurement. A well-structured CMMS register covers the documentation and criticality requirements directly and feeds the performance data needed for continuous improvement evidence. Book a walkthrough via Book a Demo to see the ISO-aligned fields.
What criticality rating should each asset get?
Use a three-tier model: A-class assets directly affect safety, production, or compliance and need weekly PMs; B-class assets impact operations indirectly with monthly or quarterly PMs; C-class are run-to-failure with minimal PM. Roughly 15-20% of assets fall into A, 50-60% into B, and 25-30% into C across a typical facility.
Build your 2026 facility asset register this week.
Join facility teams using Oxmaint to track thousands of building assets with QR scans, automated PMs, and audit-ready dashboards.
Free 14-day trial · No credit card